Estratégia de reversão de ponto baixo

1
Follow
1779
Followers
Visão geral
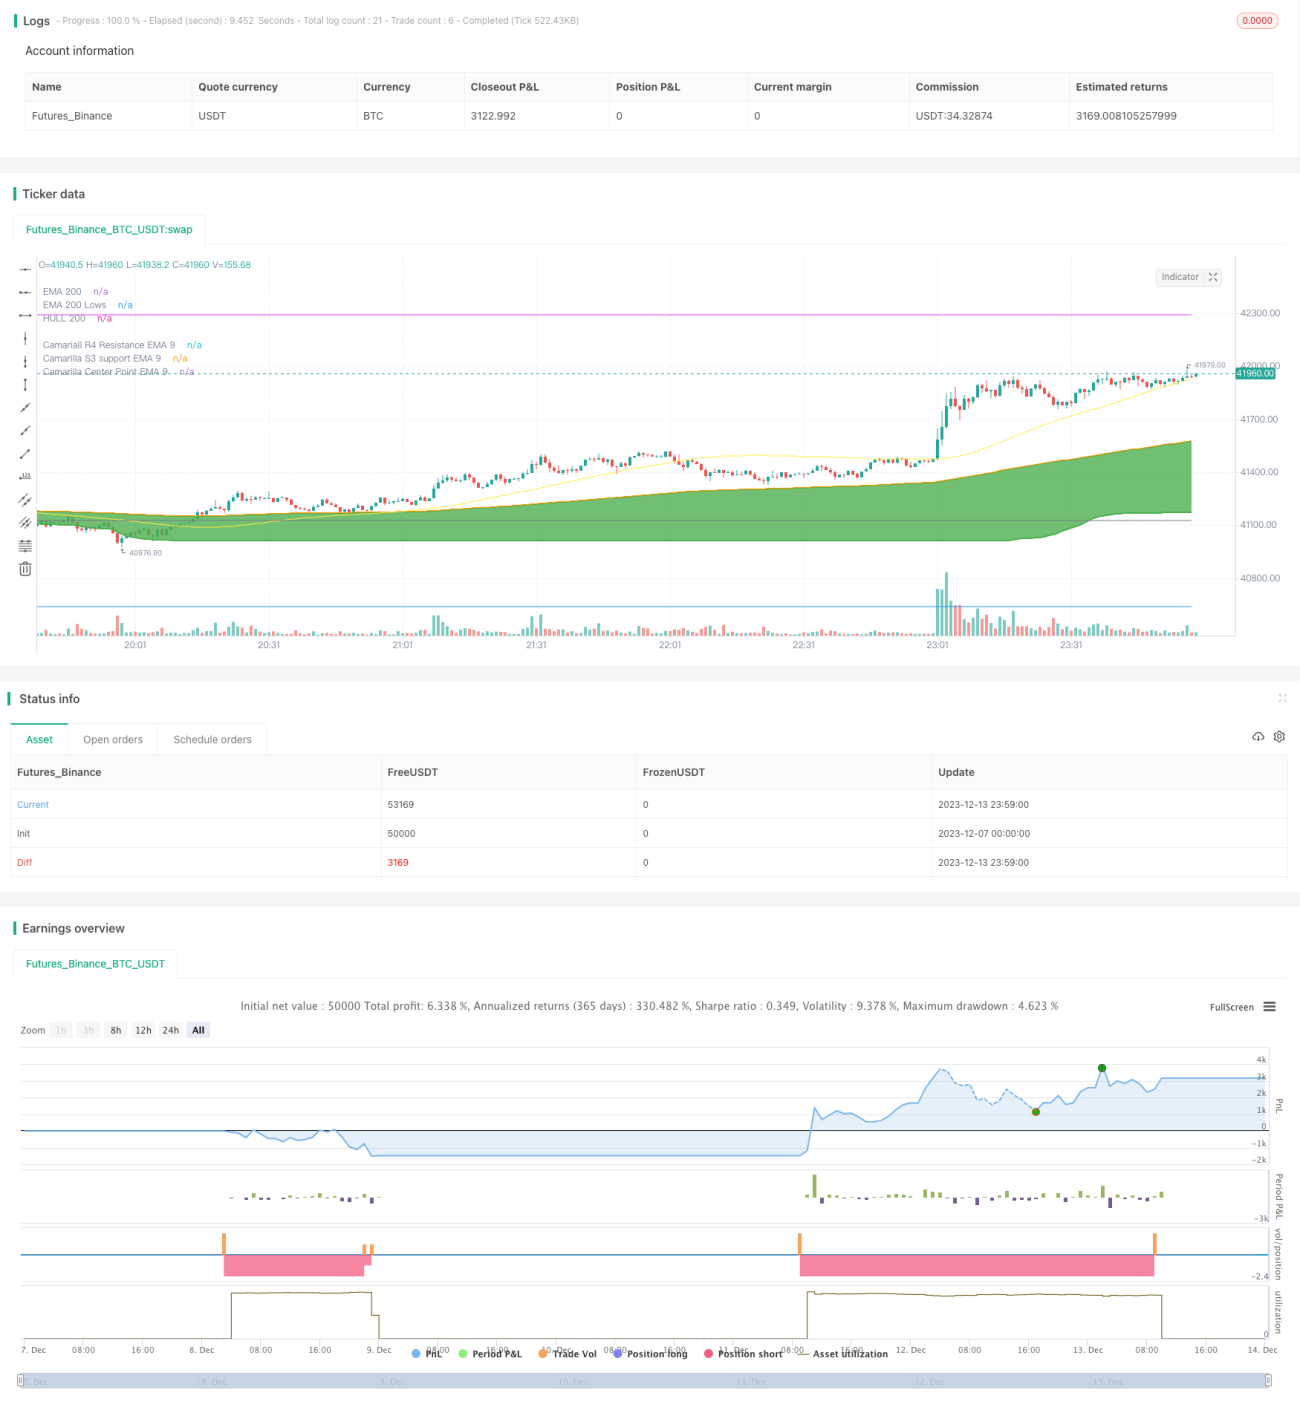
A estratégia é baseada em um mínimo de mercado para a operação de reversão. Utiliza o mínimo da EMA de 200 dias, em combinação com a resistência do suporte de Camaleira para determinar o mínimo do mercado, fazendo uma operação de reversão quando o preço se reverte.
Princípio da estratégia
- O EMA200Lows é calculado quando o preço fecha abaixo desse EMA e é considerado perto do ponto mais baixo do mercado.
- Calcule a EMA de 9 dias em S3 como um suporte importante.
- O EMA de 9 dias do centro de Camaleira, ou seja, o ema_center_9, foi calculado como um sinal de reversão.
- Quando o ema_center_9 usa o ema200Lows, e as 3 primeiras linhas K estão abaixo do ema200Lows, faça a operação de multiplicação.
- O método de parada é a parada ATR e segue o movimento do preço mínimo.
- Os lucros alvo são ema_h4_9 ((resistência da Camarelha 4) e ema_s3_9 ((apoio da Camarelha 3) <unk>
Análise de vantagens
- Use o mínimo da EMA de 200 dias para determinar a região mais baixa do mercado, evitando pontos mais baixos no meio.
- O ponto de apoio de Camaleira, em combinação com o centro, permite uma avaliação mais precisa do ponto de viragem.
- O método ATR de stop loss torna o stop loss mais razoável, o rastreamento de pontos mais baixos é mais vantajoso e o bloqueio de pontos mais lucrativos.
Análise de Riscos
- A estratégia é mais adequada para operações de curto prazo.
- Em condições normais, o stop loss pode ser maior. Pode ser ajustado de acordo com os parâmetros do ATR.
- A inversão de Camaleira não é necessariamente 100% confiável, podendo ocorrer erros de avaliação.
Direção de otimização
- Pode-se considerar a combinação de outros indicadores, como o RSI, para determinar um sinal de inversão.
- Pode-se estudar o ajuste de parâmetros de diferentes variedades, procurando parâmetros mais favoráveis.
- Pode-se experimentar métodos de aprendizagem de máquina para ajustar dinamicamente a parada de ATR.
Resumir
A estratégia utiliza o ponto mais baixo da EMA com o indicador de Camarelha para determinar as áreas mais baixas do mercado e os pontos de reversão. Obtenha lucros com o ATR Stop Loss. No geral, a estratégia é mais completa e tem algum valor de combate.
Source
Pine
/*backtest
start: 2023-12-07 00:00:00
end: 2023-12-14 00:00:00
period: 1m
basePeriod: 1m
exchanges: [{"eid":"Futures_Binance","currency":"BTC_USDT"}]
*/

// This source code is subject to the terms of the Mozilla Public License 2.0 at https://mozilla.org/MPL/2.0/
// © mohanee

//Using the lowest of low of ema200, you can find the bottomStrategy parameters
Related strategies
Comment
All comments (0)
No data
- 1