Estratégia de negociação quantitativa MACD reverso de duas vias
Visão geral
A estratégia é uma estratégia de negociação de quantificação de MACD de retorno de dupla trajetória. Ela baseia-se nos indicadores técnicos descritos por William Blau em seu livro Momento, Direção e Divergência, e é ampliada com base nisso. A estratégia também possui funções de feedback, além de funções adicionais, como alarmes, filtros e rastreamento de perda.
Princípio da estratégia
O indicador central da estratégia é o MACD. Ele calcula a média móvel rápida (EMA) e a média móvel lenta (EMA) e calcula o diferencial xmacd. Além disso, calcula a EMA (signalLength) de xmacd, obtendo xMA_MACD.
Além disso, a estratégia também introduziu um filtro de tendência. Se um filtro de tendência de baixa for configurado, o preço será detectado se ele está subindo; semelhantemente, um sinal de baixa detectará a tendência de queda. O indicador RSI e o indicador MFI também podem ser usados para filtrar a configuração do sinal.
Análise de vantagens
A maior vantagem da estratégia é que a função de retrospecção é poderosa. Você pode escolher diferentes variedades de negociação, configurar o período de retrospecção e otimizar a estratégia para dados de variedades específicas. Em comparação com a estratégia simples de MACD, ela aumenta o julgamento de tendências, sobrecompra e sobrevenda, e pode filtrar alguns sinais de ressonância.
Análise de Riscos
O risco dessa estratégia é derivado principalmente do pensamento de negociação inversa. Embora os sinais de reversão possam obter algumas oportunidades, eles também significam o abandono de alguns pontos de compra e venda tradicionais do MACD, o que precisa ser avaliado com cautela. Além disso, o MACD em si é suscetível a múltiplos falsos sinais. Se ocorrer uma situação de choque, a estratégia pode gerar excesso de negociação, aumentando os custos de negociação e perdas de deslizamento.
Para reduzir o risco, você pode ajustar adequadamente os parâmetros, otimizar o comprimento da média móvel; Combinar tendências e filtros de indicadores, para evitar a geração de sinais em mercados turbulentos; Aumentar adequadamente a distância de parada para garantir o controle de perdas de negociação individual.
Direção de otimização
A estratégia pode ser melhorada em vários aspectos:
- Ajustar os parâmetros de rotação rápida e lenta, otimizar o comprimento da média móvel, testar dados específicos para variedades e encontrar a melhor combinação de parâmetros
- Aumentar ou ajustar o filtro de tendência para avaliar se a estratégia aumenta a rentabilidade com base nos resultados do feedback
- Teste de diferentes mecanismos de stop loss, seja o stop loss fixo ou o stop loss de rastreamento
- Tente combinar outros indicadores, como KD, faixa de Brin, etc., para definir mais condições de filtragem e garantir a qualidade do sinal
Resumir
A estratégia de quantificação MACD inversa de dupla trajetória baseia-se na idéia do indicador MACD clássico, com extensões e melhorias. A estratégia possui simultaneamente uma configuração de parâmetros flexível, uma ampla seleção de mecanismos de filtragem e uma poderosa função de feedback. Isso permite otimização personalizada para diferentes variedades de negociação e é uma estratégia de negociação quantitativa com potencial a ser explorada.
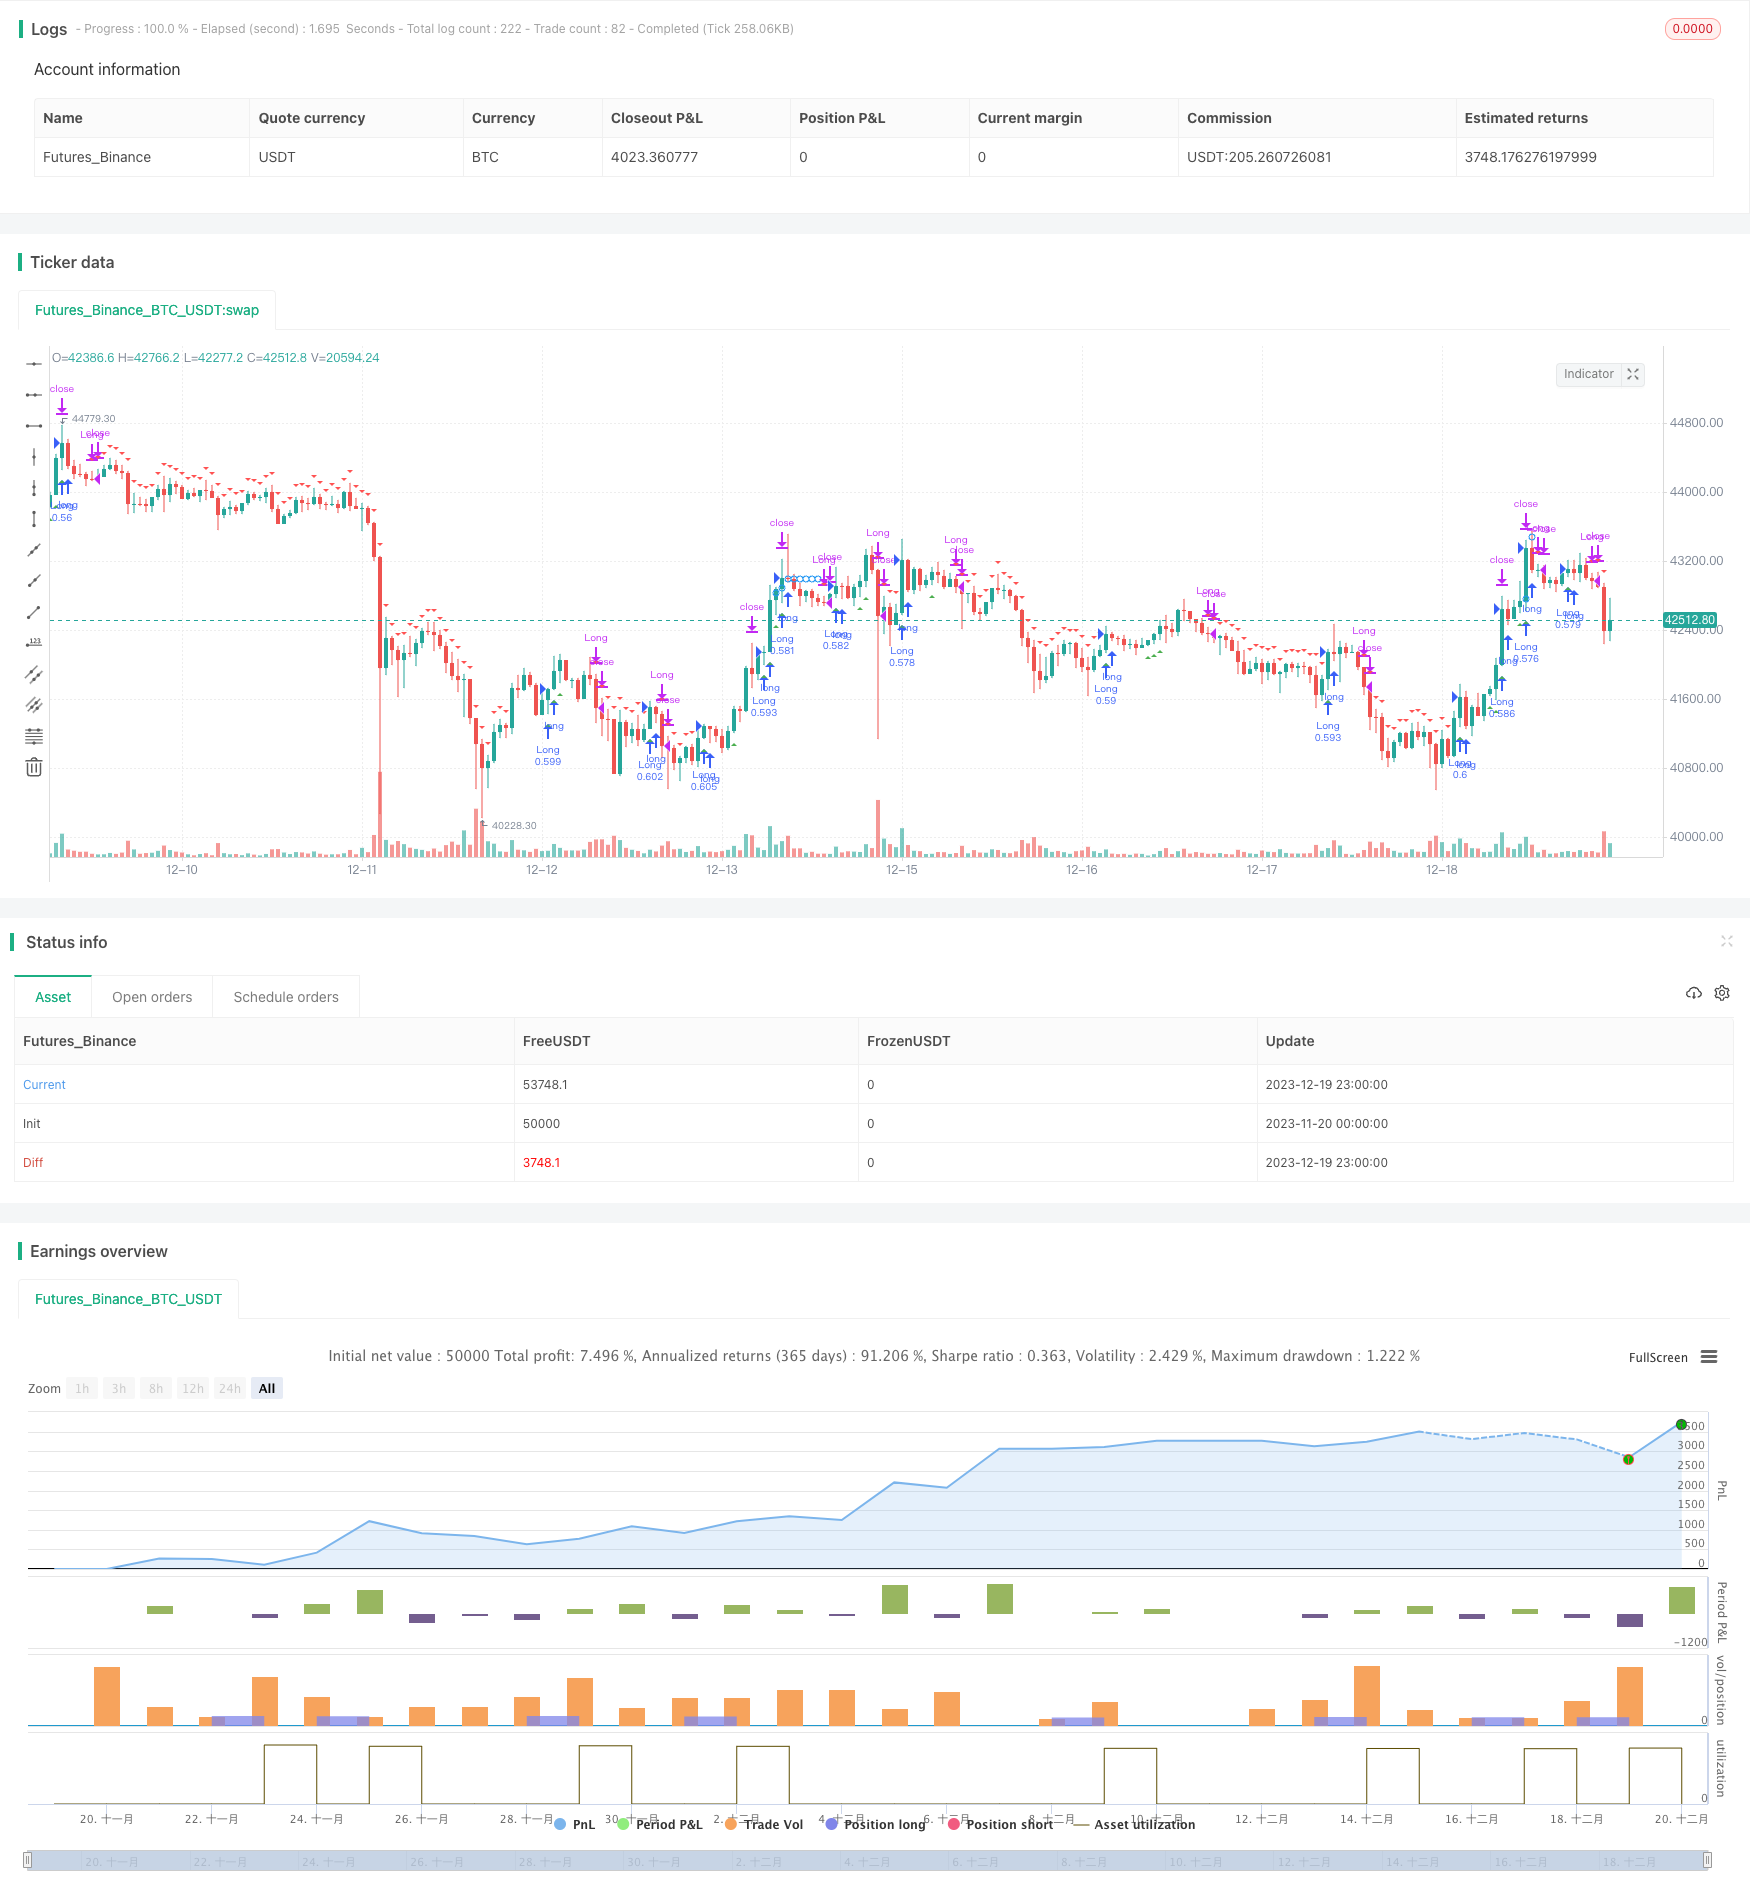
/*backtest
start: 2023-11-20 00:00:00
end: 2023-12-20 00:00:00
period: 1h
basePeriod: 15m
exchanges: [{"eid":"Futures_Binance","currency":"BTC_USDT"}]
*/

//@version = 3
////////////////////////////////////////////////////////////
//  Copyright by HPotter v1.0 09/12/2016
// This is one of the techniques described by William Blau in his book
// "Momentum, Direction and Divergence" (1995). If you like to learn more,
// we advise you to read this book. His book focuses on three key aspects
// of trading: momentum, direction and divergence. Blau, who was an electrical
// engineer before becoming a trader, thoroughly examines the relationship
// between price and momentum in step-by-step examples. From this grounding,
// he then looks at the deficiencies in other oscillators and introduces some
// innovative techniques, including a fresh twist on Stochastics. On directional
// issues, he analyzes the intricacies of ADX and offers a unique approach to help
// define trending and non-trending periods.
// Blau`s indicator is like usual MACD, but it plots opposite of meaningof
// stndard MACD indicator.
//
// You can change long to short in the Input Settings
// Please, use it only for learning or paper trading. Do not for real trading.
//
//
// 2018-09 forked by Khalid Salomão
// - Backtesting
// - Added filters: RSI, MFI, Price trend
// - Trailing Stop Loss
// - Other minor adjustments
//
////////////////////////////////////////////////////////////
strategy(title="Ergotic MACD Backtester [forked from HPotter]", shorttitle="Ergotic MACD Backtester", overlay=true, pyramiding=0, default_qty_type=strategy.cash, default_qty_value=25000, initial_capital=50000, commission_type=strategy.commission.percent, commission_value=0.15, slippage=3)


// === BACKTESTING: INPUT BACKTEST RANGE ===
source = input(close)
strategyType = input(defval="Long Only", options=["Long & Short", "Long Only", "Short Only"])

FromMonth = input(defval = 7, title = "From Month", minval = 1, maxval = 12)
FromDay   = input(defval = 1, title = "From Day", minval = 1, maxval = 31)
FromYear  = input(defval = 2018, title = "From Year", minval = 2017)
ToMonth   = input(defval = 12, title = "To Month", minval = 1, maxval = 12)
ToDay     = input(defval = 1, title = "To Day", minval = 1, maxval = 31)
ToYear    = input(defval = 2030, title = "To Year", minval = 2017)

start     = timestamp(FromYear, FromMonth, FromDay, 00, 00)
finish    = timestamp(ToYear, ToMonth, ToDay, 23, 59)
window()  => true // window of time verification

// === STRATEGY ===

r = input(144, minval=1, title="R (32,55,89,100,144,200)") // default 32
slowMALen = input(6, minval=1) // default 32
signalLength = input(6, minval=1)
reverse = input(false, title="Trade reverse (long/short switch)")

//hline(0, color=blue, linestyle=line)

fastMA = ema(source, r)
slowMA = ema(source, slowMALen)
xmacd = fastMA - slowMA
xMA_MACD = ema(xmacd, signalLength)

pos = 0
pos := iff(xmacd < xMA_MACD, 1,
	   iff(xmacd > xMA_MACD, -1, nz(pos[1], 0)))
possig = 0
possig := iff(reverse and pos == 1, -1,
          iff(reverse and pos == -1, 1, pos))

// === FILTER: price trend ====
trending_price_long = input(true, title="Long only if price has increased" )
trending_price_short = input(false, title="Short only if price has decreased" )
trending_price_length = input( 2, minval=1 )
trending_price_with_ema = input( false )
trending_price_ema = input( 3, minval=1 )
price_trend = trending_price_with_ema ? ema(source, trending_price_ema) : source
priceLongTrend() => (trending_price_long ? rising(price_trend, trending_price_length) : true)
priceShortTrend() => (trending_price_short ? falling(price_trend, trending_price_length) : true)

// === FILTER: RSI ===
rsi_length = input( 14, minval=1 )
rsi_overSold = input( 14, minval=0, title="RSI Sell Cutoff (Sell only if >= #)" )
rsi_overBought = input( 82, minval=0, title="RSI Buy Cutoff (Buy only if <= #)" )

vrsi = rsi(source, rsi_length)
rsiOverbought() => vrsi > rsi_overBought
rsiOversold() => vrsi < rsi_overSold

trending_rsi_long = input(false, title="Long only if RSI has increased" )
trending_rsi_length = input( 2 )
rsiLongTrend() => trending_rsi_long ? rising(vrsi, trending_rsi_length) : true

// === FILTER: MFI ===
mfi_length = input(14, minval=1)
mfi_lower = input(14, minval=0, maxval=50)
mfi_upper = input(82, minval=50, maxval=100)
upper_s = sum(volume * (change(source) <= 0 ? 0 : source), mfi_length)
lower_s = sum(volume * (change(source) >= 0 ? 0 : source), mfi_length)
mf = rsi(upper_s, lower_s)

mfiOverbought() => (mf > mfi_upper)
mfiOversold() => (mf < mfi_lower)

trending_mfi_long = input(false, title="Long only if MFI has increased" )
trending_mfi_length = input( 2 )
mfiLongTrend() => trending_mfi_long ? rising(mf, trending_mfi_length) : true

// === SIGNAL CALCULATION ===
long  = window() and possig == 1 and rsiLongTrend() and mfiLongTrend() and not rsiOverbought() and not mfiOverbought() and priceLongTrend()
short = window() and possig == -1 and not rsiOversold() and not mfiOversold() and priceShortTrend()

// === trailing stop
tslSource=input(hlc3,title="TSL source")
//suseCurrentRes = input(true, title="Use current chart resolution for stop trigger?")
tslResolution = input(title="Use different timeframe for stop trigger? Uncheck box above.", defval="5")
tslTrigger = input(3.0) / 100
tslStop = input(0.6) / 100

currentPrice = request.security(syminfo.tickerid, tslResolution, tslSource, barmerge.gaps_off, barmerge.lookahead_off)

isLongOpen = false
isLongOpen := nz(isLongOpen[1], false)
entryPrice=0.0
entryPrice:= nz(entryPrice[1], 0.0)
trailPrice=0.0
trailPrice:=nz(trailPrice[1], 0.0)

// update TSL high mark
if (isLongOpen )
    if (not trailPrice and currentPrice >= entryPrice * (1 + tslTrigger))
        trailPrice := currentPrice
    else
        if (trailPrice and currentPrice > trailPrice)
            trailPrice := currentPrice

if (trailPrice and currentPrice <= trailPrice * (1 - tslStop))
    // FIRE TSL SIGNAL
    short:=true // <===
    long := false

// if short clean up
if (short)
    isLongOpen := false
    entryPrice := 0.0
    trailPrice := 0.0

if (long)
    isLongOpen := true
    if (not entryPrice)
        entryPrice := currentPrice

// === BACKTESTING: ENTRIES ===
if long
    if (strategyType == "Short Only")
        strategy.close("Short")
    else
        strategy.entry("Long", strategy.long, comment="Long")

if short
    if (strategyType == "Long Only")
        strategy.close("Long")
    else
        strategy.entry("Short", strategy.short, comment="Short")

//barcolor(possig == -1 ? red: possig == 1 ? green : blue )
//plot(xmacd, color=green, title="Ergotic MACD")
//plot(xMA_MACD, color=red, title="SigLin")

plotshape(trailPrice ? trailPrice : na, style=shape.circle, location=location.absolute, color=blue, size=size.tiny)

plotshape(long, style=shape.triangleup, location=location.belowbar, color=green, size=size.tiny)
plotshape(short, style=shape.triangledown, location=location.abovebar, color=red, size=size.tiny)

// === Strategy Alert ===
alertcondition(long, title='BUY - Ergotic MACD Long Entry', message='Go Long!')
alertcondition(short, title='SELL - Ergotic MACD Long Entry', message='Go Short!')

// === BACKTESTING: EXIT strategy ===
sl_inp = input(7, title='Stop Loss %', type=float)/100
tp_inp = input(1.8, title='Take Profit %', type=float)/100

stop_level = strategy.position_avg_price * (1 - sl_inp)
take_level = strategy.position_avg_price * (1 + tp_inp)

strategy.exit("Stop Loss/Profit", "Long", stop=stop_level, limit=take_level)