Modelo de rompimento de fundo duplo para estratégia de momentum
Visão geral
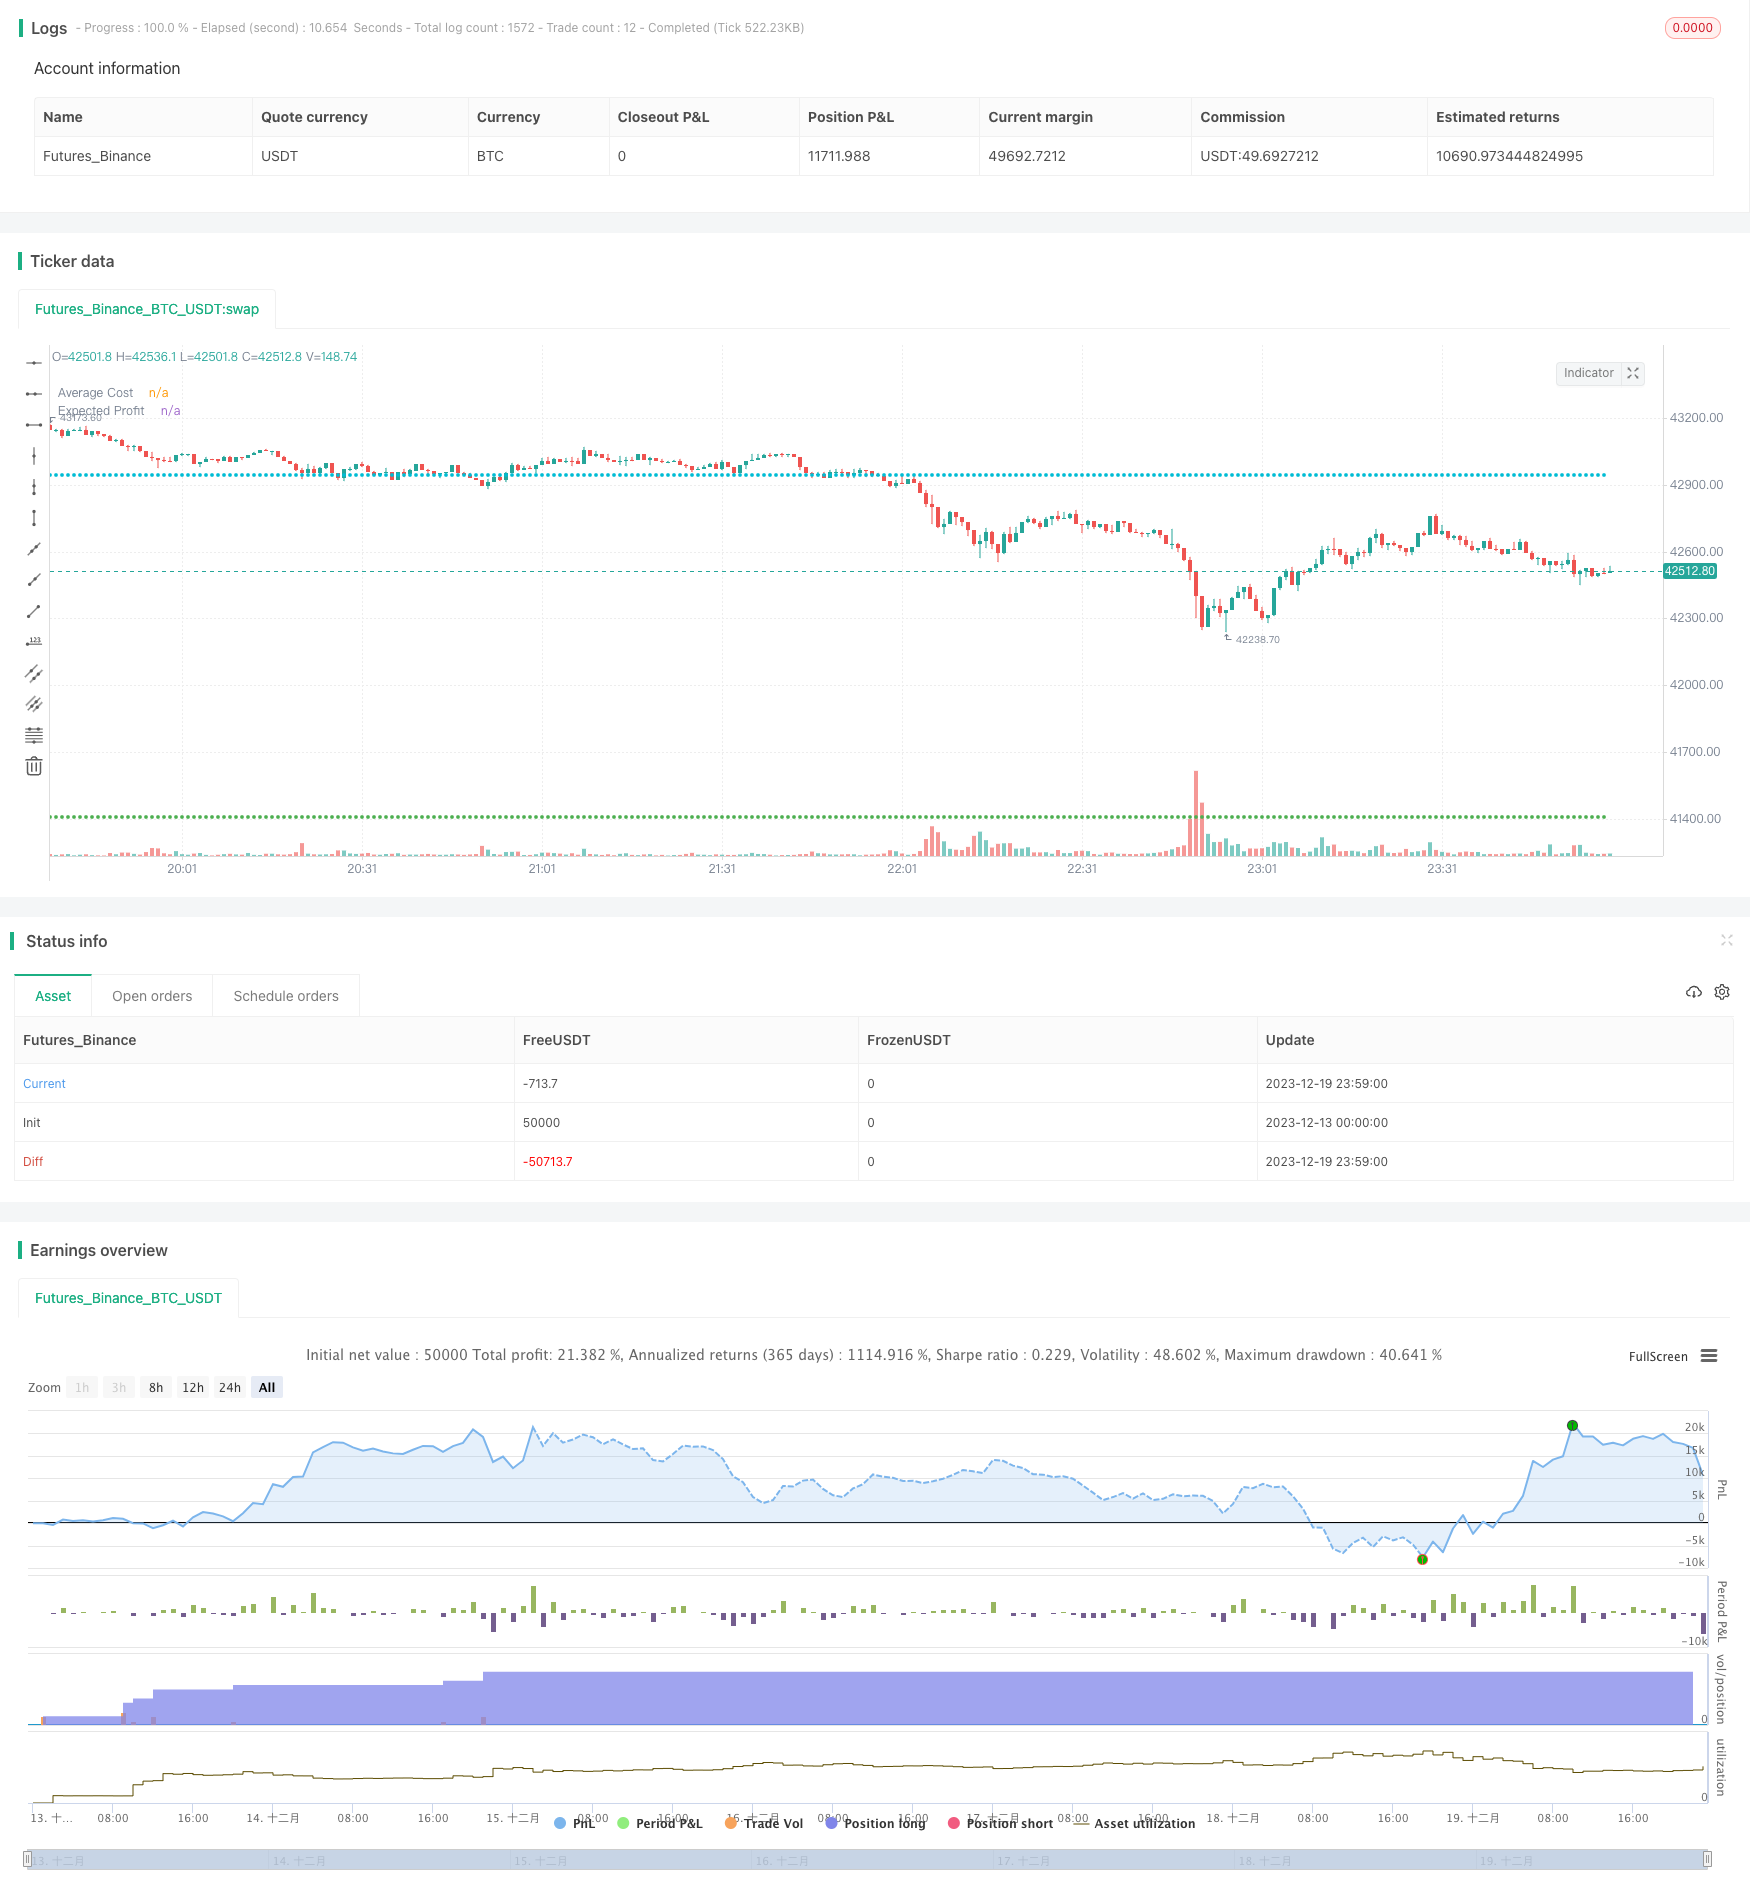
A estratégia é baseada em um modelo de duplo fundo de indicadores técnicos, quando o mercado está em um estado de sobrevenda para procurar um sinal de ruptura de duplo fundo que se forma na região inferior para a operação de compra. A estratégia combina simultaneamente vários indicadores para julgar o estado de sobrevenda e sobrevenda do mercado, emitindo um sinal de compra quando o duplo fundo se forma.
Princípio da estratégia
A estratégia determina principalmente se o preço está formando um duplo fundo perto dos pontos críticos de suporte, e se o mercado está em um estado de supervenda. Concretamente, a estratégia usa os seguintes indicadores para julgar:
Indicador RSI: Quando o indicador RSI mostra que o mercado está em um estado de sobrevenda, é considerado um sinal de compra.
Indicadores RVI: Quando os indicadores RVI mostram que o mercado está em um estado de sobrevenda, é considerado um sinal de compra.
Indicadores MFI: Quando os indicadores MFI mostram que o mercado está em um estado de sobrevenda, é considerado um sinal de compra.
Indicador SAR: Quando o preço sobe e ultrapassa o indicador SAR, é considerado um sinal de compra.
Indicador SMA500: Quando o preço sobe e ultrapassa o SMA500, é considerado um sinal de compra.
A estratégia leva em consideração os resultados dos vários indicadores acima e emite um sinal de compra quando uma forma de duplo fundo se forma perto dos pontos críticos de suporte.
Vantagens estratégicas
A estratégia tem as seguintes vantagens:
A combinação de vários indicadores para avaliar o estado do mercado torna os sinais mais confiáveis.
O sinal de compra é emitido quando o fundo duplo é formado, com uma maior probabilidade de lucro.
A utilização de uma combinação de indicadores para avaliar a situação de sobrevenda e sobrecompra, para evitar a perda de oportunidade de compra.
A combinação de um modelo de ruptura de dupla base com uma estratégia de indicadores, combinando os benefícios de acompanhamento de tendências e negociação de reversão.
Os parâmetros da estratégia podem ser ajustados de acordo com os diferentes mercados.
Risco estratégico
A estratégia também apresenta os seguintes riscos:
A probabilidade de um indicador emitir um falso sinal, levando ao risco de comprar com prejuízos. Pode ser reduzido o falso sinal através da otimização de parâmetros.
Pode-se definir um ponto de parada para reduzir os perdas individuais.
A otimização de parâmetros de alta dimensão é muito difícil e requer um grande número de dados históricos. A otimização pode ser feita gradualmente com algoritmos progressivos.
Dependendo do resultado dos testes com dados históricos, os resultados do disco rígido podem variar. É necessário verificar em diferentes mercados.
Direção de otimização
As principais melhorias da estratégia incluem:
Optimizar os pesos dos indicadores de compra para determinar a combinação de pesos ideal.
Optimizar os parâmetros do indicador para determinar a melhor combinação de parâmetros.
Adicionar estratégias de stop loss para reduzir perdas individuais.
A adição de um módulo de gerenciamento de posições, para que os lucros sejam mais equilibrados.
Combinando algoritmos de aprendizagem de máquina, criar mecanismos de otimização de parâmetros adaptativos.
Resumir
A estratégia integra o modelo de ruptura de dupla base com o julgamento do indicador de oversold, e emite um sinal de compra quando a dupla base se forma perto dos pontos críticos de suporte. O espaço de otimização é maior, o peso, o parâmetro, o stop loss e o posicionamento podem ser ajustados, o que torna a estratégia mais estável e confiável.
/*backtest
start: 2023-12-13 00:00:00
end: 2023-12-20 00:00:00
period: 1m
basePeriod: 1m
exchanges: [{"eid":"Futures_Binance","currency":"BTC_USDT"}]
*/


//@version=5

strategy("UP & DOWN -  BNB/USDT 15min", shorttitle="U&D - BNB 15min", overlay=true, calc_on_order_fills=true, calc_on_every_tick=true, initial_capital = 1000,pyramiding = 40,backtest_fill_limits_assumption = 1, process_orders_on_close=true, currency = currency.USD, default_qty_type = strategy.cash, default_qty_value = 25, commission_type = strategy.commission.percent, commission_value = 0.1)

// This startergy optimized to BNB 15 min standerd candlestic chart and buy & sell signals were based on technical analysis.

UP_DOWN = input.string( title='Trade in', options=['Only on Up Trends', 'Uptrend and down trend'], defval='Uptrend and down trend')
var profit_cal = input.float( defval = 3.7, title = "Expected profit %", minval = 0.2, step = 0.1)

//Backtest dates
fromMonth = input.int(defval = 10,title = "From Month", minval = 1, maxval = 12, group = 'Time Period Values')
fromDay   = input.int(defval = 1,    title = "From Day", minval = 1, maxval = 31, group = 'Time Period Values')
fromYear  = input.int(defval = 2021, title = "From Year", minval = 1970, group = 'Time Period Values')
thruMonth = input.int(defval = 1,    title = "Thru Month", minval = 1, maxval = 12, group = 'Time Period Values')
thruDay   = input.int(defval = 1,    title = "Thru Day", minval = 1, maxval = 31, group = 'Time Period Values')
thruYear  = input.int(defval = 2112, title = "Thru Year", minval = 1970, group = 'Time Period Values')

//showDate  = input(defval = true, title = "Show Date Range", group = 'Time Period Values')

start     = timestamp(fromYear, fromMonth, fromDay, 00, 00)        // backtest start window
finish    = timestamp(thruYear, thruMonth, thruDay, 23, 59)        // backtest finish window
window()  => true

// inputs
//Inputs of SAR Indicator
sar1 = input.float(defval=0.0002, title='SAR value 1',step=0.0001, group = 'SAR Values')
sar2 = input.float(defval=0.0004, title='SAR value 2',step=0.0001, group = 'SAR Values')
sar3 = input.float(defval=0.1, title='SAR value 3',step=0.1, group = 'SAR Values')
src_close = input(close, "SAR Source - close", group = 'SAR Values')
src_open = input(open, "SAR Source - open", group = 'SAR Values')
bool sar_visible = input(false, "Show SAR",group = 'SAR Values' )
// Inputs of Super trend indicator
ST_T = input.int(defval=16, title = 'Supertrend - Trend', step =1, group = 'Super Trend')
ST_D = input.int(defval=7, title = 'Supertrend - Direction', step =1, group = 'Super Trend')
ST_SMA = input.int(defval=1, title = 'Supertrend - SMA', step = 1, group = 'Super Trend')
bool ST_visible = input(false, "Show Super Trend",group = 'Super Trend' )
//Inputs of SMA500 indicator
src_sma500 = input(high, 'SMA500 - Source', group = 'SMA500')
lb_sma500 = input.int(defval = 143, title = 'SMA500 - Look back period', step=10, group = 'SMA500')
bool sma500_visible = input(false, "Show SMA500",group = 'SMA500' )


// Calculations
// SMA500 Indicator
SMA500 = ta.sma(src_sma500,lb_sma500)
SMA700 = ta.sma(close,700)
SMA_Open = ta.sma(open,9)
//SMA9 Indicator
SMA9 = ta.sma((high+low)/2,5)
risingSMA9 = ta.rising(SMA9,1)
fallingSMA9 = ta.falling(SMA9,1)
color  plotcolor1 = color.black
if risingSMA9
    plotcolor1 := color.green

// SAR Indicator
sar = ta.sar(sar1, sar2, sar3)
sma2_close = ta.sma(src_close,1)
sma2_open = ta.sma(src_open,1)

//Supertrend
[supertrend, direction] = ta.supertrend(ST_T, ST_D)
up_trend = ta.sma(direction < 0 ? supertrend : na,ST_SMA)
down_trend = ta.sma(direction < 0? na : supertrend, ST_SMA)

// Color change
color  plotcolor2 = color.green
if open>down_trend or close>down_trend
    plotcolor2 := color.lime
if open<down_trend or close<down_trend
    plotcolor2 := color.red

color plotcolor3 = color.green
if open>up_trend or close>up_trend
    plotcolor3 := color.yellow
if open<up_trend or close<up_trend
    plotcolor3 := color.red

color plotcolor4 = color.black
if (open>sar or close>sar)
    plotcolor4 := color.white
if (open<sar or close<sar)
    plotcolor4 := color.red

color plotcolor5 = color.black
if (open>SMA500 or close>SMA500)
    plotcolor5 := color.green
if (open<SMA500 or close<SMA500)
    plotcolor5 := color.red

color plotcolor6 = color.green
rising_taalma = ta.rising (ta.alma(open,10,.99,1),1)
falling_taalma = ta.falling (ta.alma(open,10,.99,1),1)

if rising_taalma
    plotcolor6 := color.green
if falling_taalma
    plotcolor6 := color.red

// buy and sell conditions for uptrend

longCondition1 = (open >= down_trend or high>= down_trend or ta.crossover(open,down_trend)or ta.crossover(high,down_trend))
longCondition2 = (open >= up_trend or high>= up_trend or ta.crossover(open,up_trend)or ta.crossover(high,up_trend))
longCondition3 = (open >= SMA500 or high>= SMA500 or ta.crossover(open,SMA500)or ta.crossover(high,SMA500))
longCondition4 = (open >= sar or high>= sar or ta.crossover(open,sar)or ta.crossover(high,sar))
longCondition5 = rising_taalma

shortCondition1 = (close < down_trend or low< down_trend or ta.crossunder(close,down_trend)or ta.crossunder(low,down_trend))
shortCondition2 = (close < up_trend or low< up_trend or ta.crossunder(close,up_trend)or ta.crossunder(low,up_trend))
shortCondition3 = (close < SMA500 or low< SMA500 or ta.crossunder(close,SMA500)or ta.crossunder(low,SMA500))
shortCondition4 = (close < sar or low< sar or ta.crossunder(close,sar)or ta.crossunder(low,sar))
shortCondition5 = falling_taalma

comp_buy1 = longCondition1 and longCondition2 and longCondition3 and longCondition4 and longCondition5
op_buy1 = shortCondition3 and longCondition1 and longCondition2 and longCondition4
op_buy2 = shortCondition1 and shortCondition2 and longCondition3 and longCondition4 and longCondition5

comp_sell1 = shortCondition1 and shortCondition2 and shortCondition3 and shortCondition4 and shortCondition5
op_sell1 = shortCondition3 and shortCondition4 and longCondition1 and longCondition2
op_sell2 = shortCondition4 and longCondition1 and longCondition2 and longCondition3
op_sell3 = longCondition2 and shortCondition1 and shortCondition4 and shortCondition3
op_sell4 = longCondition2 and shortCondition1 and shortCondition4

var b1 = 0
var b2 = 0
var b3 = 0

if comp_buy1 == true and comp_buy1[1] == false
    b1 := 1
else
    b1 := 0


if op_buy1 == true and op_buy1[1] == false
    b2 := 1
else
    b2 := 0


if op_buy2 == true and op_buy2[1] == false
    b3 := 1
else
    b3 := 0

// DCA method based on indicators

//RSI Indicator
len_rsi_10 = input.int(10,  title="Length", group = "RSI Indicator - 10", minval=1, maxval = 10, step = 1)
src_rsi_10 = input(ohlc4, "Source", group = "RSI Indicator - 10")
up_rsi_10 = ta.rma(math.max(ta.change(src_rsi_10), 0), len_rsi_10)
down_rsi_10 = ta.rma(-math.min(ta.change(src_rsi_10), 0), len_rsi_10)
rsi_10 = down_rsi_10 == 0 ? 100 : up_rsi_10 == 0 ? 0 : 100 - (100 / (1 + up_rsi_10 / down_rsi_10))

var p_rsi = 0

if rsi_10>= 0 and rsi_10<10
    p_rsi := 0
else if rsi_10>= 10 and rsi_10<20
    p_rsi := 10
else if rsi_10>= 20 and rsi_10<30
    p_rsi := 20
else if rsi_10>= 30 and rsi_10<40
    p_rsi := 30
else if rsi_10>= 40 and rsi_10<50
    p_rsi := 40
else if rsi_10>= 50 and rsi_10<60
    p_rsi := 50
else if rsi_10>= 60 and rsi_10<70
    p_rsi := 60
else if rsi_10>= 70 and rsi_10<80
    p_rsi := 70
else if rsi_10>= 80 and rsi_10<90
    p_rsi := 80
else if rsi_10>= 90 and rsi_10<100
    p_rsi := 90

len_rsi_50 = input.int(50, title="Length", group = "RSI Indicator - 50", minval=11, maxval = 50, step = 1)
src_rsi_50 = input(high, "Source", group = "RSI Indicator - 50")
up_rsi_50 = ta.rma(math.max(ta.change(src_rsi_50), 0), len_rsi_50)
down_rsi_50 = ta.rma(-math.min(ta.change(src_rsi_50), 0), len_rsi_50)
rsi_50 = down_rsi_50 == 0 ? 100 : up_rsi_50 == 0 ? 0 : 100 - (100 / (1 + up_rsi_50 / down_rsi_50))

var p_rsi_50 = 0

if rsi_50>= 0 and rsi_50<10
    p_rsi_50 := 0
else if rsi_50>= 10 and rsi_50<20
    p_rsi_50 := 10
else if rsi_50>= 20 and rsi_50<30
    p_rsi_50 := 20
else if rsi_50>= 30 and rsi_50<40
    p_rsi_50 := 30
else if rsi_50>= 40 and rsi_50<50
    p_rsi_50 := 40
else if rsi_50>= 50 and rsi_50<60
    p_rsi_50 := 50
else if rsi_50>= 60 and rsi_50<70
    p_rsi_50 := 60
else if rsi_50>= 70 and rsi_50<80
    p_rsi_50 := 70
else if rsi_50>= 80 and rsi_50<90
    p_rsi_50 := 80
else if rsi_50>= 90 and rsi_50<100
    p_rsi_50 := 90

len_rsi_100 = input.int(100, title="Length", group = "RSI Indicator - 100", minval=51, maxval = 200, step = 10)
src_rsi_100 = input(ohlc4, "Source", group = "RSI Indicator - 100")
up_rsi_100 = ta.rma(math.max(ta.change(src_rsi_100), 0), len_rsi_100)
down_rsi_100 = ta.rma(-math.min(ta.change(src_rsi_100), 0), len_rsi_100)
rsi_100 = down_rsi_100 == 0 ? 100 : up_rsi_100 == 0 ? 0 : 100 - (100 / (1 + up_rsi_100 / down_rsi_100))

var p_rsi_100 = 0

if rsi_100>= 0 and rsi_100<10
    p_rsi_100 := 0
else if rsi_100>= 10 and rsi_100<20
    p_rsi_100 := 10
else if rsi_100>= 20 and rsi_100<30
    p_rsi_100 := 20
else if rsi_100>= 30 and rsi_100<40
    p_rsi_100 := 30
else if rsi_100>= 40 and rsi_100<50
    p_rsi_100 := 40
else if rsi_100>= 50 and rsi_100<60
    p_rsi_100 := 50
else if rsi_100>= 60 and rsi_100<70
    p_rsi_100 := 60
else if rsi_100>= 70 and rsi_100<80
    p_rsi_100 := 70
else if rsi_100>= 80 and rsi_100<90
    p_rsi_100 := 80
else if rsi_100>= 90 and rsi_100<100
    p_rsi_100 := 90

// Relative Volatility Indicator
length_rvi_10 = input.int(defval = 10, minval=1, maxval = 10, step = 1, title="Length - RVI", group = "RVI Indicator - 10")
len_rvi_10 = input.int(defval = 10, minval=1, maxval = 10, step = 1, title="Length - EMA", group = "RVI Indicator - 10")
src_rvi_10 = input(high, title = "Source", group = "RVI Indicator - 10")
stddev_rvi_10 = ta.stdev(src_rvi_10, length_rvi_10)
upper_rvi_10 = ta.ema(ta.change(src_rvi_10) <= 0 ? 0 : stddev_rvi_10, len_rvi_10)
lower_rvi_10 = ta.ema(ta.change(src_rvi_10) > 0 ? 0 : stddev_rvi_10, len_rvi_10)
rvi_10 = upper_rvi_10 / (upper_rvi_10 + lower_rvi_10) * 100

var p_rvi_10 = 0

if rvi_10 >= 0 and rvi_10 <10
    p_rvi_10 := 0
else if rvi_10 >= 10 and rvi_10 <20
    p_rvi_10 := 10
else if rvi_10 >= 20 and rvi_10 <30
    p_rvi_10 := 20
else if rvi_10 >= 30 and rvi_10 <40
    p_rvi_10 := 30
else if rvi_10 >= 40 and rvi_10 <50
    p_rvi_10 := 40
else if rvi_10 >= 50 and rvi_10 <60
    p_rvi_10 := 50
else if rvi_10 >= 60 and rvi_10 <70
    p_rvi_10 := 60
else if rvi_10 >= 70 and rvi_10 <80
    p_rvi_10 := 70
else if rvi_10 >= 80 and rvi_10 <90
    p_rvi_10 := 80
else if rvi_10 >= 90 and rvi_10 <100
    p_rvi_10 := 90

length_rvi_50 = input.int(defval = 50, minval=11, maxval = 50, step = 1, title="Length - RVI", group = "RVI Indicator - 50")
len_rvi_50 = input.int(defval = 50, minval=11, maxval = 50, step = 1, title="Length - EMA", group = "RVI Indicator - 50")
src_rvi_50 = input(close, title = "source", group = "RVI Indicator - 50")
stddev_rvi_50 = ta.stdev(src_rvi_50, length_rvi_50)
upper_rvi_50 = ta.ema(ta.change(src_rvi_50) <= 0 ? 0 : stddev_rvi_50, len_rvi_50)
lower_rvi_50 = ta.ema(ta.change(src_rvi_50) > 0 ? 0 : stddev_rvi_50, len_rvi_50)
rvi_50 = upper_rvi_50 / (upper_rvi_50 + lower_rvi_50) * 100

var p_rvi_50 = 0

if rvi_50 >= 0 and rvi_50 <10
    p_rvi_50 := 0
else if rvi_50 >= 10 and rvi_50 <20
    p_rvi_50 := 10
else if rvi_50 >= 20 and rvi_50 <30
    p_rvi_50 := 20
else if rvi_50 >= 30 and rvi_50 <40
    p_rvi_50 := 30
else if rvi_50 >= 40 and rvi_50 <50
    p_rvi_50 := 40
else if rvi_50 >= 50 and rvi_50 <60
    p_rvi_50 := 50
else if rvi_50 >= 60 and rvi_50 <70
    p_rvi_50 := 60
else if rvi_50 >= 70 and rvi_50 <80
    p_rvi_50 := 70
else if rvi_50 >= 80 and rvi_50 <90
    p_rvi_50 := 80
else if rvi_50 >= 90 and rvi_50 <100
    p_rvi_50 := 90


length_rvi_100 = input.int(defval = 100, minval=51, maxval = 200, step = 10, title="Length - RVI", group = "RVI Indicator - 100")
len_rvi_100 = input.int(defval = 100, minval=51, maxval = 200, step = 10, title="Length - EMA", group = "RVI Indicator - 100")
src_rvi_100 = input(close, title = "Source", group = "RVI Indicator - 100")
stddev_rvi_100 = ta.stdev(src_rvi_100, length_rvi_100)
upper_rvi_100 = ta.ema(ta.change(src_rvi_100) <= 0 ? 0 : stddev_rvi_100, len_rvi_100)
lower_rvi_100 = ta.ema(ta.change(src_rvi_100) > 0 ? 0 : stddev_rvi_100, len_rvi_100)
rvi_100 = upper_rvi_100 / (upper_rvi_100 + lower_rvi_100) * 100


var p_rvi_100 = 0

if rvi_100 >= 0 and rvi_100 <10
    p_rvi_100 := 0
else if rvi_100 >= 10 and rvi_100 <20
    p_rvi_100 := 10
else if rvi_100 >= 20 and rvi_100 <30
    p_rvi_100 := 20
else if rvi_100 >= 30 and rvi_100 <40
    p_rvi_100 := 30
else if rvi_100 >= 40 and rvi_100 <50
    p_rvi_100 := 40
else if rvi_100 >= 50 and rvi_100 <60
    p_rvi_100 := 50
else if rvi_100 >= 60 and rvi_100 <70
    p_rvi_100 := 60
else if rvi_100 >= 70 and rvi_100 <80
    p_rvi_100 := 70
else if rvi_100 >= 80 and rvi_100 <90
    p_rvi_100 := 80
else if rvi_100 >= 90 and rvi_100 <100
    p_rvi_100 := 90

// Money flow index
len_mfi_10 = input.int(defval = 10, minval=1, maxval = 10, step = 1, title="Length - MFI", group = "MFI Indicator - 10")
src_mfi_10 = input(high, title = "source", group = "MFI Indicator - 10")
mf_10 = ta.mfi(src_mfi_10, len_mfi_10)

var p_mfi_10 = 0

if mf_10>= 0 and mf_10<10
    p_mfi_10 := 0
else if mf_10>= 10 and mf_10<20
    p_mfi_10 := 10
else if mf_10>= 20 and mf_10<30
    p_mfi_10 := 20
else if mf_10>= 30 and mf_10<40
    p_mfi_10 := 30
else if mf_10>= 40 and mf_10<50
    p_mfi_10 := 40
else if mf_10>= 50 and mf_10<60
    p_mfi_10 := 50
else if mf_10>= 60 and mf_10<70
    p_mfi_10 := 60
else if mf_10>= 70 and mf_10<80
    p_mfi_10 := 70
else if mf_10>= 80 and mf_10<90
    p_mfi_10 := 80
else if mf_10>= 90 and mf_10<100
    p_mfi_10 := 90

len_mfi_50 = input.int(defval = 50, minval=11, maxval = 50, step = 1, title="Length - MFI", group = "MFI Indicator - 50")
src_mfi_50 = input(high, title = "source", group = "MFI Indicator - 50")
mf_50 = ta.mfi(src_mfi_50, len_mfi_50)

var p_mfi_50 = 0

if mf_50>= 0 and mf_50<10
    p_mfi_50 := 0
else if mf_50>= 10 and mf_50<20
    p_mfi_50 := 10
else if mf_50>= 20 and mf_50<30
    p_mfi_50 := 20
else if mf_50>= 30 and mf_50<40
    p_mfi_50 := 30
else if mf_50>= 40 and mf_50<50
    p_mfi_50 := 40
else if mf_50>= 50 and mf_50<60
    p_mfi_50 := 50
else if mf_50>= 60 and mf_50<70
    p_mfi_50 := 60
else if mf_50>= 70 and mf_50<80
    p_mfi_50 := 70
else if mf_50>= 80 and mf_50<90
    p_mfi_50 := 80
else if mf_50>= 90 and mf_50<100
    p_mfi_50 := 90

len_mfi_100 = input.int(defval = 100, minval=51, maxval = 200, step = 10, title="Length - MFI", group = "MFI Indicator - 100")
src_mfi_100 = input(high, title = "source", group = "MFI Indicator - 100")
mf_100 = ta.mfi(src_mfi_100, len_mfi_100)

var p_mfi_100 = 0

if mf_100>= 0 and mf_100<10
    p_mfi_100 := 0
else if mf_100>= 10 and mf_100<20
    p_mfi_100 := 10
else if mf_100>= 20 and mf_100<30
    p_mfi_100 := 20
else if mf_100>= 30 and mf_100<40
    p_mfi_100 := 30
else if mf_100>= 40 and mf_100<50
    p_mfi_100 := 40
else if mf_100>= 50 and mf_100<60
    p_mfi_100 := 50
else if mf_100>= 60 and mf_100<70
    p_mfi_100 := 60
else if mf_100>= 70 and mf_100<80
    p_mfi_100 := 70
else if mf_100>= 80 and mf_100<90
    p_mfi_100 := 80
else if mf_100>= 90 and mf_100<100
    p_mfi_100 := 90

//Balance of power indicator
bop = ((((close - open) / (high - low))*100)+50)
bop_sma_100 = ta.sma(bop,100)


// Buy and Sell lavels based on Indicators
l_val_rsi = input.int (defval = 40, title = "Lower value of RSI", maxval = 100, minval = 0, step = 10, group = 'Indicator Values')
l_val_rvi = input.int (defval = 40, title = "Lower value of RVI", maxval = 100, minval = 0, step = 10, group = 'Indicator Values')
l_val_mfi = input.int (defval = 40, title = "Lower value of MFI", maxval = 100, minval = 0, step = 10, group = 'Indicator Values')

//h_val_rsi = input.int (defval = 60, title = "Higher value of RSI", maxval = 100, minval = 0, step = 10, group = 'Indicator Values')
//h_val_rvi = input.int (defval = 50, title = "Higher value of RVI", maxval = 100, minval = 0, step = 10, group = 'Indicator Values')
//h_val_mfi = input.int (defval = 50, title = "Higher value of MFI", maxval = 100, minval = 0, step = 10, group = 'Indicator Values')

buy_rsi = p_rsi_100 <= l_val_rsi and p_rsi_50<p_rsi_100 and p_rsi<=p_rsi_50
buy_rvi = p_rvi_100 <= l_val_rvi and p_rvi_50<=p_rvi_100 and p_rvi_10<=p_rvi_50
buy_mfi = p_mfi_100 <= l_val_mfi and p_mfi_50<=p_mfi_100 and p_mfi_10<=p_mfi_50

buy_compound = buy_rsi and buy_rvi and buy_mfi ? 100 : 0

var float  buy_compound_f = na
if (buy_compound[1] == 100 and buy_compound == 0) //and open > close
    buy_compound_f := 1
else
    buy_compound_f := na

ma_9 = ta.ema(close,2)
co_l1 = strategy.position_avg_price*0.95
co_l2 = strategy.position_avg_price*0.90
co_l3 = strategy.position_avg_price*0.85
co_l4 = strategy.position_avg_price*0.80

//Take profit in Market bottoms
profit_f = 1.0 + (profit_cal/100)


// Trading
var final_option = UP_DOWN == 'Uptrend and down trend' ? 1 : 2

if final_option == 1
    if  ((buy_compound_f ==1 or ta.crossover(ma_9, co_l1) or ta.crossover(ma_9, co_l2) or ta.crossover(ma_9, co_l3) or ta.crossover(ma_9, co_l4)) and window())
        strategy.entry("long", strategy.long,comment = "BUY")
    else if ( comp_sell1 and window()) and strategy.position_avg_price * profit_f < close
        strategy.close("long", qty_percent = 100, comment = "SELL")
else if final_option == 2
    if (b1 or b2 or b3) and window()
        strategy.entry("long", strategy.long, comment = "BUY")
    else if (comp_sell1 or op_sell1 or op_sell2 or op_sell3 or op_sell4 ) and window()
        strategy.close("long", qty_percent = 100, comment = "SELL")


bool PM_visible = input(false, "Show Profit marjin and average price", group = 'Safty Margins')
bool SM_visible = input(false, "Show Safty Grids", group = 'Safty Margins' )


//Graphs

plot(PM_visible or final_option == 1 ? strategy.position_avg_price : na, color = color.green, title = "Average Cost", style = plot.style_circles)
plot(PM_visible or final_option == 1 ? strategy.position_avg_price* profit_f :na, color = color.aqua, title = "Expected Profit", style = plot.style_circles)
plot(SM_visible ? strategy.position_avg_price*0.95 : na, color = color.gray, title = "SAFTY MARGIN - 95%", linewidth = 1, style = plot.style_circles)
plot(SM_visible ? strategy.position_avg_price*0.90 : na, color = color.gray, title = "SAFTY MARGIN - 90%", linewidth = 1, style = plot.style_circles)
plot(SM_visible ? strategy.position_avg_price*0.85 : na, color = color.gray, title = "SAFTY MARGIN - 85%", linewidth = 1, style = plot.style_circles)
plot(SM_visible ? strategy.position_avg_price*0.80 : na, color = color.gray, title = "SAFTY MARGIN - 80%", linewidth = 1, style = plot.style_circles)

plot(ST_visible or final_option == 2 ? down_trend:na, "Down trend", color = plotcolor2,  linewidth=2)
plot(ST_visible or final_option == 2 ? up_trend: na , "Up direction", color = plotcolor3, linewidth=2)
plot(sar_visible or final_option == 2 ? sar:na, title='SAR', color=plotcolor4, linewidth=2)
plot(sma500_visible or final_option == 2 ? SMA500:na,title='SMA500', color=plotcolor5, linewidth=3)