Estratégia de reversão de momentum baseada em médias móveis e índice de força relativa
Visão geral
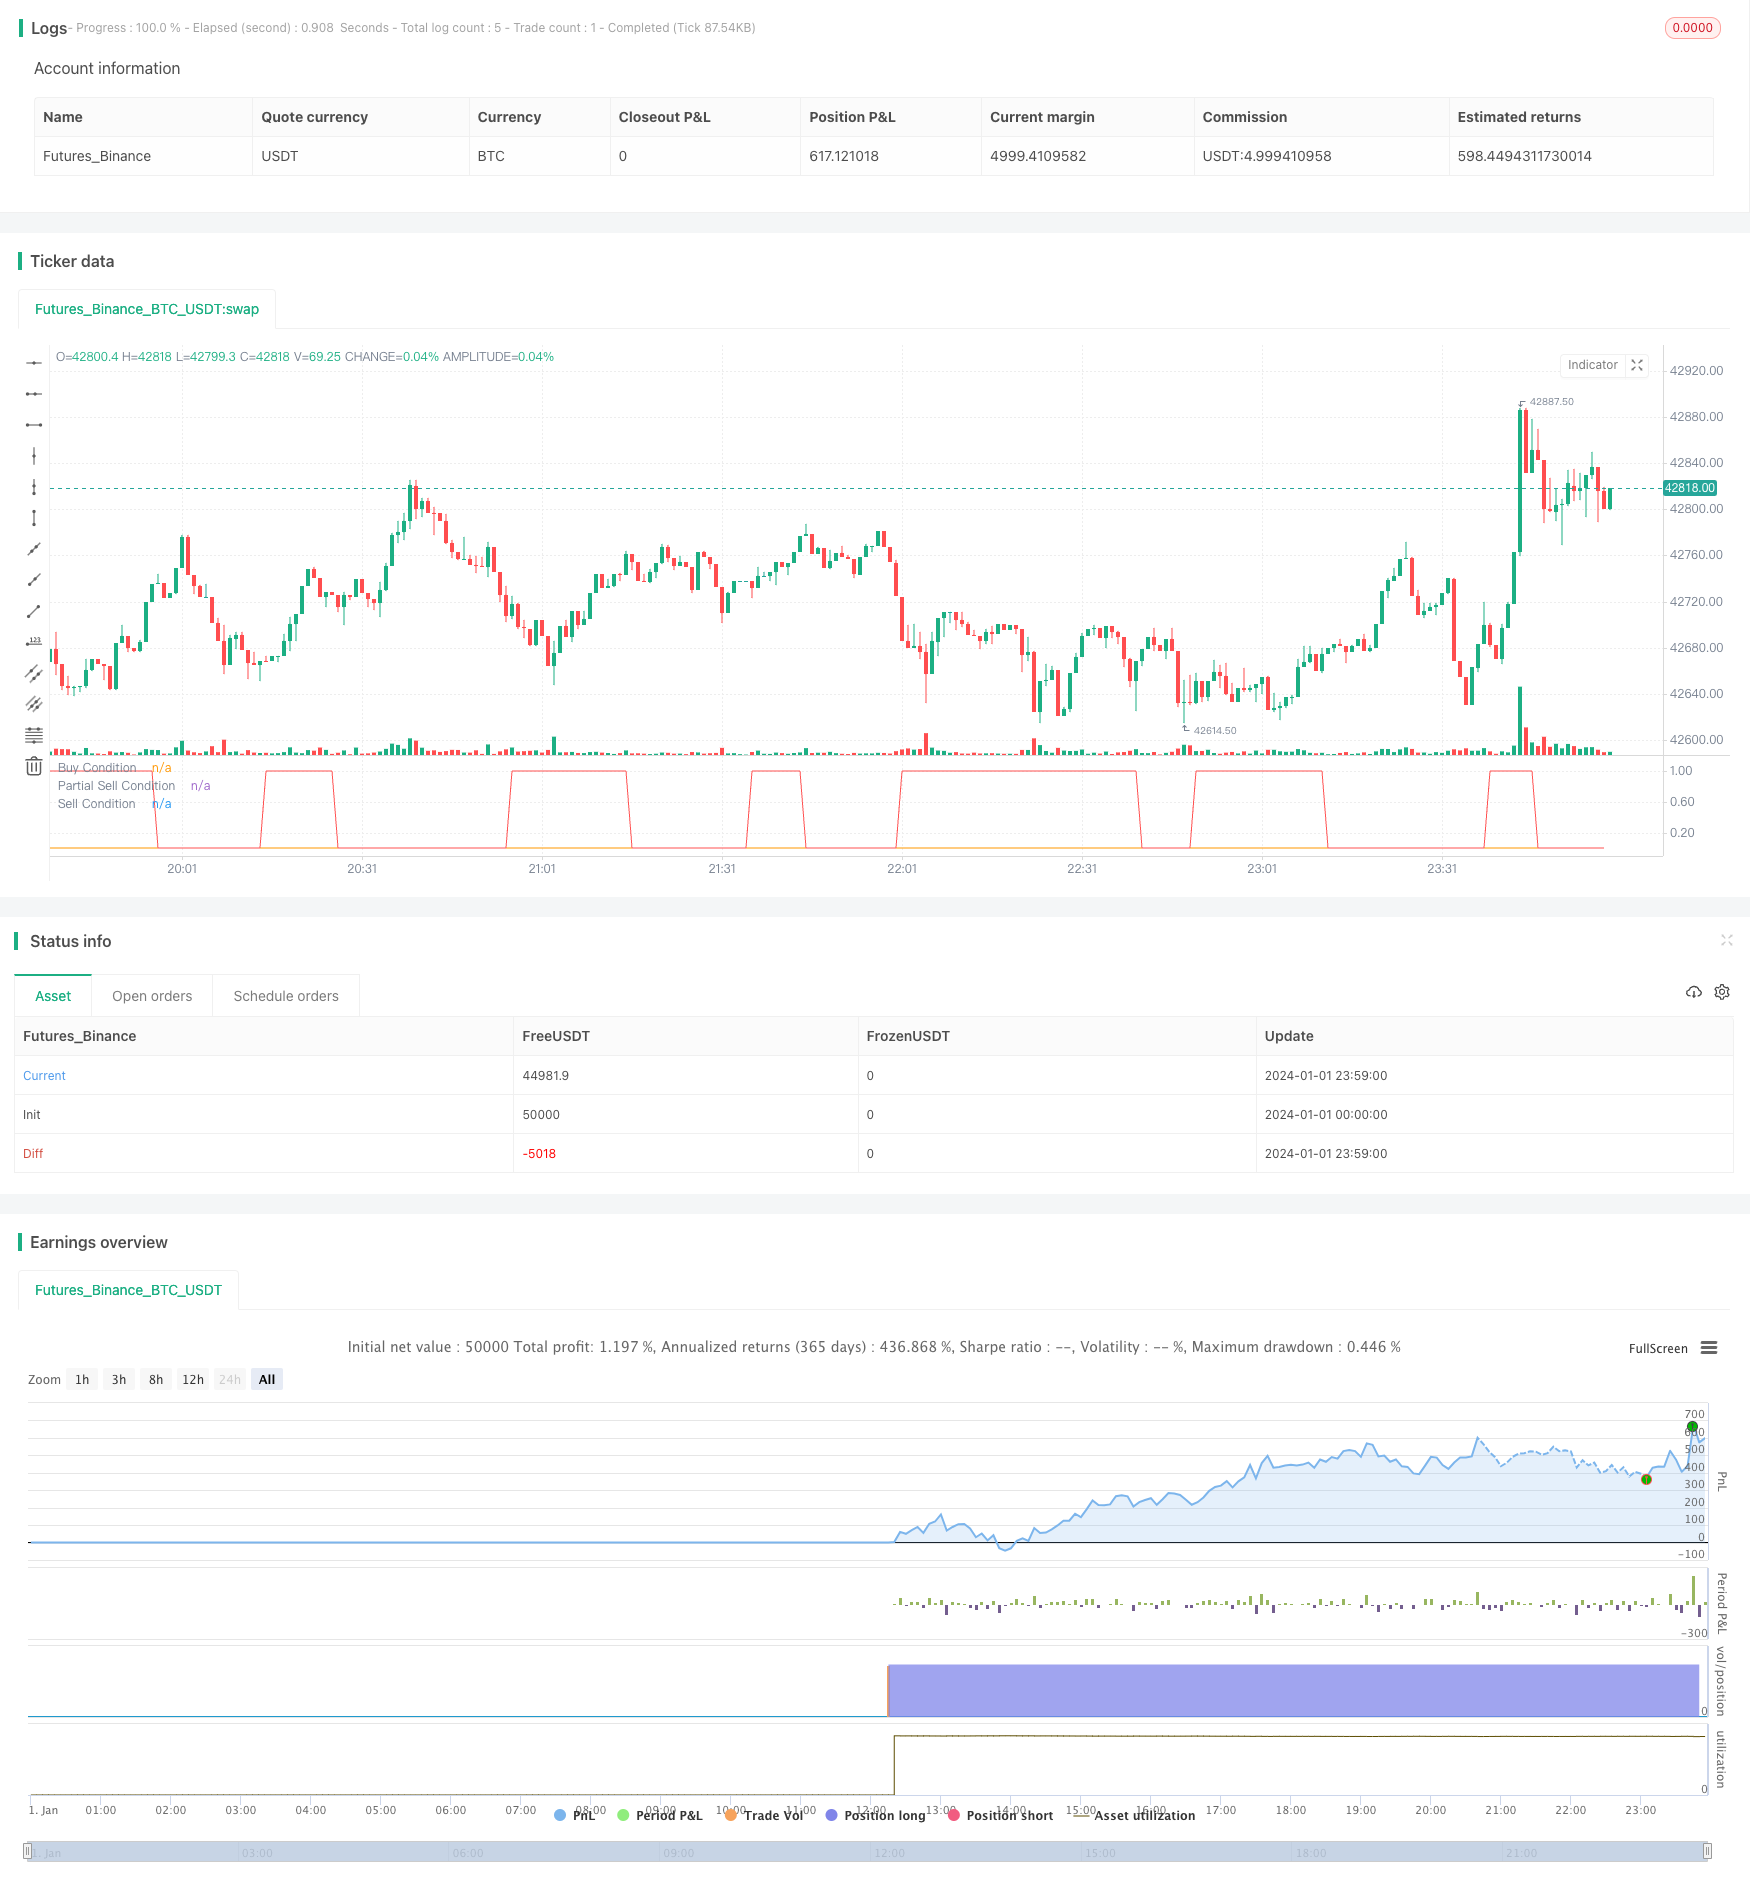
A estratégia é uma estratégia de inversão de dinâmica baseada em médias móveis e indicadores relativamente fortes. Utiliza a interseção de médias móveis rápidas e médias móveis lentas, bem como sinais de supercompra e supervenda para julgar entradas e saídas.
Princípio da estratégia
A estratégia usa a média móvel de 14 dias como uma linha rápida e a média móvel de 28 dias como uma linha lenta. Em combinação com o RSI, o indicador determina se o mercado está sobrecomprando ou sobrevendendo.
Quando a média móvel de 14 dias atravessa a média móvel de 28 dias e o RSI é inferior a 30 ou o RSI é inferior a 13, a inversão de mercado é julgada e mais entrada é feita. Quando a média móvel de 14 dias atravessa a média móvel de 28 dias abaixo da média móvel, a inversão de quantidade móvel é invalida e parte da parada é jogada.
Além disso, a estratégia também configura um mecanismo de parada parcial. Quando o retorno da posição atinge o limite de parada definido (default 8%) será parcialmente parada (default 50% de venda).
Análise de vantagens
Esta estratégia combina os benefícios das médias móveis e evita os prejuízos causados pelo whipsaw.
A média móvel rápida e lenta filtrou parte do ruído.
O RSI é um indicador de sobrecompra e de sobrevenda, evitando a subida.
O mecanismo de bloqueio parcial bloqueia parte dos lucros e reduz os riscos.
Análise de Riscos
A estratégia de cruzamento de médias móveis duplas é propensa a produzir whipsaw e, portanto, traz prejuízos. Esta estratégia pode filtrar parte do whipsaw por meio do indicador RSI para auxiliar no julgamento.
A paralisação parcial pode levar a uma perda maior. Pode-se equilibrar os riscos e os benefícios ajustando o ponto de parada.
Direção de otimização
Pode testar combinações de médias móveis de diferentes parâmetros para encontrar o melhor parâmetro.
Pode testar diferentes limiares de RSI.
Pode-se ajustar o ponto de parada e o percentual de venda de parte da parada para equilibrar o risco com o lucro.
Resumir
A estratégia em geral é uma estratégia de reversão típica. Utiliza um reversão de mercado de mediano a médio cruzado e combina o sinal de filtragem do indicador RSI. Ao mesmo tempo, configura um stop-loss parcial para bloquear parte dos lucros.
/*backtest
start: 2024-01-01 00:00:00
end: 2024-01-02 00:00:00
period: 1m
basePeriod: 1m
exchanges: [{"eid":"Futures_Binance","currency":"BTC_USDT"}]
*/

//@version=3
strategy(title = "14/28 SMA and RSI", shorttitle = "14/28 SMA and RSI", overlay = false, pyramiding = 0, default_qty_type = strategy.percent_of_equity, default_qty_value = 100, currency = currency.USD)
src = close, len = input(14, minval=1, title="Length")
take_Profit=input(8, title="Take Profit")
quantityPercentage=input(50, title="Percent of Quantity to Sell")
closeOverbought=input(true, title="Close Overbought and Take Profit")
up = rma(max(change(src), 0), len)
down = rma(-min(change(src), 0), len)
rsi = down == 0 ? 100 : up == 0 ? 0 : 100 - (100 / (1 + up / down))
longCondition = 0
sellCondition = 0
takeProfit = 0
quantityRemainder = 100
smaSignal = input(14, title="SMA Signal Period")
smaLong = input(28, title="SMA Longer Period")
if ((sma(close, smaSignal) >= sma(close, smaLong) and rsi<= 30) or (rsi<=13)) and strategy.position_size==0
    longCondition:=1

if longCondition==1
    strategy.entry("Buy", strategy.long)

profit = ((close-strategy.position_avg_price)/strategy.position_avg_price) * 100

if sma(close, smaSignal) <= sma(close, smaLong) and strategy.position_size>1
    sellCondition := 1

if strategy.position_size>=1
    if closeOverbought == true
        if profit>=take_Profit and takeProfit == 0
            strategy.exit("Take Profit", profit=take_Profit, qty_percent=quantityPercentage)
            takeProfit:=1
            quantityRemainder:=100-quantityPercentage
    if sellCondition == 1 and quantityRemainder<100
        strategy.close("Buy")

    if closeOverbought == false and rsi>70
        strategy.close("Take Profit")

plot(longCondition, "Buy Condition", green)
plot(takeProfit, "Partial Sell Condition", orange)
plot(sellCondition, "Sell Condition", red)