Estratégia de cruzamento de média móvel ponderada de momentum com média móvel dupla
Data de criação:
2024-01-12 12:04:55
última modificação:
2024-01-12 12:04:55
cópia:
1
Cliques:
771
1
focar em
1750
Seguidores
Visão geral
A estratégia gera um sinal de compra e venda quando eles se cruzam. A linha de curto período é usada para determinar a tendência do mercado e os sinais de reversão de curto prazo, enquanto a linha de longo período é usada para determinar a direção da tendência principal.
Princípios
- Calcule o MAEMA da linha rápida (80 ciclos) e da linha lenta (-144 ciclos).
- As linhas rápidas refletem tendências de curto prazo e pontos de reversão. As linhas lentas refletem a direção das principais tendências.
- Quando a linha rápida passa pela linha lenta, gera um sinal de compra. Quando a linha rápida passa pela linha lenta, gera um sinal de venda.
- A estratégia traça três pontos de previsão ao mesmo tempo, que representam os valores possíveis para o próximo ciclo, para determinar a tendência de cruzamento no futuro.
- A estratégia aproveita a dinâmica e a capacidade de previsão do próprio indicador MAEMA.
Análise de vantagens
- O MAEMA, por si só, integra um factor de dinâmica que permite capturar mudanças de tendência mais rapidamente.
- Estratégias de dupla linha de equilíbrio para determinar a direção da tendência em diferentes períodos de tempo.
- A combinação de linhas rápidas e lentas e os próprios pontos de previsão da MAEMA tornam os sinais de compra e venda mais confiáveis.
- O mapa automático é completo e reflete intuitivamente as flutuações do mercado.
Análise de Riscos
- Quando ocorrem oscilações anormais no mercado, a sensibilidade do indicador MAEMA pode ser excessiva, produzindo sinais errados. Pode-se relaxar adequadamente o ponto de parada.
- O sistema de linha média é propenso a produzir falsos sinais para o mercado horizontal. Outros filtros podem ser adicionados.
- A configuração periódica de linhas rápidas e lentas requer a determinação de parâmetros ótimos de acordo com as diferentes variedades.
Direção de otimização
- Otimizar os parâmetros de ciclo de MAEMA para linhas rápidas e lentas para encontrar a melhor combinação de parâmetros.
- Aumentar as condições de filtragem para evitar a abertura de posições em situações de turbulência. Por exemplo, a introdução de DMI, MACD e outras tendências de julgamento.
- Adaptar o coeficiente ATR de acordo com os resultados dos testes de retorno, mover o ponto de parada para reduzir os falsos positivos e controlar o risco.
Resumir
A estratégia utiliza a dinâmica ponderada média móvel binária para julgar a mudança de tendência do mercado, os princípios básicos são claros e simples. Em combinação com o próprio dinamismo e a função de previsão do MAEMA, é melhor identificar o efeito do sinal de reversão. É necessário prestar atenção à otimização de parâmetros e ao reforço das condições de filtragem, aumentando a estabilidade.
Código-fonte da estratégia
/*backtest
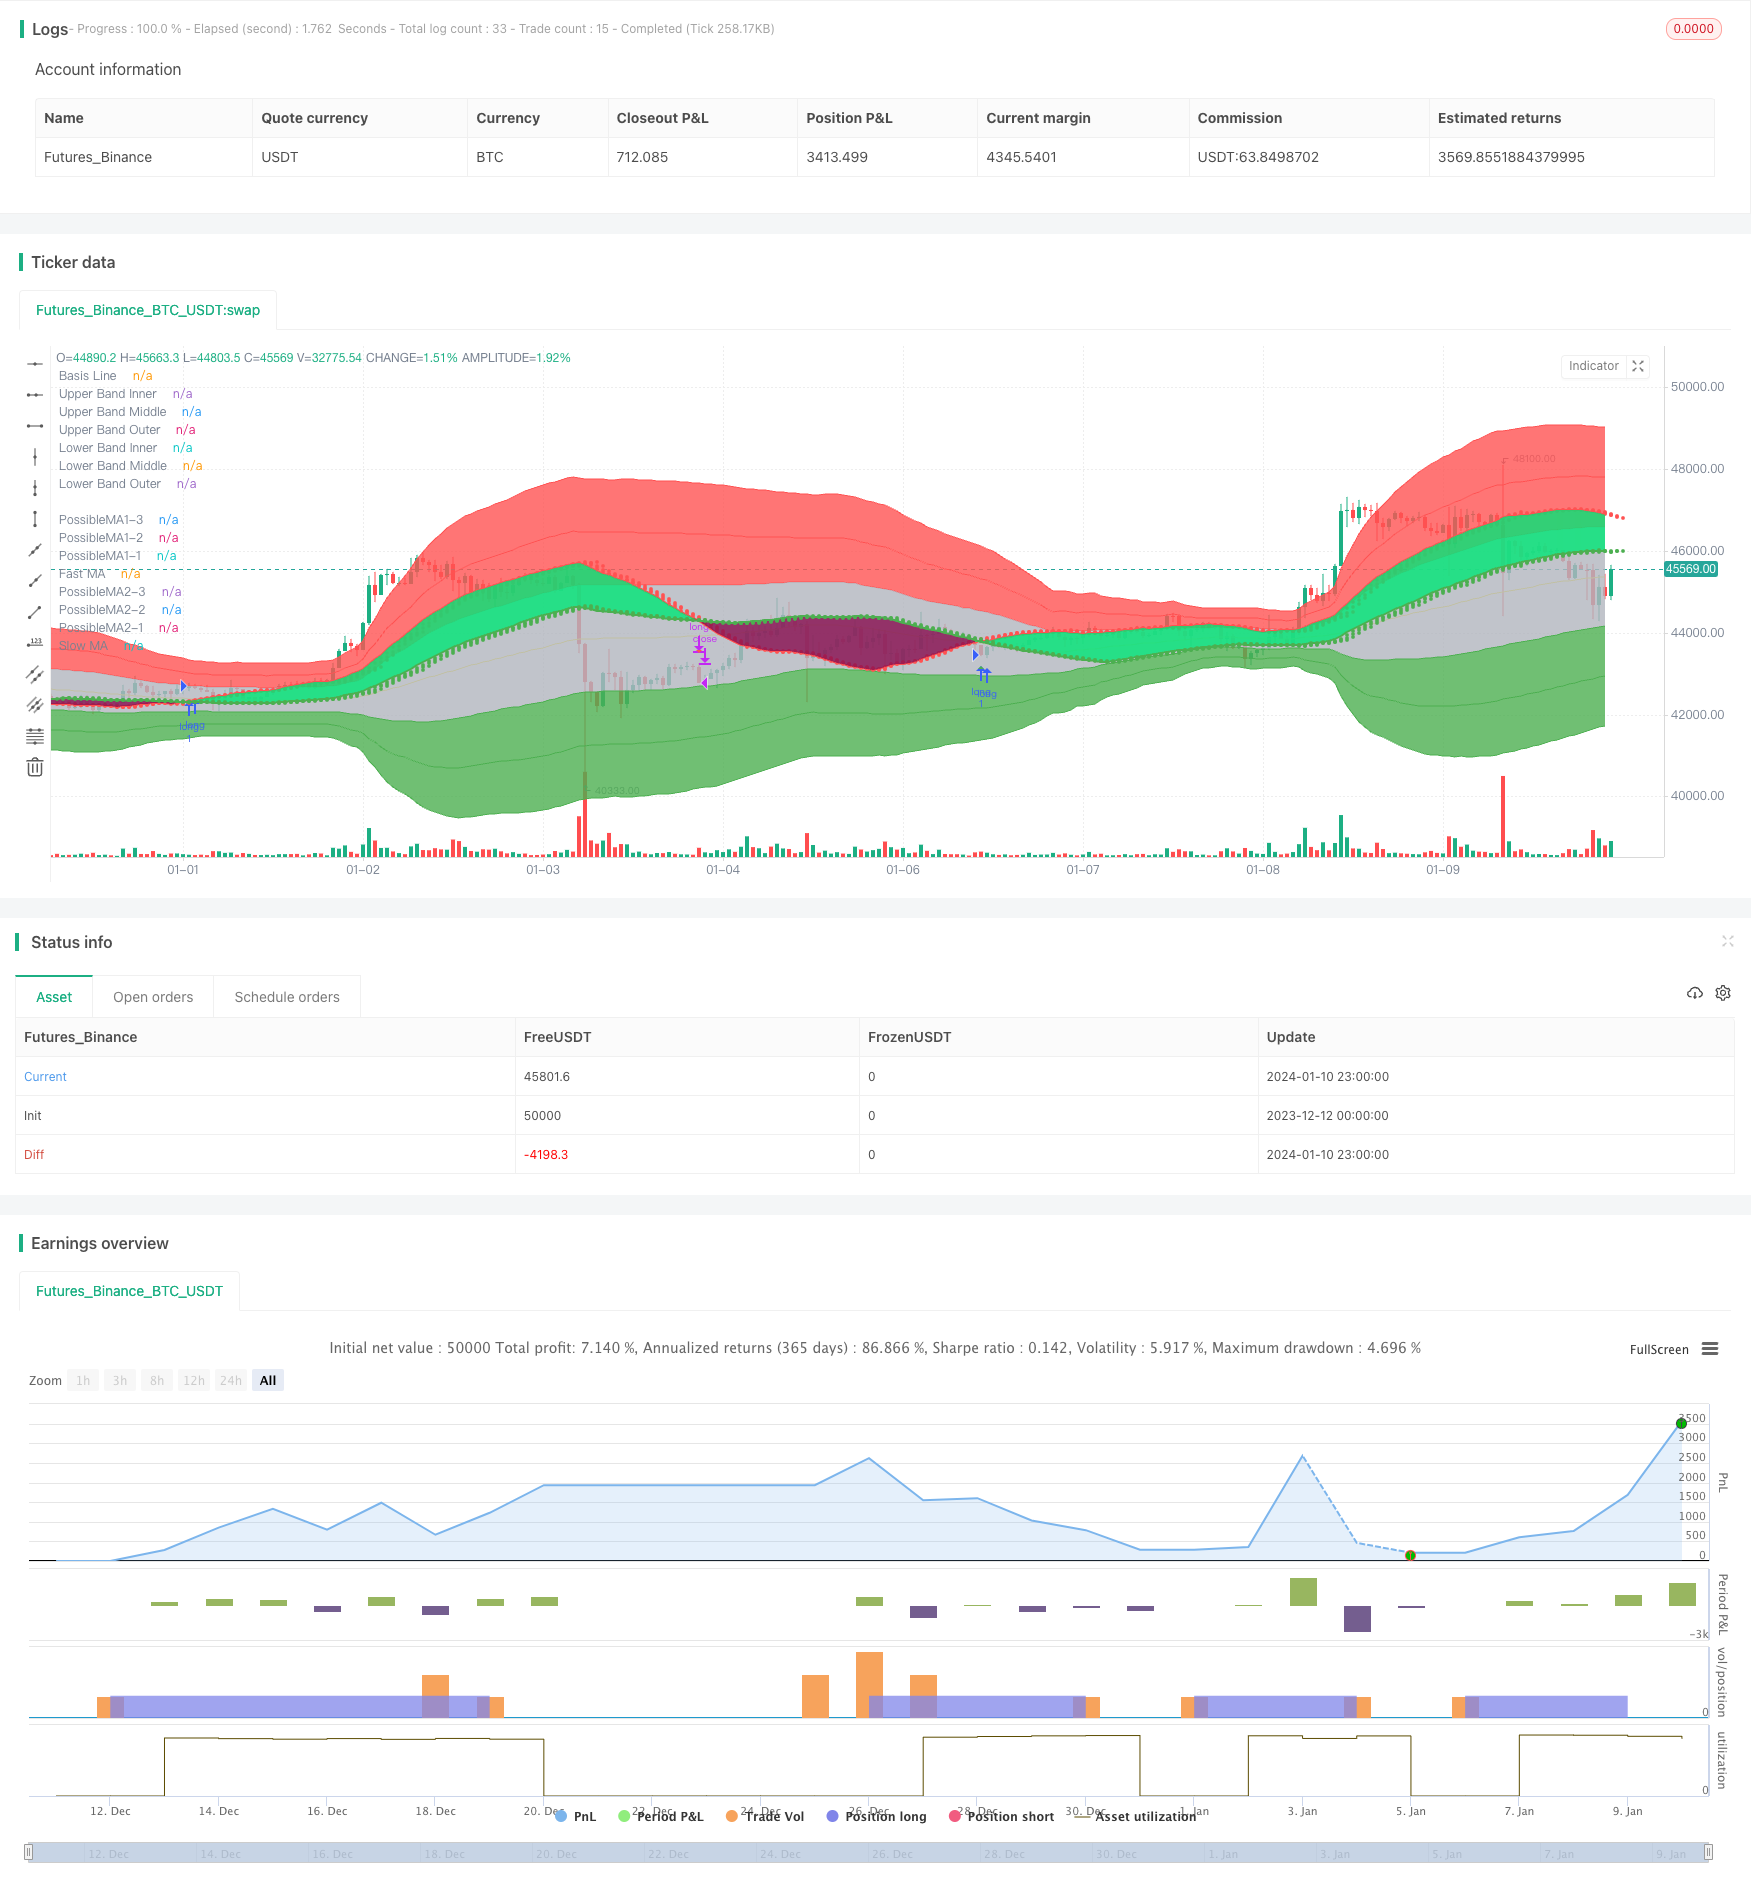
start: 2023-12-12 00:00:00
end: 2024-01-11 00:00:00
period: 1h
basePeriod: 15m
exchanges: [{"eid":"Futures_Binance","currency":"BTC_USDT"}]
*/
// © informanerd
//@version=4
strategy("MultiType Shifting Predictive MAs Crossover", shorttitle = "MTSPMAC + MBHB Strategy", overlay = true)
//inputs
predict = input(true, "Show MA Prediction Tails")
trendFill = input(true, "Fill Between MAs Based on Trend")
signal = input(true, "Show Cross Direction Signals")
showMA1 = input(true, "[ Show Fast Moving Average ]══════════")
type1 = input("MAEMA (Momentum Adjusted Exponential)", "Fast MA Type", options = ["MAEMA (Momentum Adjusted Exponential)", "DEMA (Double Exponential)", "EMA (Exponential)", "HMA (Hull)", "LSMA (Least Squares)", "RMA (Adjusted Exponential)", "SMA (Simple)", "SWMA (Symmetrically Weighted)", "TEMA (Triple Exponential)", "TMA (Triangular)", "VMA / VIDYA (Variable Index Dynamic Average)", "VWMA (Volume Weighted)", "WMA (Weighted)"])
src1 = input(high, "Fast MA Source")
len1 = input(80, "Fast MA Length", minval = 2)
shift1 = input(0, "Fast MA Shift")
maThickness1 = input(2, "Fast MA Thickness", minval = 1)
trendColor1 = input(false, "Color Fast MA Based on Detected Trend")
showBand1 = input(false, "Show Fast MA Range Band")
atrPer1 = input(20, "Fast Band ATR Lookback Period")
atrMult1 = input(3, "Fast Band ATR Multiplier")
showMA2 = input(true, "[ Show Slow Moving Average ]══════════")
type2 = input("MAEMA (Momentum Adjusted Exponential)", "Slow MA Type", options = ["MAEMA (Momentum Adjusted Exponential)", "DEMA (Double Exponential)", "EMA (Exponential)", "HMA (Hull)", "LSMA (Least Squares)", "RMA (Adjusted Exponential)", "SMA (Simple)", "SWMA (Symmetrically Weighted)", "TEMA (Triple Exponential)", "TMA (Triangular)", "VMA / VIDYA (Variable Index Dynamic Average)", "VWMA (Volume Weighted)", "WMA (Weighted)"])
src2 = input(close, "Slow MA Source")
len2 = input(144, "Slow MA Length", minval = 2)
shift2 = input(0, "Slow MA Shift")
maThickness2 = input(2, "Slow MA Thickness", minval = 1)
trendColor2 = input(false, "Color Slow MA Based on Detected Trend")
showBand2 = input(false, "Show Slow MA Range Band")
atrPer2 = input(20, "Slow Band ATR Lookback Period")
atrMult2 = input(3, "Slow Band ATR Multiplier")
//ma calculations
ma(type, src, len) =>
if type == "MAEMA (Momentum Adjusted Exponential)"
goldenRatio = (1 + sqrt(5)) / 2
momentumLen = round(len / goldenRatio), momentum = change(src, momentumLen), probabilityLen = len / goldenRatio / goldenRatio
ema(src + (momentum + change(momentum, momentumLen) * 0.5) * sum(change(src) > 0 ? 1 : 0, round(probabilityLen)) / probabilityLen, len)
else if type == "DEMA (Double Exponential)"
2 * ema(src, len) - ema(ema(src, len), len)
else if type == "EMA (Exponential)"
ema(src, len)
else if type == "HMA (Hull)"
wma(2 * wma(src, len / 2) - wma(src, len), round(sqrt(len)))
else if type == "LSMA (Least Squares)"
3 * wma(src, len) - 2 * sma(src, len)
else if type == "RMA (Adjusted Exponential)"
rma(src, len)
else if type == "SMA (Simple)"
sma(src, len)
else if type == "SWMA (Symmetrically Weighted)"
swma(src)
else if type == "TEMA (Triple Exponential)"
3 * ema(src, len) - 3 * ema(ema(src, len), len) + ema(ema(ema(src, len), len), len)
else if type == "TMA (Triangular)"
swma(wma(src, len))
else if type == "VMA / VIDYA (Variable Index Dynamic Average)"
smoothing = 2 / len, volIndex = abs(cmo(src, len) / 100)
vma = 0., vma := (smoothing * volIndex * src) + (1 - smoothing * volIndex) * nz(vma[1])
else if type == "VWMA (Volume Weighted)"
vwma(src, len)
else if type == "WMA (Weighted)"
wma(src, len)
ma1 = ma(type1, src1, len1)
ma2 = ma(type2, src2, len2)
//ma predictions
pma11 = len1 > 2 ? (ma(type1, src1, len1 - 1) * (len1 - 1) + src1 * 1) / len1 : na
pma12 = len1 > 3 ? (ma(type1, src1, len1 - 2) * (len1 - 2) + src1 * 2) / len1 : na
pma13 = len1 > 4 ? (ma(type1, src1, len1 - 3) * (len1 - 3) + src1 * 3) / len1 : na
pma21 = len2 > 2 ? (ma(type2, src2, len2 - 1) * (len2 - 1) + src2 * 1) / len2 : na
pma22 = len2 > 3 ? (ma(type2, src2, len2 - 2) * (len2 - 2) + src2 * 2) / len2 : na
pma23 = len2 > 4 ? (ma(type2, src2, len2 - 3) * (len2 - 3) + src2 * 3) / len2 : na
//ma range bands
r1 = atr(atrPer1) * atrMult1
hBand1 = ma1 + r1
lBand1 = ma1 - r1
r2 = atr(atrPer2) * atrMult2
hBand2 = ma2 + r2
lBand2 = ma2 - r2
//drawings
ma1Plot = plot(showMA1 ? ma1 : na, "Fast MA", trendColor1 and ma1 > src1 ? color.maroon : trendColor1 and ma1 < src1 ? color.lime : trendColor1 ? color.gray : color.red, maThickness1, offset = shift1)
ma2Plot = plot(showMA2 ? ma2 : na, "Slow MA", trendColor2 and ma2 > src2 ? color.maroon : trendColor2 and ma2 < src2 ? color.lime : trendColor2 ? color.gray : color.green, maThickness2, offset = shift2)
fill(ma1Plot, ma2Plot, trendFill and ma1 > ma2 ? color.lime : trendFill and ma1 < ma2 ? color.maroon : na, 90)
plot(showMA1 and predict ? pma11 : na, "PossibleMA1-1", trendColor1 and ma1 > src1 ? color.maroon : trendColor1 and ma1 < src1 ? color.lime : trendColor1 ? color.gray : color.red, style = plot.style_circles, offset = shift1 + 1, show_last = 1)
plot(showMA1 and predict ? pma12 : na, "PossibleMA1-2", trendColor1 and ma1 > src1 ? color.maroon : trendColor1 and ma1 < src1 ? color.lime : trendColor1 ? color.gray : color.red, style = plot.style_circles, offset = shift1 + 2, show_last = 1)
plot(showMA1 and predict ? pma13 : na, "PossibleMA1-3", trendColor1 and ma1 > src1 ? color.maroon : trendColor1 and ma1 < src1 ? color.lime : trendColor1 ? color.gray : color.red, style = plot.style_circles, offset = shift1 + 3, show_last = 1)
plot(showMA2 and predict ? pma21 : na, "PossibleMA2-1", trendColor2 and ma2 > src2 ? color.maroon : trendColor2 and ma2 < src2 ? color.lime : trendColor2 ? color.gray : color.green, style = plot.style_circles, offset = shift2 + 1, show_last = 1)
plot(showMA2 and predict ? pma22 : na, "PossibleMA2-2", trendColor2 and ma2 > src2 ? color.maroon : trendColor2 and ma2 < src2 ? color.lime : trendColor2 ? color.gray : color.green, style = plot.style_circles, offset = shift2 + 2, show_last = 1)
plot(showMA2 and predict ? pma23 : na, "PossibleMA2-3", trendColor2 and ma2 > src2 ? color.maroon : trendColor2 and ma2 < src2 ? color.lime : trendColor2 ? color.gray : color.green, style = plot.style_circles, offset = shift2 + 3, show_last = 1)
plot(showBand1 ? hBand1 : na, "Fast Higher Band", trendColor1 and ma1 > src1 ? color.maroon : trendColor1 and ma1 < src1 ? color.lime : trendColor1 ? color.gray : color.red, offset = shift1)
plot(showBand1 ? lBand1 : na, "Fast Lower Band", trendColor1 and ma1 > src1 ? color.maroon : trendColor1 and ma1 < src1 ? color.lime : trendColor1 ? color.gray : color.red, offset = shift1)
plot(showBand2 ? hBand2 : na, "Slow Higher Band", trendColor2 and ma2 > src2 ? color.maroon : trendColor2 and ma2 < src2 ? color.lime : trendColor2 ? color.gray : color.green, offset = shift2)
plot(showBand2 ? lBand2 : na, "Slow Lower Band", trendColor2 and ma2 > src2 ? color.maroon : trendColor2 and ma2 < src2 ? color.lime : trendColor2 ? color.gray : color.green, offset = shift2)
//crosses & alerts
up = crossover(ma1, ma2)
down = crossover(ma2, ma1)
plotshape(signal ? up : na, "Buy", shape.triangleup, location.belowbar, color.green, offset = shift1, size = size.small)
plotshape(signal ? down : na, "Sell", shape.triangledown, location.abovebar, color.red, offset = shift1, size = size.small)
alertcondition(up, "Buy", "Buy")
alertcondition(down, "Sell", "Sell")
// @version=1
// Title: "Multi Bollinger Heat Bands - EMA/Breakout options".
// Author: JayRogers
//
// * Description *
// Short: It's your Basic Bollinger Bands, but 3 of them, and some pointy things.
//
// Long: Three stacked sma based Bollinger Bands designed just to give you a quick visual on the "heat" of movement.
// Set inner band as you would expect, then set your preferred additional multiplier increments for the outer 2 bands.
// Option to use EMA as alternative basis, rather than SMA.
// Breakout indication shapes, which have their own multiplier seperate from the BB's; but still tied to same length/period.
// strategy(shorttitle="[JR]MBHB_EBO", title="[JR] Multi Bollinger Heat Bands - EMA/Breakout options", overlay=true)
// Bollinger Bands Inputs
bb_use_ema = input(false, title="Use EMA Basis?")
bb_length = input(80, minval=1, title="Bollinger Length")
bb_source = input(close, title="Bollinger Source")
bb_mult = input(1.0, title="Base Multiplier", minval=0.001, maxval=50)
bb_mult_inc = input(1, title="Multiplier Increment", minval=0.001, maxval=2)
// Breakout Indicator Inputs
break_mult = input(3, title="Breakout Multiplier", minval=0.001, maxval=50)
breakhigh_source = input(high, title="High Break Source")
breaklow_source = input(low, title="Low Break Source")
bb_basis = bb_use_ema ? ema(bb_source, bb_length) : sma(bb_source, bb_length)
// Deviation
// * I'm sure there's a way I could write some of this cleaner, but meh.
dev = stdev(bb_source, bb_length)
bb_dev_inner = bb_mult * dev
bb_dev_mid = (bb_mult + bb_mult_inc) * dev
bb_dev_outer = (bb_mult + (bb_mult_inc * 2)) * dev
break_dev = break_mult * dev
// Upper bands
inner_high = bb_basis + bb_dev_inner
mid_high = bb_basis + bb_dev_mid
outer_high = bb_basis + bb_dev_outer
// Lower Bands
inner_low = bb_basis - bb_dev_inner
mid_low = bb_basis - bb_dev_mid
outer_low = bb_basis - bb_dev_outer
// Breakout Deviation
break_high = bb_basis + break_dev
break_low = bb_basis - break_dev
// plot basis
plot(bb_basis, title="Basis Line", color=color.yellow, transp=50)
// plot and fill upper bands
ubi = plot(inner_high, title="Upper Band Inner", color=color.red, transp=90)
ubm = plot(mid_high, title="Upper Band Middle", color=color.red, transp=85)
ubo = plot(outer_high, title="Upper Band Outer", color=color.red, transp=80)
fill(ubi, ubm, title="Upper Bands Inner Fill", color=color.red, transp=90)
fill(ubm, ubo, title="Upper Bands Outer Fill",color=color.red, transp=80)
// plot and fill lower bands
lbi = plot(inner_low, title="Lower Band Inner", color=color.green, transp=90)
lbm = plot(mid_low, title="Lower Band Middle", color=color.green, transp=85)
lbo = plot(outer_low, title="Lower Band Outer", color=color.green, transp=80)
fill(lbi, lbm, title="Lower Bands Inner Fill", color=color.green, transp=90)
fill(lbm, lbo, title="Lower Bands Outer Fill", color=color.green, transp=80)
// center channel fill
fill(ubi, lbi, title="Center Channel Fill", color=color.silver, transp=100)
// plot breakouts
plotshape(breakhigh_source >= break_high, title="High Breakout", style=shape.triangledown, location=location.abovebar, size=size.tiny, color=color.white, transp=0)
plotshape(breaklow_source <= break_low, title="Low Breakout", style=shape.triangleup, location=location.belowbar, size=size.tiny, color=color.white, transp=0)
High_Break = breakhigh_source >= break_high
Low_Break = breaklow_source <= break_low
// Conditions
Stop_Momentum = low < ma1
//Strategy Tester
strategy.entry("long", strategy.long, when=(up and (hlc3 < inner_high)))
strategy.close("long", when=down)
strategy.entry("longwickdown", strategy.long, when=Low_Break)
strategy.close("longwickdown", when=(high > ma1))
//true signals test
//var winCount = 0, var loseCount = 0, testBarIndex = 1
//if (up[testBarIndex] and close > close[testBarIndex]) or (down[testBarIndex] and close < close[testBarIndex])
// label.new(bar_index, 0, "W", yloc = yloc.abovebar, color = color.green)
// winCount := winCount + 1
//else if (up[testBarIndex] and close < close[testBarIndex]) or (down[testBarIndex] and close > close[testBarIndex])
// label.new(bar_index, 0, "L", yloc = yloc.abovebar, color = color.red)
// loseCount := loseCount + 1
//winRate = label.new(time + (time - time[1]) * 2, ohlc4, tostring(round(winCount / (winCount + loseCount) * 100)) + "%", xloc = xloc.bar_time, color = color.orange, style = label.style_label_left)
//if not na(winRate[1])
// label.delete(winRate[1])