Estratégia de Tendência de Momentum ADX

Visão Geral
Esta estratégia avalia a tendência do mercado com base no indicador ADX, combina o indicador DMI para determinar a direção de alta ou baixa, utiliza a inclinação do ADX para medir a força da tendência, define um valor crítico do ADX para filtrar mercados sem tendência e complementa com uma média móvel para filtrar os sinais de negociação.
Princípio da Estratégia
- Calcular os indicadores ADX, DI+ e DI-.
- Inclinação do ADX > 0 indica que a tendência está se fortalecendo; o valor crítico é definido em 23 para filtrar mercados sem tendência.
- DI+ acima de DI- indica que a força compradora é maior que a força vendedora, gerando um sinal de alta.
- Quando a filtragem pela média móvel está ativada, apenas quando o preço de fechamento está acima da média móvel é gerado um sinal de compra.
- Quando a inclinação do ADX < 0, a posição é fechada, indicando que a tendência está diminuindo.
Análise de Vantagens
- A filtragem auxiliar pela média móvel pode reduzir negociações ruidosas em mercados sem tendência.
- A inclinação do ADX mede a força, permitindo avaliar com precisão o desenvolvimento da tendência.
- O DI determina a direção em conjunto com o ADX medindo a força, formando um sistema de tomada de decisão de negociação de tendência relativamente completo.
- O rebaixamento e a relação risco-retorno podem ser superiores aos de estratégias simples de média móvel.
Análise de Riscos
- Parâmetros diferentes para o indicador ADX podem levar a resultados bastante diferentes.
- Antes de o DMI confirmar completamente a direção de alta ou baixa, pode gerar sinais falsos.
- Existe um certo atraso, reduzindo a eficiência da estratégia.
Direções de Otimização
- Otimizar a combinação de parâmetros do ADX para encontrar os melhores parâmetros.
- Adicionar uma estratégia de stop loss para evitar que uma única perda se amplie.
- Tentar combinar outros indicadores para filtrar sinais, como RSI e Bandas de Bollinger.
Resumo
Esta estratégia aproveita ao máximo a capacidade do ADX de avaliar a tendência e sua força, combinada com o indicador DMI para determinar a direção, formando um sistema completo de acompanhamento de tendência. Ao mesmo tempo, a média móvel auxiliar pode filtrar efetivamente o ruído em mercados sem tendência. A otimização de parâmetros e a combinação de indicadores podem melhorar ainda mais a estabilidade e a eficiência da estratégia. No geral, esta estratégia, que combina as características de julgamento de tendência e direção, tem potencial para obter bons retornos.
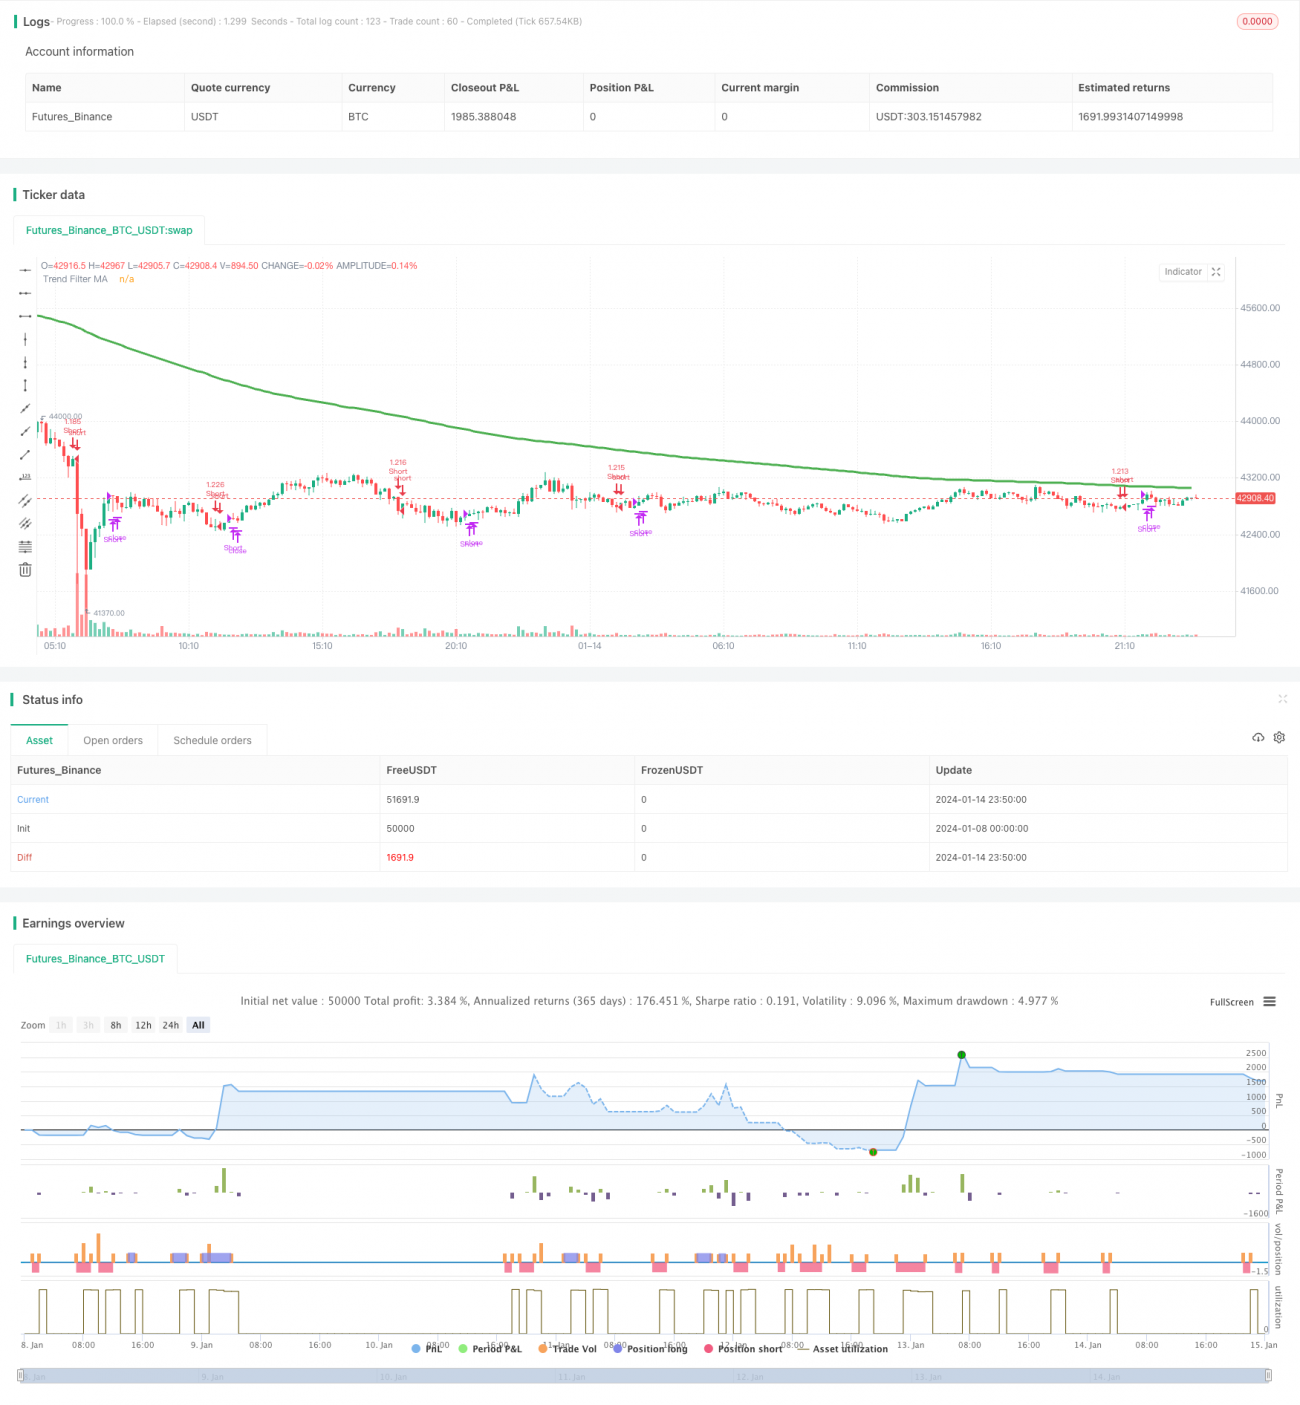
/*backtest
start: 2024-01-08 00:00:00
end: 2024-01-15 00:00:00
period: 10m
basePeriod: 1m
exchanges: [{"eid":"Futures_Binance","currency":"BTC_USDT"}]
*/

//@version=4
// This source code is subject to the terms of the Mozilla Public License 2.0 at https://mozilla.org/MPL/2.0/
// © millerrh with inspiration from @9e52f12edd034d28bdd5544e7ff92e
//The intent behind this study is to look at ADX when it has an increasing slope and is above a user-defined key level (23 default). - 1