Estratégia DCA progressiva baseada em Bandas de Bollinger e indicadores RSI
Visão geral
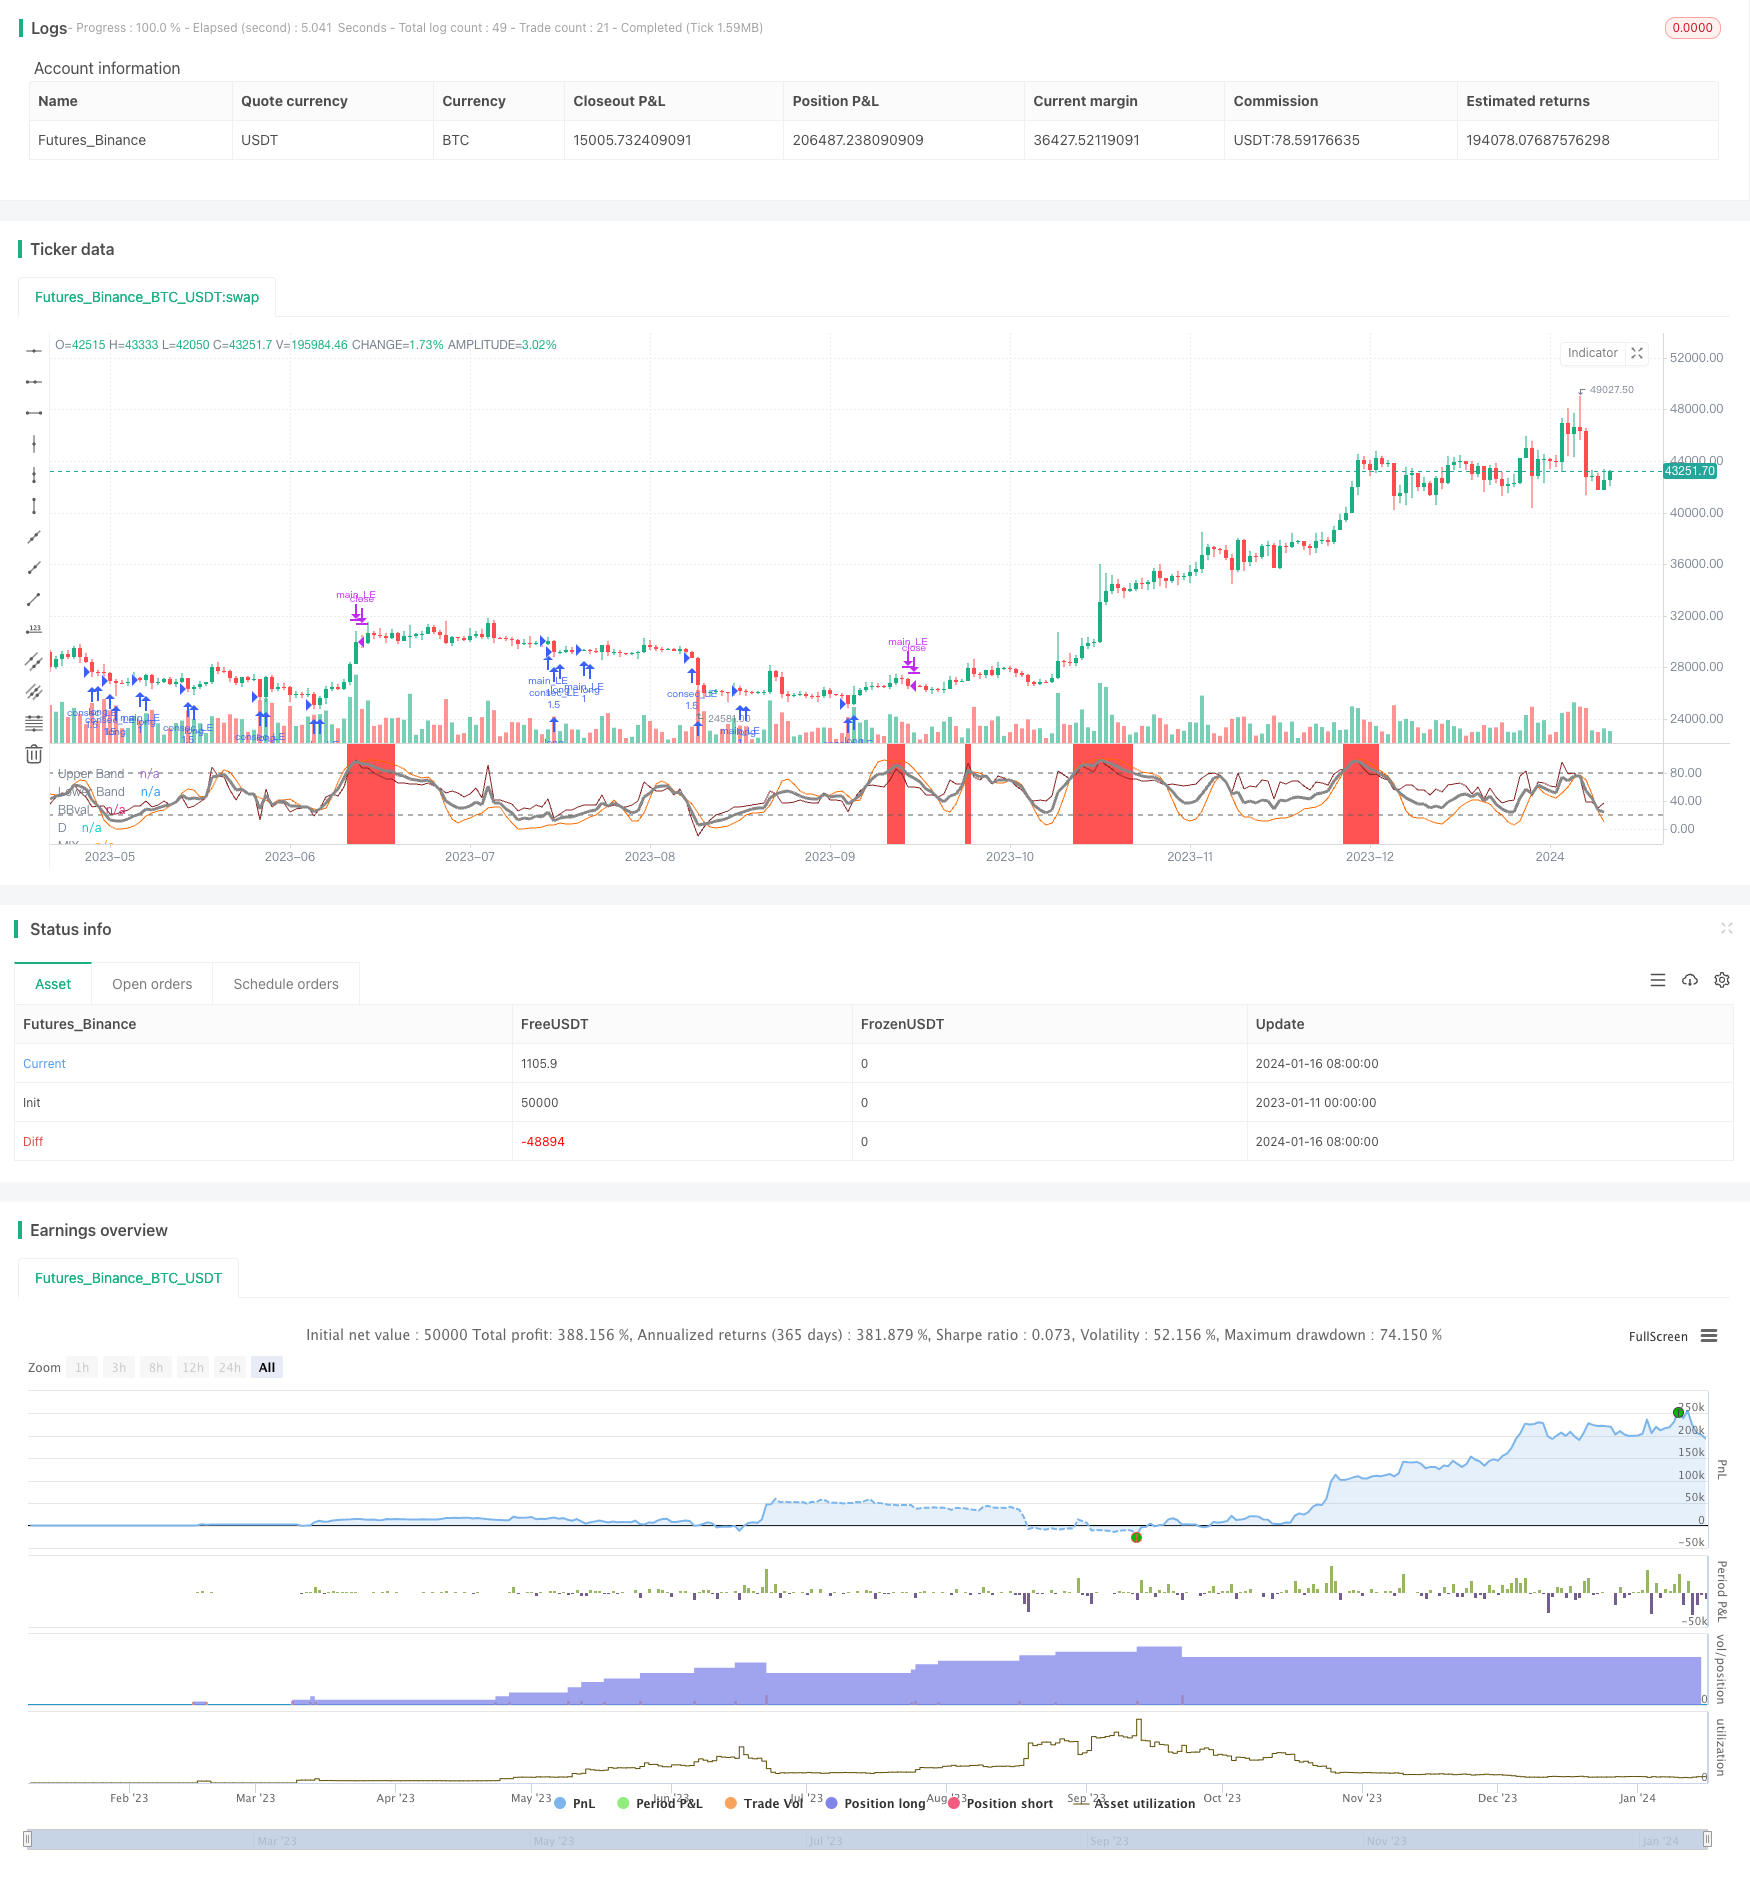
A estratégia é conhecida como a estratégia de DCA de duplo indicador progressivo. Ela baseia-se em dois indicadores para construir sinais de negociação, o canal de Brolin e o índice de força relativa (RSI), além de usar o método de aumento progressivo de risco para gerenciar o risco.
Princípio da estratégia
A estratégia combina o canal de Brin e o RSI. O canal de Brin é capaz de determinar claramente a tendência do mercado, com o bull market acima e o bear market abaixo. O RSI determina o fenômeno de sobrevenda e sobrevenda. A estratégia constrói um indicador MIX, que pondera a diferença de preço do canal de Brin e o valor K do RSI.
DCA gradual, primeiro abrir a primeira ordem quando o indicador MIX ultrapassar 20 anos. Depois, cada vez que o preço cair uma certa quantidade, adicione uma posição por um determinado valor. Até atingir o máximo de posse ou o stop loss.
Vantagens estratégicas
A combinação de dois indicadores aumenta a precisão do sinal.
A estratégia de DCA progressivo pode reduzir os custos da posição em queda, reduzir o risco de perda e aumentar a margem de lucro.
A definição de condições de stop loss e de stop-loss permite que os riscos de controle de stop loss ocorram em tempo hábil e que a parte dos lucros seja garantida.
Adicione um parâmetro de data de abertura de posição para testar e otimizar para um período de tempo específico.
Riscos e soluções
Os canais de Boolean e o RSI podem falhar. É possível testar diferentes combinações de parâmetros para encontrar o melhor ponto.
O DCA progressivo pode aumentar as perdas com o aumento contínuo de posições em situações de grande queda. Pode-se definir o número máximo de acréscimos e aprimorar adequadamente o controle de risco da linha de parada.
Os riscos sistemáticos podem ser avaliados com base em indicadores de grande escala, evitando períodos anormais.
Direção de otimização da estratégia
Testar e otimizar os parâmetros do indicador MIX para obter sinais de negociação mais precisos.
Optimizar os parâmetros de stop loss para maximizar a relação de perdas e perdas.
Teste a amplitude e a frequência de diferentes posições adicionais para encontrar a melhor combinação.
Pode-se considerar a inclusão de um módulo de controle de volume de transação, para abrir ou fechar a estratégia em determinadas condições de volume de transação.
Resumir
A estratégia de DCA de duplo indicador progressivo combina vários indicadores e métodos técnicos de quantificação. Ela constrói indicadores claros de julgamento de tendências e usa o aumento progressivo de risco para reduzir os custos. Ao mesmo tempo, os rigorosos métodos de parada de perda e controle de risco tornam-na segura.
/*backtest
start: 2023-01-11 00:00:00
end: 2024-01-17 00:00:00
period: 1d
basePeriod: 1h
exchanges: [{"eid":"Futures_Binance","currency":"BTC_USDT"}]
*/

// © lagobrian23
//@version=4
strategy(title = 'Bollinger Bands and RSI mix with DCA', shorttitle = 'BB/RSI with DCA',pyramiding = 20, calc_on_every_tick = true, overlay = false )
source=close
smoothK = input(3, "K", minval=1)
smoothD = input(3, "D", minval=1)
lengthRSI = input(14, "RSI Length", minval=1)
lengthStoch = input(14, "Stochastic Length", minval=1)
src = input(close, title="RSI Source")
rsi1 = rsi(src, lengthRSI)
k = sma(stoch(rsi1, rsi1, rsi1, lengthStoch), smoothK)
d = sma(k, smoothD)

// Bollinger Band

length = input(20,title = 'BB lookback length', minval=1)
mult = input(2.0, minval=0.001, maxval=50, title="StdDev")
basis = sma(src, length)
dev = mult * stdev(src, length)
upper = basis + dev
lower = basis - dev
BBval = (src - basis)/dev*30+50
offset = input(0, title = "Offset", type = input.integer, minval = -500, maxval = 500)
mix=(d + BBval)/2

//plot
//plot(k, "K", color=#606060)
plot(BBval, "BBval", color=#872323, offset = offset)
plot(d, "D", color=#FF6A00)
h0 = hline(80, "Upper Band", color=#606060)
h1 = hline(20, "Lower Band", color=#606060)
plot(mix, "MIX", color=#888888, linewidth=3)

//background MIX
bgcolor(mix < 20 ? color.green : color.white, transp=50)
bgcolor(mix > 80 ? color.red : color.white, transp=50)

// Choosing the date range
fromMonth = input(defval = 1,    title = "From Month",      type = input.integer, minval = 1, maxval = 12)
fromDay   = input(defval = 1,    title = "From Day",        type = input.integer, minval = 1, maxval = 31)
fromYear  = input(defval = 2020, title = "From Year",       type = input.integer, minval = 1970)
toMonth = input(defval = 1,    title = "To Month",      type = input.integer, minval = 1, maxval = 12)
toDay   = input(defval = 1,    title = "To Day",        type = input.integer, minval = 1, maxval = 31)
toYear  = input(defval = 2112, title = "To Year",       type = input.integer, minval = 1970)

start     = timestamp(fromYear, fromMonth, fromDay, 00, 00)        // backtest start window
finish    = timestamp(toYear, toMonth, toDay, 23, 59)        // backtest finish window
window()  => true

// Initializing the strategy paraeters

P = input(defval = 1, title = 'Amount (P)' , type = input.integer, minval = 1, maxval = 100)
X = input(defval = 2, title = '% Price drop for consecutive entries(X)', type = input.float, minval = 1, maxval = 100)
B_tp = input(defval = 10, title = '% Level for Take Profit (B)', type = input.float , minval = 1, maxval = 100)
D_sl = input(defval = 10, title = '% Level for Stop Loss (D)', type = input.float, minval = 1, maxval = 100)
A = input(defval = 5, title = 'Max consecutive entries (A)', type = input.integer, minval = 2, maxval = 20)
Z = input(defval = 0.5, title = 'Z', type = input.float , minval = 0, maxval = 10)

// Declaring key DCA variables
entry_price = 0.0
entry_price := na(entry_price[1]) ? na : entry_price[1]
new_entry = 0.0
consec_entryCondition = false
// Implementing the strategy
longEntry = crossover(mix,20)
exitLongs = crossunder(mix, 80)

if(longEntry)
    entry_price := close
    strategy.entry('main_LE', strategy.long , P, when = window() and longEntry)

// Exiting conditions
stoploss = strategy.position_avg_price*(1-(D_sl/100))
takeprofit = strategy.position_avg_price*(1+(B_tp/100))
slCondition = crossunder(close, stoploss)
tpCondition = crossover(close, takeprofit)

// We want to exit if the 'mix' indicator crosses 80, take profit is attained or stop loss is tagged.
exitConditions = exitLongs or slCondition or tpCondition

// Consecutive entries upto A times
// strategy.risk.max_intraday_filled_orders(A)

//Dollar-Cost-Averaging
// Enter long whenever price goes down X%: amount set to (P+Y)*Z
newAmount = (P+X)*Z
// If we haven't reached max open trades, buy newAmount immediately price crosses under X% lower the previous entry price
new_entry := entry_price - ((X/100)*entry_price)
consec_entryCondition := crossunder(close, new_entry)
if(consec_entryCondition and strategy.opentrades != A)
    strategy.entry('consec_LE', strategy.long, newAmount, oca_name = 'consecLongs', when = window() and consec_entryCondition)
    entry_price := close

// Exiting
// The main trade is closed only when the  main exit conditions are satisfied
strategy.close('main_LE', comment = 'Main Long Closed', when = window() and exitConditions)

// A consective long is closed only when tp or sl is tagged
strategy.exit('ext a consec', 'consec_LE', loss = D_sl*strategy.position_avg_price , profit = B_tp*strategy.position_avg_price, oca_name =  'consecLongs')