Negociação de Momentum: Estratégia de Crossover de Média Móvel Dupla

Visão geral
A estratégia usa uma média móvel indexada de 8 e 21 períodos (EMA) para identificar mudanças na tendência do mercado. Quando uma EMA de menor período atravessa uma EMA de maior período, gera um sinal de compra; ao contrário, quando uma EMA de menor período atravessa uma EMA de maior período, gera um sinal de venda. A estratégia também combina três baixos mais altos (HLL) e três altos mais baixos (LLH) como sinais de confirmação de uma reversão de tendência.
Princípio da estratégia
- Calcule EMAs de 8 e 21 ciclos para identificar as principais direções de tendência.
- Identificar três altas mais altas consecutivas (HLL) e três altas mais baixas consecutivas (LLH), como um sinal precoce de uma reversão de tendência.
- Um sinal de compra é gerado quando um EMA de 8 ciclos atravessa um EMA de 21 ciclos de baixo e ocorre uma quebra de HLL; um sinal de venda é gerado quando um EMA de 8 ciclos atravessa um EMA de 21 ciclos de cima e ocorre uma quebra de LLH.
- O nível de stop-loss é de 5% do preço de entrada e o nível de stop-loss é de 16% do preço de entrada para controlar o risco e bloquear os lucros.
- Quando surgir um sinal de reversão, feche a posição e reverte a posição.
Vantagens estratégicas
- Combinação de EMA e padrões de comportamento de preços (HLL e LLH) para confirmar tendências e aumentar a confiabilidade do sinal.
- Estabelecer níveis claros de stop loss e stop loss ajuda a controlar o risco e bloquear os lucros.
- Aplica-se em vários períodos de tempo e em diferentes mercados, com uma certa universalidade.
- A lógica é clara, fácil de entender e de implementar.
Risco estratégico
- Em um mercado em turbulência, a frequência de cruzamentos pode levar a falsos sinais repetidos, resultando em perdas.
- Os níveis fixos de stop-loss e stop-loss podem não se adaptar a diferentes condições de mercado, resultando em custos de oportunidade potenciais ou em maiores perdas.
- A estratégia depende de dados históricos e pode ser menos adaptável a eventos inesperados ou mudanças fundamentais.
Direção de otimização da estratégia
- Introduzir mecanismos de stop loss e stop loss adaptativos, como o ATR, para ajustar os níveis de stop loss e stop loss com base na volatilidade, de modo a melhor se adaptar a diferentes condições de mercado.
- Em combinação com outros indicadores ou fatores, como volume de transação, índice de força relativa (RSI) e outros, para filtrar ainda mais os sinais e aumentar a confiabilidade.
- Otimização de parâmetros (como o ciclo EMA, o índice de stop loss, etc.) para encontrar a combinação de parâmetros que melhor funciona em um determinado mercado ou indicador.
- Considere a introdução de medidas de gestão de risco, como o dimensionamento de posições, para controlar a abertura de risco de transações individuais.
Resumir
A estratégia utiliza o cruzamento dos EMAs de 8 e 21 ciclos, combinados com os modelos de preços HLL e LLH, para identificar reversões de tendências e produzir sinais de negociação. Uma regra de stop loss clara ajuda a controlar o risco e bloquear os lucros. No entanto, a estratégia pode produzir sinais falsos em mercados turbulentos e níveis fixos de stop loss podem não ser adaptados a diferentes ambientes de mercado.
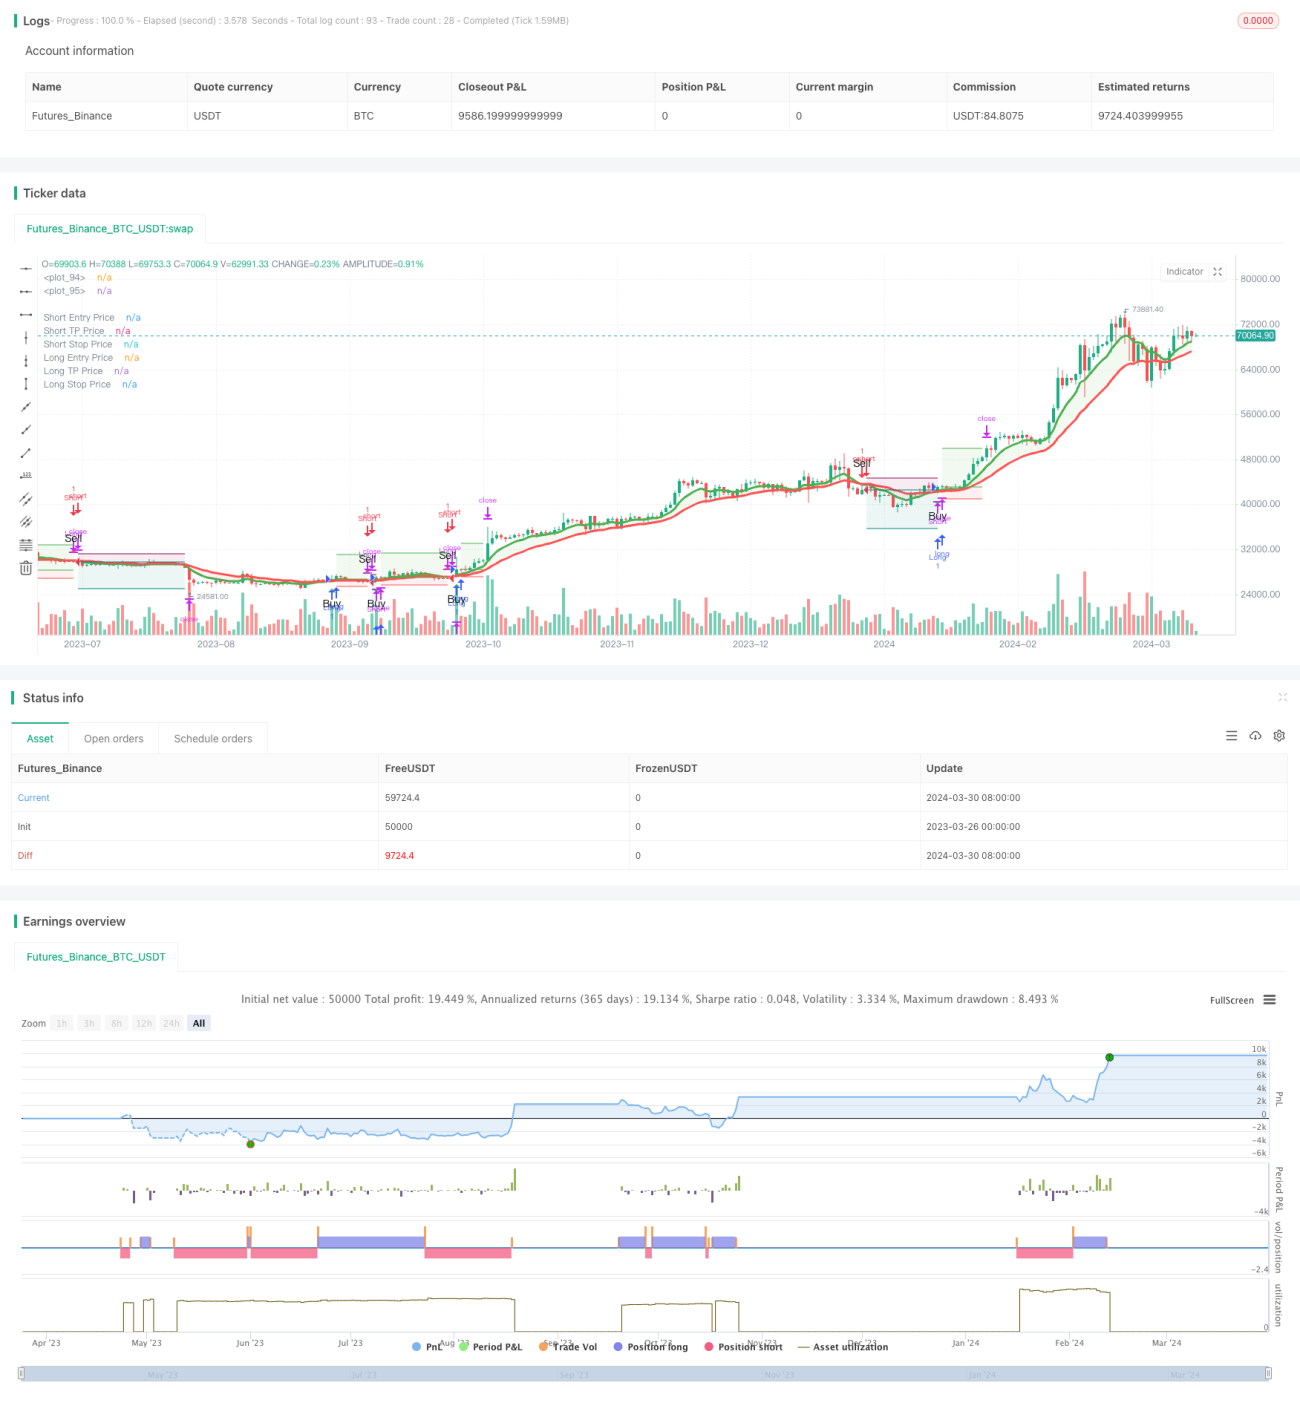
/*backtest
start: 2023-03-26 00:00:00
end: 2024-03-31 00:00:00
period: 1d
basePeriod: 1h
exchanges: [{"eid":"Futures_Binance","currency":"BTC_USDT"}]
*/

//@version=5
strategy('Trend Following 8&21EMA with strategy tester [ukiuro7]', overlay=true, process_orders_on_close=true, calc_on_every_tick=true, initial_capital = 10000)

//INPUTS- 1