Автоматизированная торговая стратегия RSI Long-Short

Обзор
Эта стратегия основана на относительно сильных и слабых индикаторах (RSI), которые позволяют автоматически проводить торговлю, когда RSI достигает зоны перекупа и перепродажи.
Стратегический принцип
Эта стратегия получает значения RSI в диапазоне 0-100 путем расчета взлетов и падений акций в течение определенного периода. Когда RSI ниже 30, это перепродажа, а когда он выше 70, это перекуп. Согласно этому правилу, когда RSI достигает зоны перепродажи, он автоматически делает ставку, а когда он достигает зоны перекупа, он автоматически делает ставку.
В частности, стратегия сначала рассчитывает значение RSI за 15 циклов. Когда RSI падает ниже 20, считается, что он находится в состоянии перепродажи, в то время как в 200-дневный переходный средний выше, чтобы сделать больше вход. Когда RSI поднимается выше 80, считается, что он находится в состоянии перекупа, в то время как пустой вход.
Кроме того, при появлении сигнала цена рисует соответствующие маркировочные линии и ярлыки, что делает торговый сигнал более интуитивным.
Стратегические преимущества
- Стратегическая концепция ясна, проста и понятна
- Оптимизм в оценке перепродажи на основе RSI
- Полностью автоматизированная торговля без вмешательства человека
- Настройка тормозной остановки для эффективного управления рисками
- Интуитивно понятные и легко контролируемые торговые сигналы
Стратегический риск
- RSI имеет определенную отсталость, что может привести к ошибочным оценкам
- Фиксированный предел перекупки не распространяется на все сорта
- Неправильная установка стоп-пойнтов может привести к большим потерям
- Больше дефолтов на трендовых рынках может привести к убыткам
Меры контроля риска включают в себя: оптимизацию параметров RSI, корректировку отклонений от перекупа до перепродажи в соответствии с различными сортами, разумную установку стоп-лосса, избежание обратной торговли в сочетании с трендовыми показателями.
Направление оптимизации стратегии
- Оптимизация параметров RSI для повышения точности определения перекупа и перепродажи
- В сочетании с другими индикаторами подтверждает торговый сигнал, например, KDJ, MACD и т. д.
- Оптимизация стоп-пойнтов в зависимости от рыночных условий
- Повышение оценки тенденций и предотвращение контрреволюционных операций
- Настройка кривой прибыли и убытка
- Разработка модулей управления ветром для управления индивидуальными и совокупными рисками
Подвести итог
Стратегия Overall - это автоматическая торговая стратегия, использующая RSI для определения перекупа и перепродажи. Она выдает торговый сигнал, когда RSI достигает крайней зоны перекупа и перепродажи, и может автоматически совершать торговые операции.
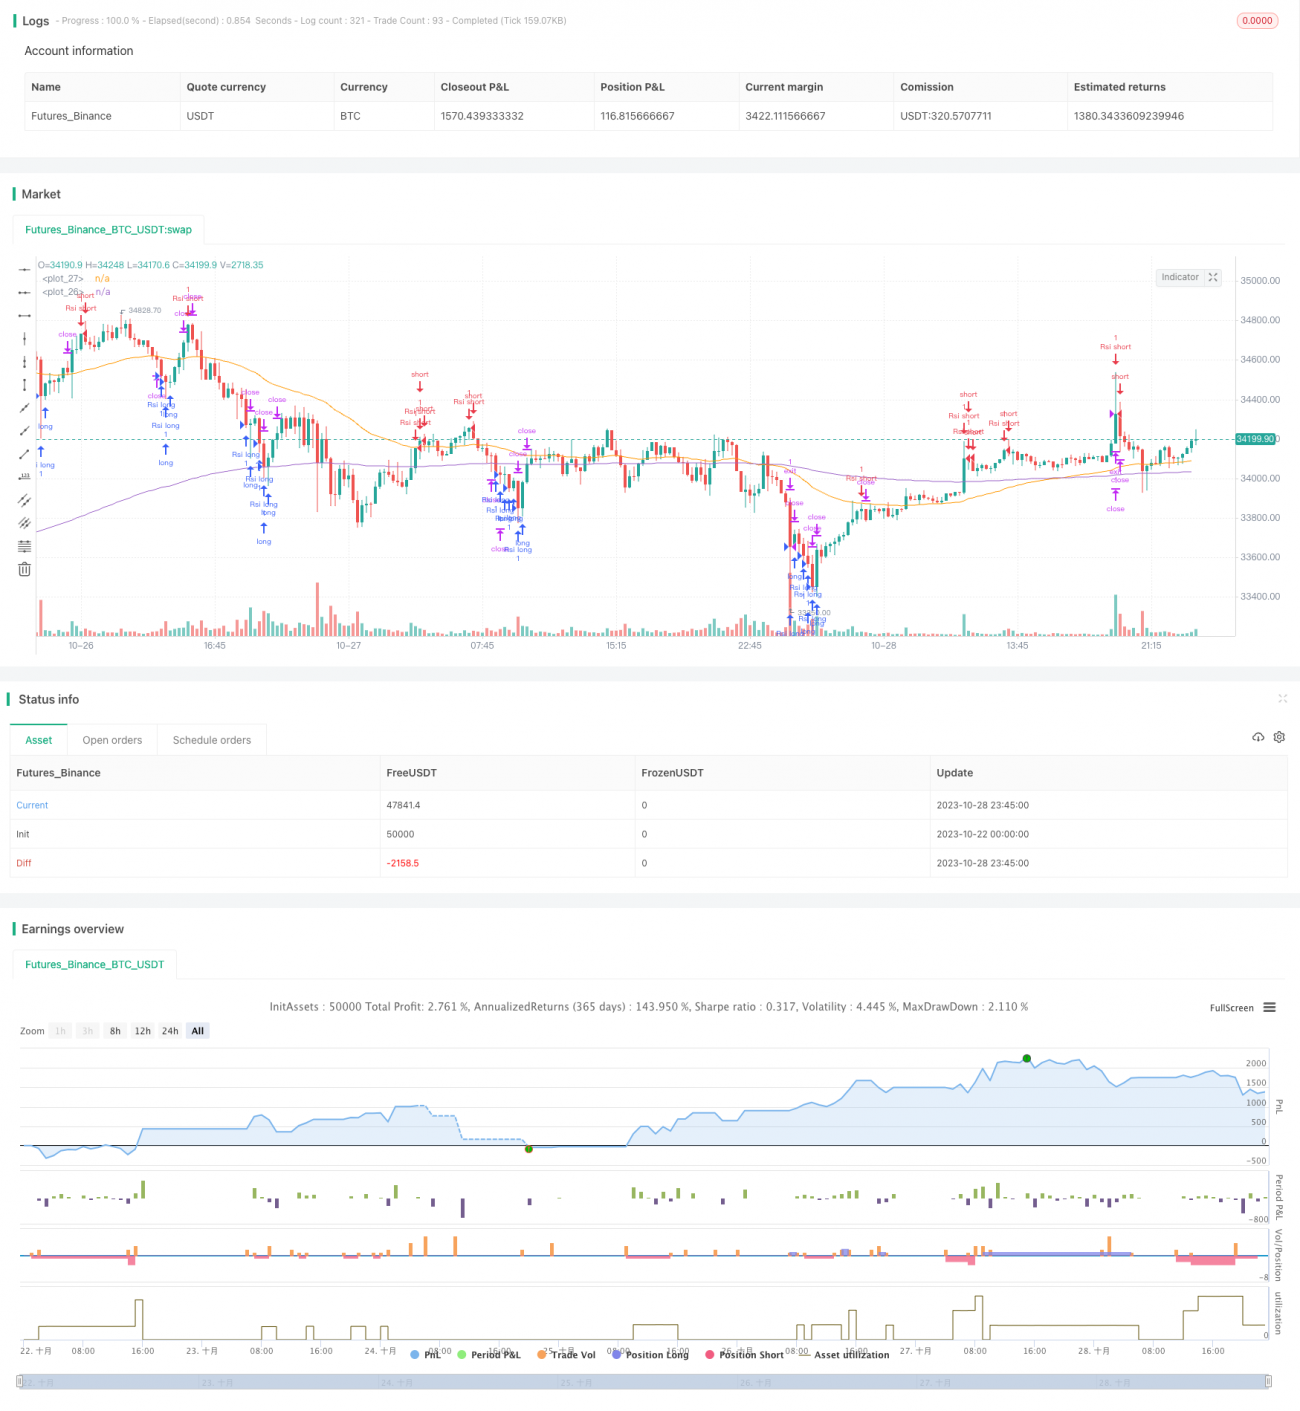
/*backtest
start: 2023-10-22 00:00:00
end: 2023-10-29 00:00:00
period: 15m
basePeriod: 5m
exchanges: [{"eid":"Futures_Binance","currency":"BTC_USDT"}]
*/

//@version=5
strategy("RSI Improved strategy", overlay=true)
higherTF1 = input.timeframe('15' , "Resolution", options = ['5', '15', '1H', 'D', 'W', 'M'])
dailyopen = request.security(syminfo.tickerid, higherTF1, close)- 1