Стратегия фильтра двойной скользящей средней «Прорыв тренда»

Обзор
Это стратегия, которая использует равнолинейный и буринговый каналы для определения тренда и в сочетании с прорывом фильтрации и остановки. Она может вовремя улавливать сигналы при изменении тренда, уменьшать ошибочные сигналы с помощью двойной равнолинейной фильтрации и устанавливать остановки для контроля риска.
Стратегический принцип
Стратегия состоит из следующих частей:
-
Определение трендов: использование MACD для определения ценовых тенденций, различающих многоголовые и пустые тенденции.
-
Фильтрация диапазона: используйте канал Бринна, чтобы определить диапазон колебаний цены и отфильтровать сигналы, которые не нарушают диапазон.
-
Подтверждение двойной средней линии: двойная средняя линия, состоящая из быстрой ЭМА и медленной ЭМА, используется для подтверждения сигнала тренда. Сигнал покупки создается только тогда, когда быстрая ЭМА> медленная ЭМА.
-
Механизм остановки убытков: устанавливается точка остановки убытков, при которой цена прекращает свою позицию, когда она пробивается в неблагоприятном направлении.
Входящий сигнал имеет следующую логику:
- MACD считает, что это тенденция вверх
- Цены вышли на трассу через Буринский канал
- Быстрая EMA выше, чем медленная
Сигнал покупки создается, когда выполняются все три условия.
Логика равных позиций делится на две категории: стоп-офф-офф и стоп-офф-офф. Стоп-офф умножается на входную цену в определенной пропорции, а стоп-офф умножается на входную цену в определенной пропорции.
Анализ преимуществ
Эта стратегия имеет следующие преимущества:
- Это позволяет быстро отслеживать изменения в тренде, а не отслеживать их.
- Повышение качества сигнала с помощью фильтрации ошибочных сигналов через двойную равномерность.
- Система сдерживания убытков эффективно контролирует убытки.
- Параметры оптимизируются в большом объеме и могут быть отрегулированы до оптимального состояния.
Анализ рисков
Однако эта стратегия также несет в себе некоторые риски:
- Неправильный сигнал при землетрясении может привести к ущербу.
- Неправильная установка стоп-пойнтов может привести к ненужным потерям.
- Неправильные параметры могут привести к неэффективности стратегии.
Эти риски могут быть оптимизированы и улучшены путем оптимизации параметров, корректировки стоп-позиции и т. Д.
Направление оптимизации
Эта стратегия может быть оптимизирована в следующих направлениях:
- Настройка длины двойной равномерной линии для поиска оптимальной комбинации параметров.
- Тестирование различных способов остановки, таких как отслеживание остановки, шоковой остановки и т. д.
- Тестирование MACD-параметров для поиска оптимальных.
- Автоматическая оптимизация параметров с использованием машинного обучения.
- Добавление дополнительных условных фильтров.
Оптимистическое состояние стратегии может быть найдено путем тестирования различных параметров, оценки доходности и коэффициента Шарпа.
Подвести итог
Это количественная стратегия, использующая тенденции, диапазон фильтров, двойную равнолинейную подтверждение и остановку мысли. Она может эффективно определять направление тенденции, находить баланс между максимизацией прибыли и контролем риска.
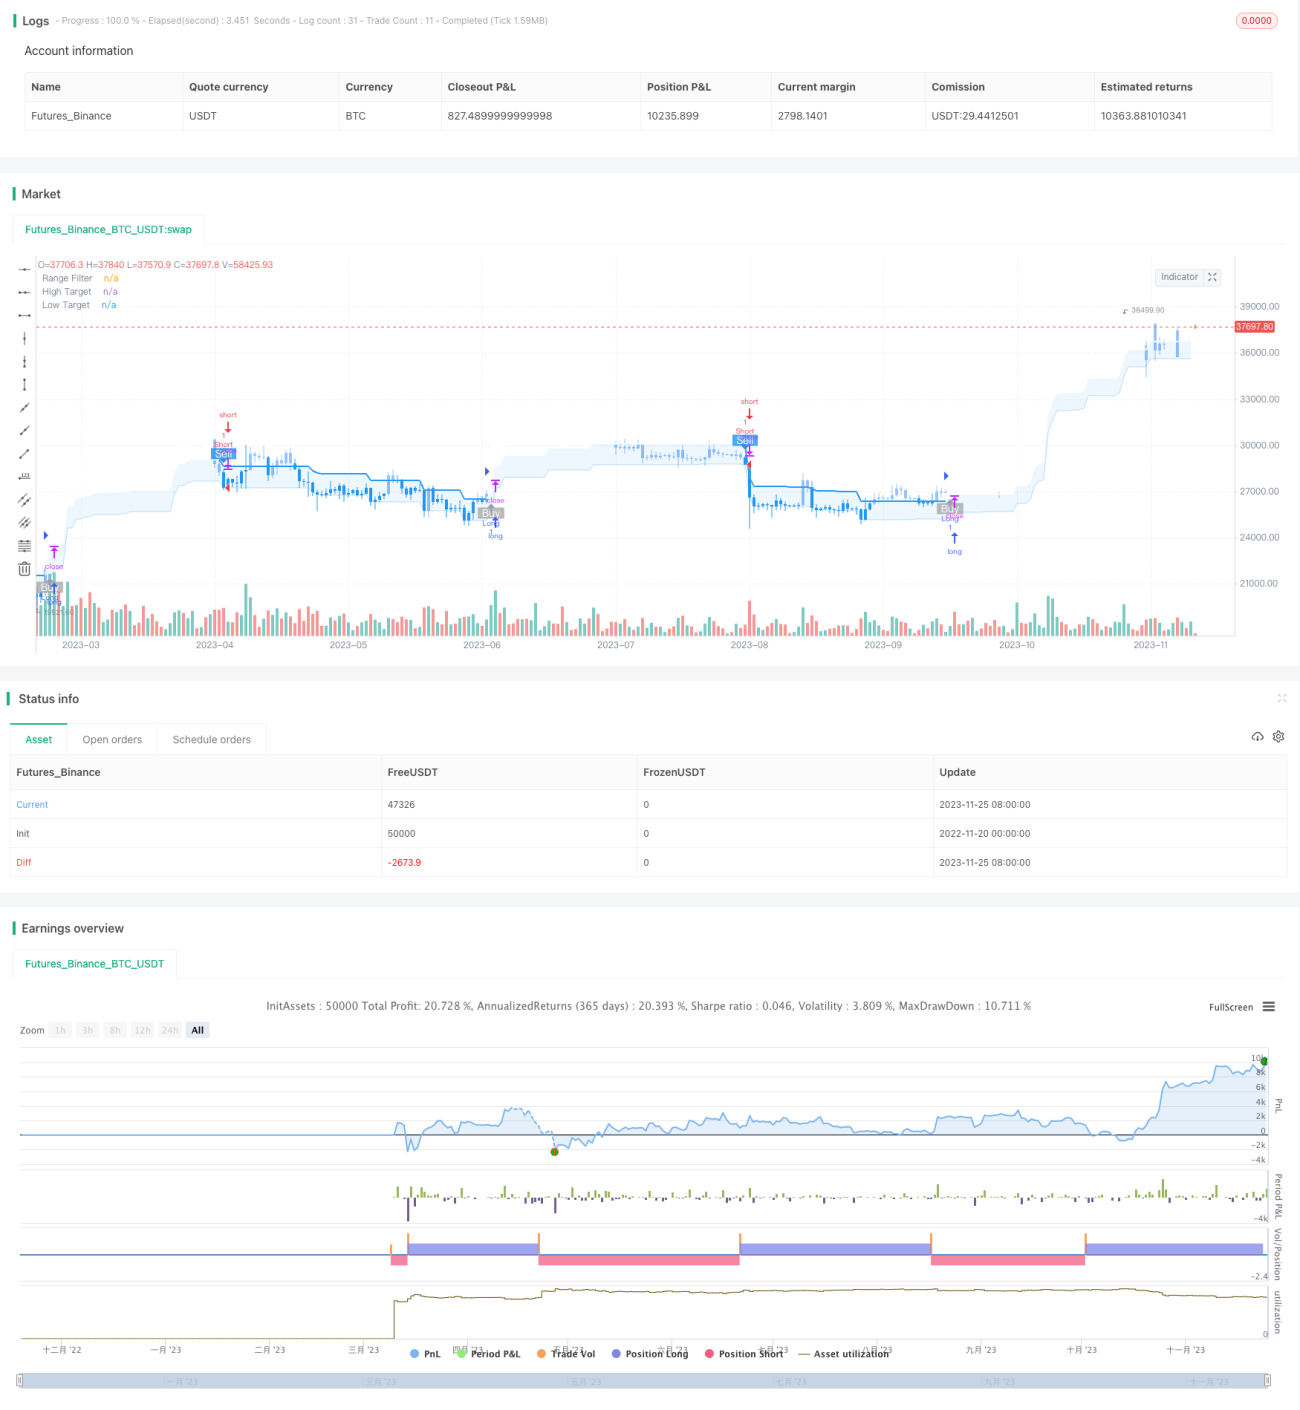
/*backtest
start: 2022-11-20 00:00:00
end: 2023-11-26 00:00:00
period: 1d
basePeriod: 1h
exchanges: [{"eid":"Futures_Binance","currency":"BTC_USDT"}]
*/

//@version=5
strategy(title="Range Filter Buy and Sell Strategies", shorttitle="Range Filter Strategies", overlay=true,pyramiding = 5)

// Original Script > @DonovanWall- 1