Стратегия следования за трендом двойного разворота

Обзор
Это стратегия для отслеживания трендов, объединенная с двойным сигналом обратного отсчета. Она объединяет 123 стратегии обратного отсчета и стратегию индекса производительности, чтобы отслеживать точки обратного отсчета цены и обеспечивать более надежное определение тренда.
Стратегический принцип
Эта стратегия состоит из двух подстратегий:
-
123 Стратегия переворота
Используйте 14-дневную K-линию, чтобы определить обратный сигнал. Конкретные правила:
- Многоголовый сигнал: закрытие цены снизилось за два дня, текущая цена закрытия K-линии выше, чем закрытие цены за предыдущий день, Stochastic Slow на 9 день ниже 50
- Поверхностный сигнал: цена на закрытие на первые два дня выросла, текущая цена на закрытие линии K ниже, чем цена на закрытие на предыдущий день, Stochastic Fast на 9 день выше 50
-
Стратегия индекса производительности
В качестве индикатора используются взлеты и падения за последние 14 дней.
- Показатель производительности> ((0)), создает многоголовый сигнал
- Показатель производительности <(0), создает пустой сигнал
Окончательный сигнал - это комбинация двух сигналов. То есть, для создания фактической операции купли-продажи необходим однонаправленный многополосный сигнал.
Это позволяет отфильтровывать часть шума, что делает сигнал более надежным.
Стратегические преимущества
Эта двойная система имеет следующие преимущества:
- Сигналы более надежны, когда используются двойные факторы
- Это позволяет эффективно отфильтровывать рыночный шум и избегать ложных сигналов.
- 123 формы классические и практические, легко оценить и воспроизвести
- Индекс производительности позволяет определить будущие тенденции
- Гибкий и оптимизируемый набор параметров
Стратегический риск
Однако эта стратегия также несет в себе некоторые риски:
- Возможно, мы пропустили внезапный поворот и не смогли полностью уловить тенденцию.
- Комбинация двойных условий приводит к уменьшению сигнала, что может повлиять на прибыльность
- Необходимость принятия решений на равных, подверженность особым колебаниям в акциях
- Проблемы с параметрами могут привести к отклонению сигнала
Можно рассмотреть следующие варианты оптимизации:
- Настройка параметров, таких как длина K-линии, Стохастический цикл и т. д.
- Оптимизация логики суждения двойных сигналов
- Вместе с другими факторами, такими как объем перевода.
- Увеличение убыточности
Подвести итог
Эта стратегия включает в себя двойное обратное суждение, что позволяет эффективно обнаруживать точки переворота цены. Хотя вероятность возникновения сигнала снижена, она имеет высокую надежность и подходит для захвата средне-длинных тенденций. Эффективность стратегии может быть дополнительно усилена с помощью параметрической корректировки и многофакторной оптимизации.
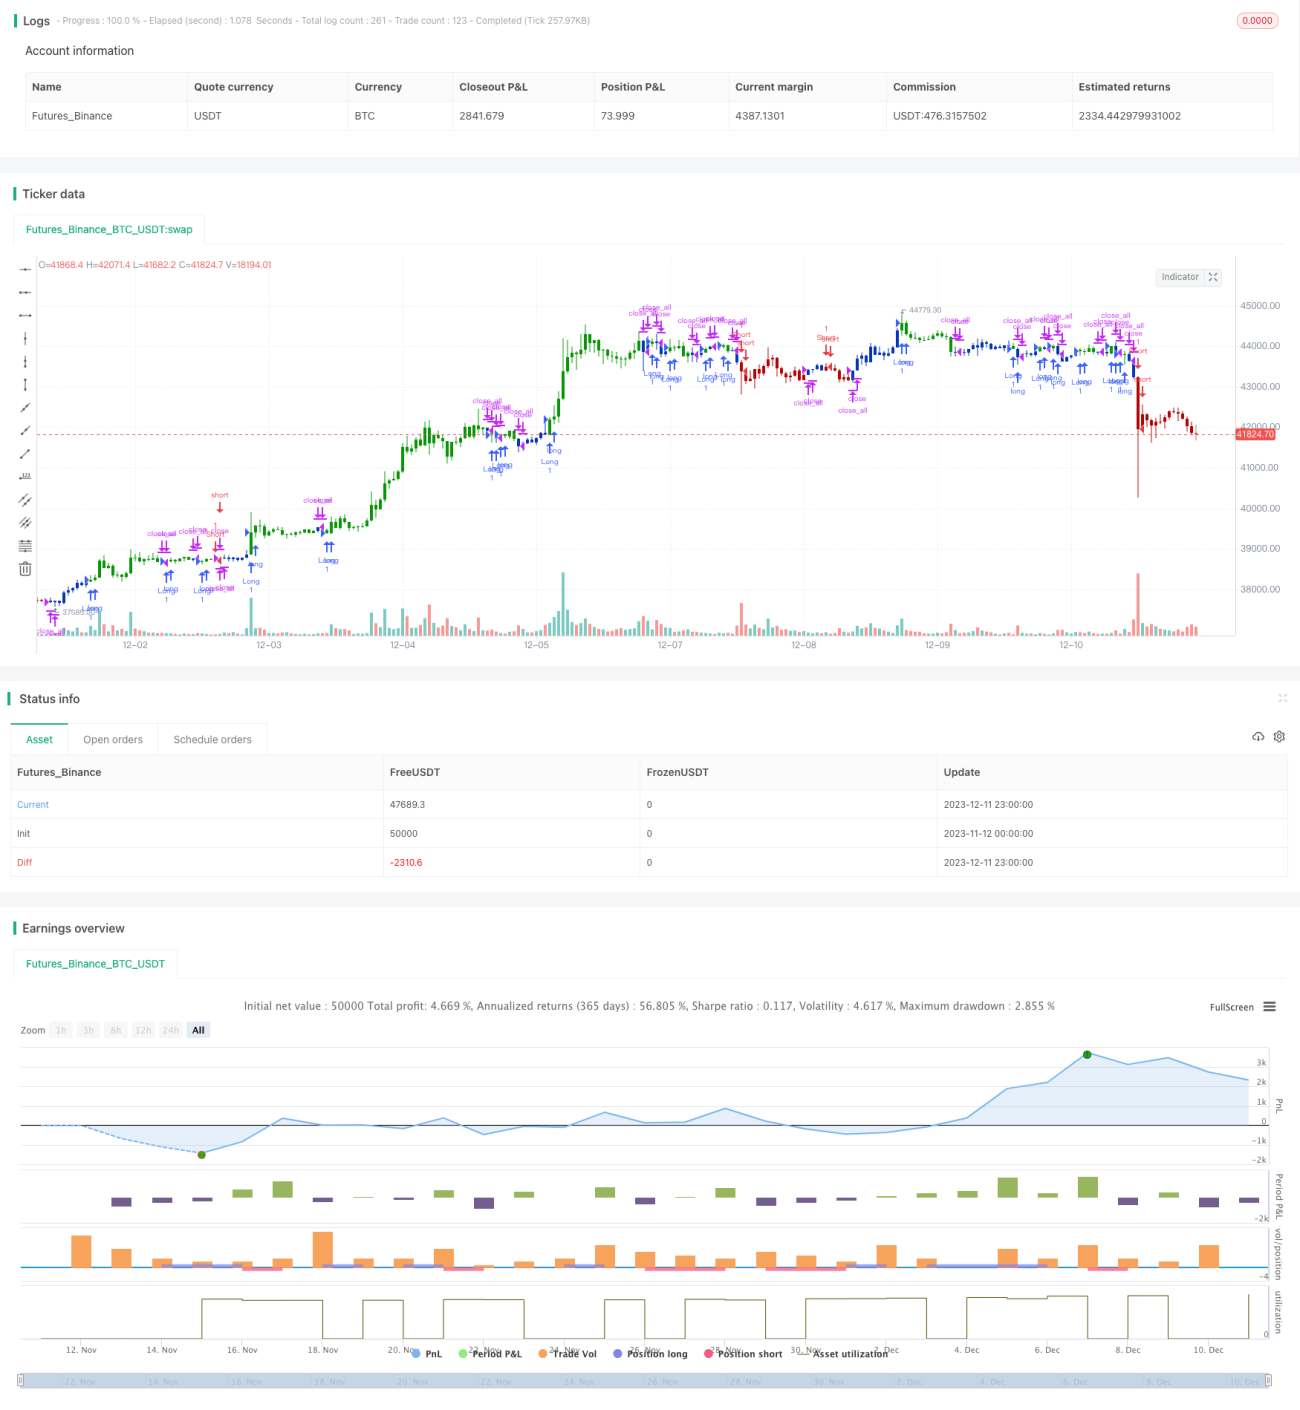
/*backtest
start: 2023-11-12 00:00:00
end: 2023-12-12 00:00:00
period: 1h
basePeriod: 15m
exchanges: [{"eid":"Futures_Binance","currency":"BTC_USDT"}]
*/

//@version=4
////////////////////////////////////////////////////////////
//  Copyright by HPotter v1.0 15/04/2021
// This is combo strategies for get a cumulative signal. - 1