Стратегия скользящего стоп-лосса Supertrend на основе Heikin Ashi
Обзор стратегии
Эта стратегия является стратегией отслеживания тренда, которая сочетает в себе штрих Heikin Ashi и индикатор супертенденции. Она использует штрих Heikin Ashi, чтобы отфильтровать рыночный шум, показатель супертенденции, чтобы определить направление тренда и использовать супертенденцию в качестве динамической штрих-стоп для эффективного отслеживания тренда и контроля риска.
Стратегический принцип
- Вычислите линию Heikin Ashi: включая цены открытия, закрытия, максимума, минимума.
- Вычисление супертенденционного индикатора: вычисление наверх и вниз по ATR и цене.
- В сочетании с линией Heikin Ashi и супер трендом определяется направление тренда.
- Позитивный тренд, когда цена закрытия Heikin Ashi ближе к верхней линии супертенденции по сравнению с ценой закрытия предыдущей линии K. Позитивный тренд, когда цена закрытия Heikin Ashi ближе к нижней линии супертенденции по сравнению с ценой закрытия предыдущей линии K.
- В позитивном тренде, сверхтяжелый тренд используется для отслеживания стоп-линии; в нисходящем тренде, сверхтяжелый тренд используется для отслеживания стоп-линии.
Стратегические преимущества
- С помощью фильтра Heikin Ashi можно более надежно идентифицировать сигналы тренда, используя ложные прорывы.
- Супертренды используются как динамическая остановка убытков, чтобы максимально закрепить тренд на прибыли и избежать чрезмерного отступления.
- В сочетании с различными временными циклами, определение пустоты позволяет более надежно подтвердить высоко-низкий сигнал.
- Функция временного отключения позволяет избежать влияния нерациональных действий в определенное время.
Стратегический риск
- Стойкость к потере при обратном тренде. Стойкость к потере может быть снижена с помощью соответствующего ослабления линии.
- Неправильная настройка параметров супертенденции может привести к слишком широкому или слишком узкому остановке. Можно тестировать различные комбинации параметров.
- Не учитываются вопросы управления капиталом. Должен быть установлен контроль позиций.
- Не учитывается стоимость сделки.
Направление оптимизации стратегии
- Оптимизируйте параметры супертенденций, чтобы найти оптимальные.
- Добавлена функция контроля позиций.
- Добавление дополнительных затрат, таких как комиссионные, скидки и т.д.
- Стойкость может быть изменена в зависимости от силы и слабости тренда.
- Подумайте о фильтрации входных сигналов в сочетании с другими показателями.
Подвести итог
Стратегия объединяет преимущества двух индикаторов Heikin Ashi и супертронда, чтобы захватить направление тренда, а также использовать супертронда для автоматизированного отслеживания динамических остановок, что позволяет зафиксировать прибыль от тренда. Риски стратегии в основном связаны с реверсией тренда и оптимизацией параметров, которые могут быть улучшены путем дальнейшей оптимизации. В целом, стратегия использует интеграцию индикаторов для повышения стабильности и прибыли в торговой системе.
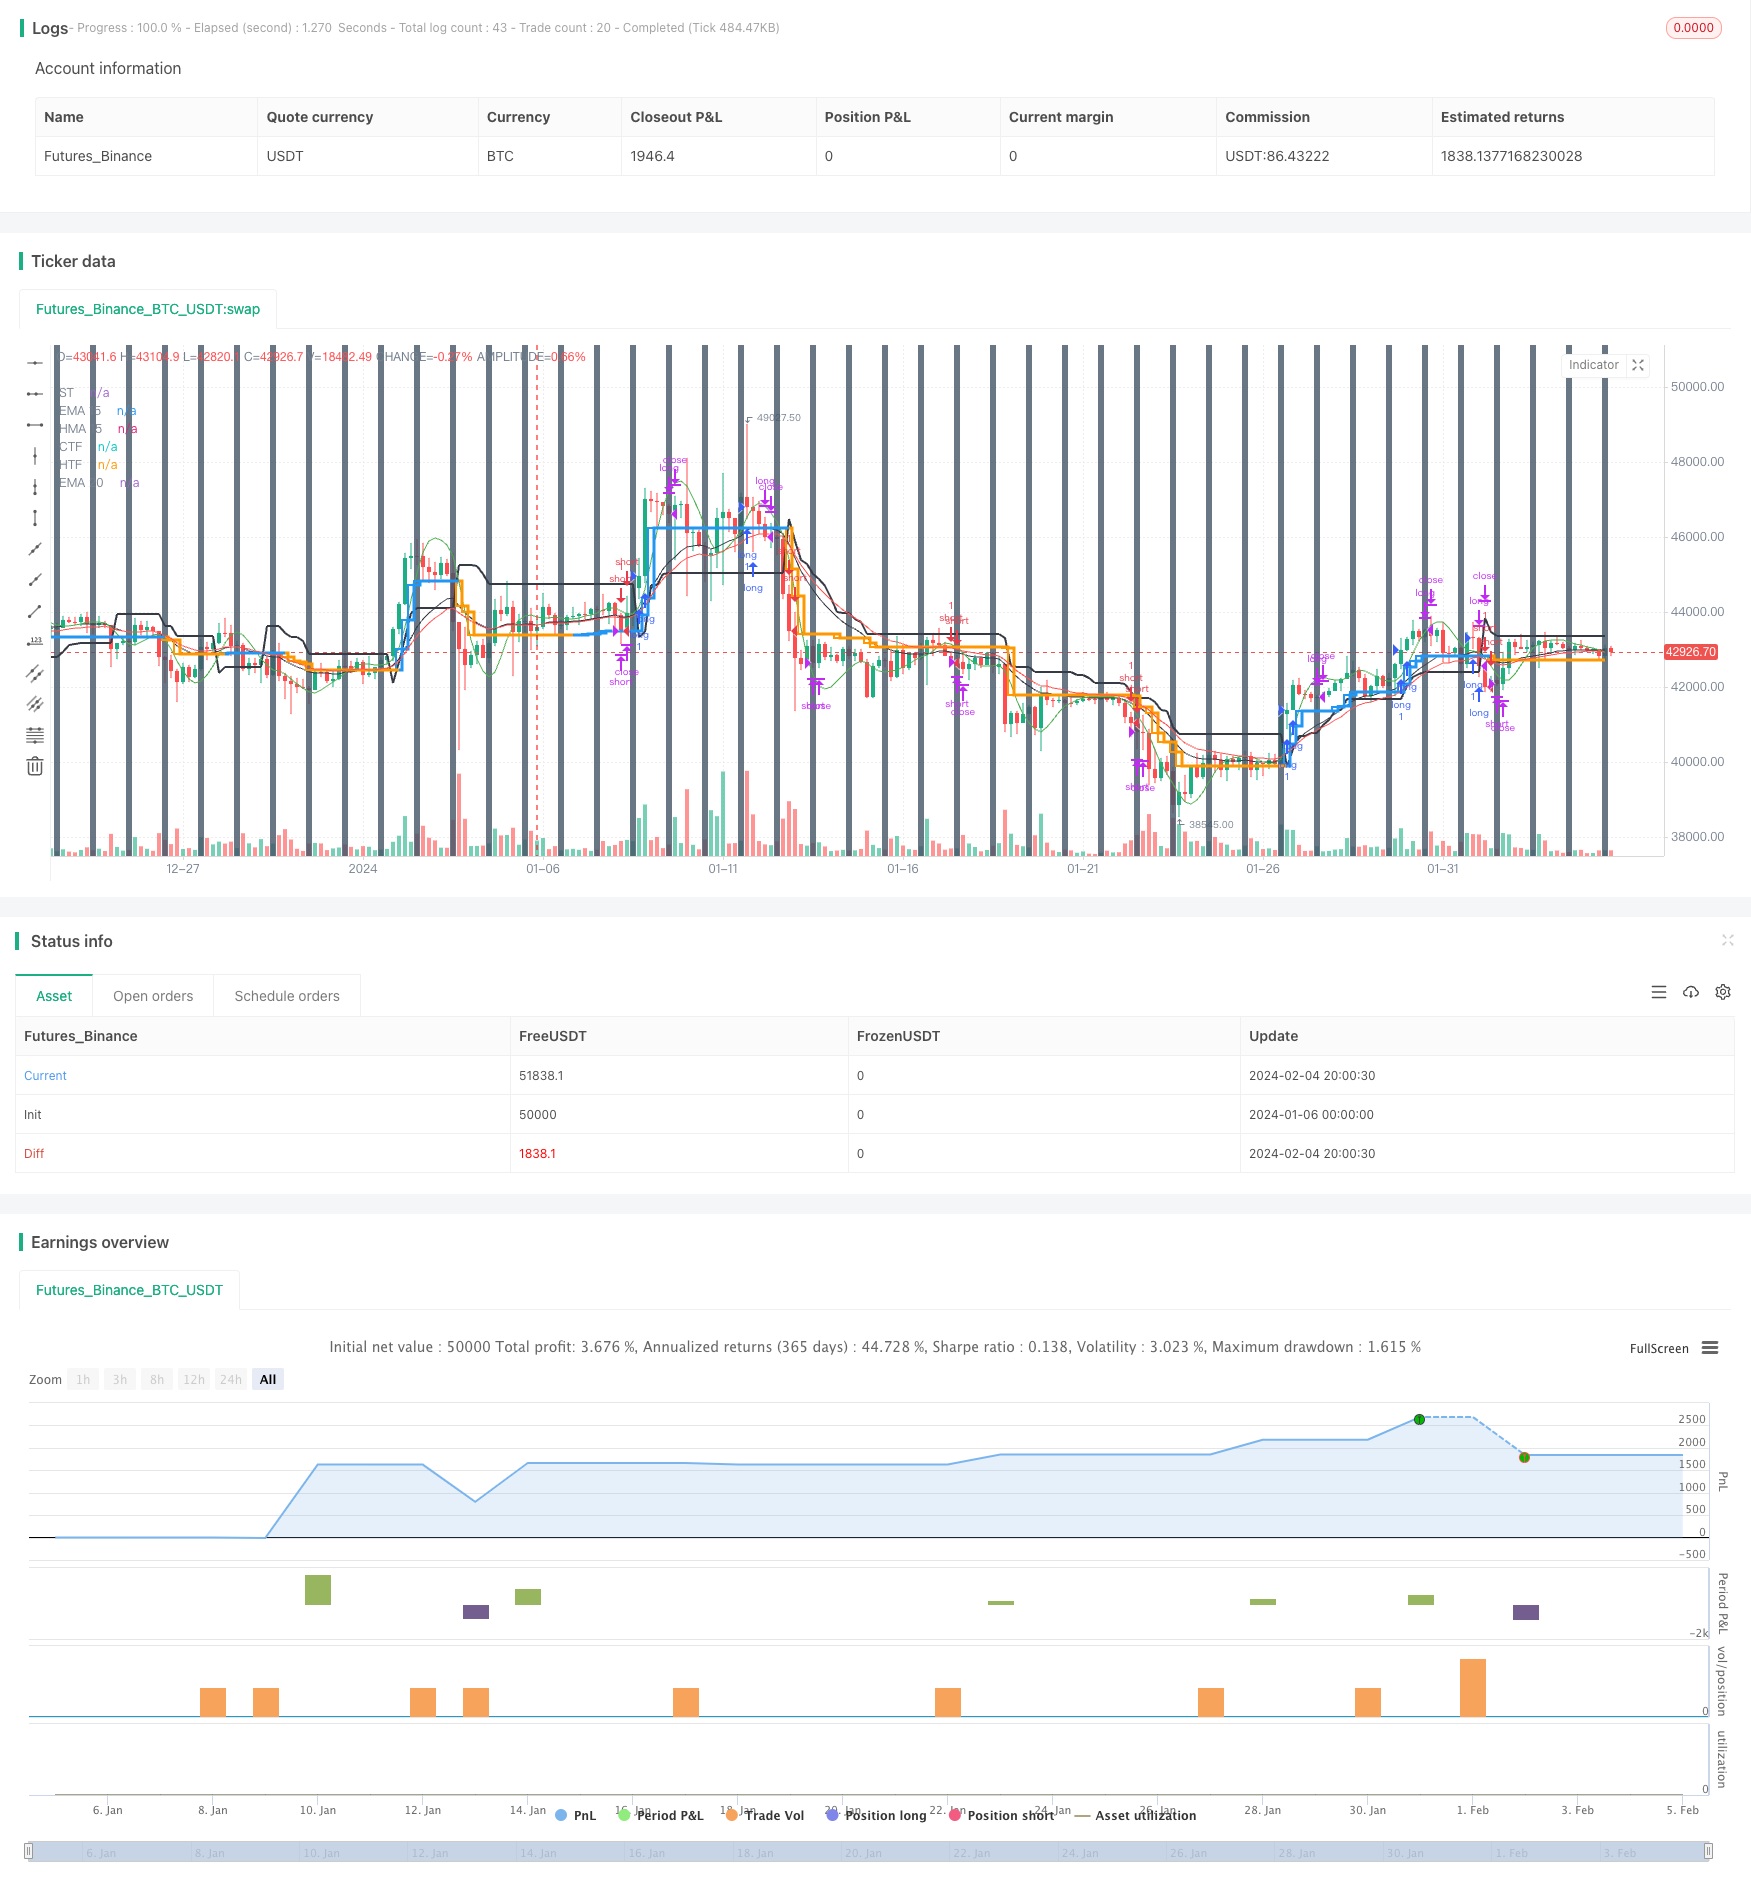
/*backtest
start: 2024-01-06 00:00:00
end: 2024-02-05 00:00:00
period: 4h
basePeriod: 15m
exchanges: [{"eid":"Futures_Binance","currency":"BTC_USDT"}]
*/

// This source code is subject to the terms of the Mozilla Public License 2.0 at https://mozilla.org/MPL/2.0/
// © ringashish

//@version=4
strategy("sa-strategy with HTF-TSL", overlay=true)


Pd = input(title="ATR Period", type=input.integer, defval=4)
Factor = input(title="ATR Multiplier", type=input.float, step=0.1, defval=2)
ST= supertrend(Factor, Pd)

heikinashi_close = security(heikinashi(syminfo.tickerid), timeframe.period, close)
heikinashi_low = security(heikinashi(syminfo.tickerid), timeframe.period, low)
heikinashi_open = security(heikinashi(syminfo.tickerid), timeframe.period, open)
heikinashi_high = security(heikinashi(syminfo.tickerid), timeframe.period, high)

heikinashi_close30 = security(heikinashi(syminfo.tickerid), "30", close)
//res1 = input("30", type=input.resolution, title="higher Timeframe")


//CCI TSL

res = input("240",type=input.resolution,title = "Higher Time Frame")
CCI = input(20)
ATR = input(5)
Multiplier=input(1,title='ATR Multiplier')
original=input(false,title='original coloring')
thisCCI = cci(close, CCI)
lastCCI = nz(thisCCI[1])


calcx()=>
    bufferDn= high + Multiplier * sma(tr,ATR)
    bufferUp= low - Multiplier * sma(tr,ATR)
    if (thisCCI >= 0 and lastCCI < 0)
        bufferUp := bufferDn[1]
    if (thisCCI <= 0 and lastCCI > 0)
        bufferDn := bufferUp[1]

    if (thisCCI >= 0)
        if (bufferUp < bufferUp[1])
            bufferUp := bufferUp[1]
    else
        if (thisCCI <= 0)
            if (bufferDn > bufferDn[1])
                bufferDn := bufferDn[1]


    x = 0.0
    x := thisCCI >= 0 ?bufferUp:thisCCI <= 0 ?bufferDn:x[1]
    x

tempx = calcx()

calcswap() =>
    swap = 0.0
    swap := tempx>tempx[1]?1:tempx<tempx[1]?-1:swap[1]
    swap

tempswap = calcswap()

swap2=tempswap==1?color.blue:color.orange
swap3=thisCCI >=0 ?color.blue:color.orange
swap4=original?swap3:swap2

//display current timeframe's Trend

plot(tempx,"CTF",color=swap4,transp=0,linewidth=2, style = plot.style_stepline)


htfx = security(syminfo.tickerid,res,tempx[1],lookahead = barmerge.lookahead_on)
htfswap4 = security(syminfo.tickerid,res,swap4[1],lookahead = barmerge.lookahead_on)

plot(htfx,"HTF",color=htfswap4,transp=0,linewidth=3,style = plot.style_stepline)


//supertrend
Supertrend(Factor, Pd) =>
    Up=hl2-(Factor*atr(Pd))
    Dn=hl2+(Factor*atr(Pd))

    TrendUp = 0.0
    TrendUp := heikinashi_close[1]>TrendUp[1] ? max(Up,TrendUp[1]) : Up
    TrendDown = 0.0
    TrendDown := heikinashi_close[1]<TrendDown[1]? min(Dn,TrendDown[1]) : Dn
    Trend = 0.0
    Trend := heikinashi_close > TrendDown[1] ? 1: heikinashi_close< TrendUp[1]? -1: nz(Trend[1],1)
    Tsl = Trend==1? TrendUp: TrendDown

    S_Buy = Trend == 1 ? 1 : 0
    S_Sell = Trend != 1 ? 1 : 0

    [Trend, Tsl]

[Trend,Tsl] = Supertrend(Factor, Pd)
// Security
//ST1_Trend_MTF = security(syminfo.tickerid, res1, Tsl,barmerge.lookahead_on)
//plot(ST1_Trend_MTF, "higher ST")

crossdn = crossunder(heikinashi_close,Tsl) or crossunder(heikinashi_close[1],Tsl) or crossunder(heikinashi_close[2],Tsl) or heikinashi_close < Tsl
crossup = crossover(heikinashi_close,Tsl) or crossover(heikinashi_close[1],Tsl) or crossover(heikinashi_close[2],Tsl) or heikinashi_close > Tsl
plot(Tsl,"ST",color = color.black,linewidth =2)
plot(ema(heikinashi_close,20),"EMA 20",color=color.red)
plot(hma(heikinashi_close,15),"HMA 15",color=color.green)
plot(ema(heikinashi_close,15),"EMA 15",color=color.black)

closedown = (heikinashi_close < hma(heikinashi_close,15) and heikinashi_high > hma(heikinashi_close,15)) or(heikinashi_close < ema(heikinashi_close,20) and heikinashi_high > ema(heikinashi_close,20))
closeup = (heikinashi_close > hma(heikinashi_close,15) and heikinashi_low < hma(heikinashi_close,15)) or (heikinashi_close > ema(heikinashi_close,20) and heikinashi_low < ema(heikinashi_close,20))

buy = heikinashi_open == heikinashi_low and closeup and crossup  and close > htfx
//buy = heikinashi_open == heikinashi_low and heikinashi_close > ema(close,20) and heikinashi_low < ema(close,20) and crossup
buyexit = cross(close,tempx) //heikinashi_open == heikinashi_high //and heikinashi_close < ema(close,15) and heikinashi_high > ema(close,15)

//if heikinashi_close30[1] < ST1_Trend_MTF
//sell = heikinashi_open == heikinashi_high and heikinashi_close < ema(close,20) and heikinashi_high > ema(close,20) and rsi(close,14)<60 and crossdn
sell = heikinashi_open == heikinashi_high and closedown and rsi(close,14)<55 and crossdn  and close < htfx
sellexit = cross(close,tempx) //heikinashi_open == heikinashi_low //and heikinashi_close > ema(close,15) and heikinashi_low < ema(close,15)

rg = 0
rg := buy ? 1 : buyexit ? 2 : nz(rg[1])

longLogic = rg != rg[1] and rg == 1
longExit = rg != rg[1] and rg == 2

//plotshape(longExit,"exit buy",style = shape.arrowup,location = location.belowbar,color = color.red, text ="buy exit", textcolor = color.red)
//plotshape(longLogic,"BUY",style = shape.arrowup,location = location.belowbar,color = color.green, text ="buy", textcolor= color.green)

nm = 0
nm := sell ? 1 : sellexit ? 2 : nz(nm[1])

shortLogic = nm != nm[1] and nm == 1
shortExit = nm != nm[1] and nm == 2

//plotshape(shortExit,"exit sell",style = shape.arrowup,location = location.belowbar,color = color.red, text ="sell exit", textcolor = color.red)
//plotshape(shortLogic,"SELL",style = shape.arrowup,location = location.belowbar,color = color.green, text ="sell", textcolor= color.green)


//Exit at particular time

ExitHour = input(title="Exit Hour Of Day", type=input.integer, defval=15, step = 5, maxval = 24, minval = 0)
ExitMint = input(title="Exit Minute Of Day", type=input.integer, defval=15, step = 5, maxval = 24, minval = 0)
bgc = input(title="Highlight Background Color?", type=input.bool, defval=true)
mRound(num,rem) => (floor(num/rem)*rem)
exitTime = (hour(time) >= ExitHour and (minute == mRound(ExitMint, timeframe.multiplier))) ? 1 : 0
exitTime := exitTime == 0 ? (hour(time) >= ExitHour and (minute + timeframe.multiplier >= ExitMint)) ? 1 : 0 : exitTime

MarketClose =  exitTime and not exitTime[1]

alertcondition(exitTime and not exitTime[1], title="Intraday Session Close Time", message="Close All Positions")
bgcolor(exitTime and not exitTime[1] and bgc ? #445566 : na, transp =40)


longCondition = longLogic
if (longCondition)
    strategy.entry("long", strategy.long)


shortCondition = shortLogic
if (shortCondition)
    strategy.entry("short", strategy.short)


strategy.close("short", when =cross(close,tempx)  or MarketClose)
strategy.close( "long", when =cross(close,tempx) or MarketClose )