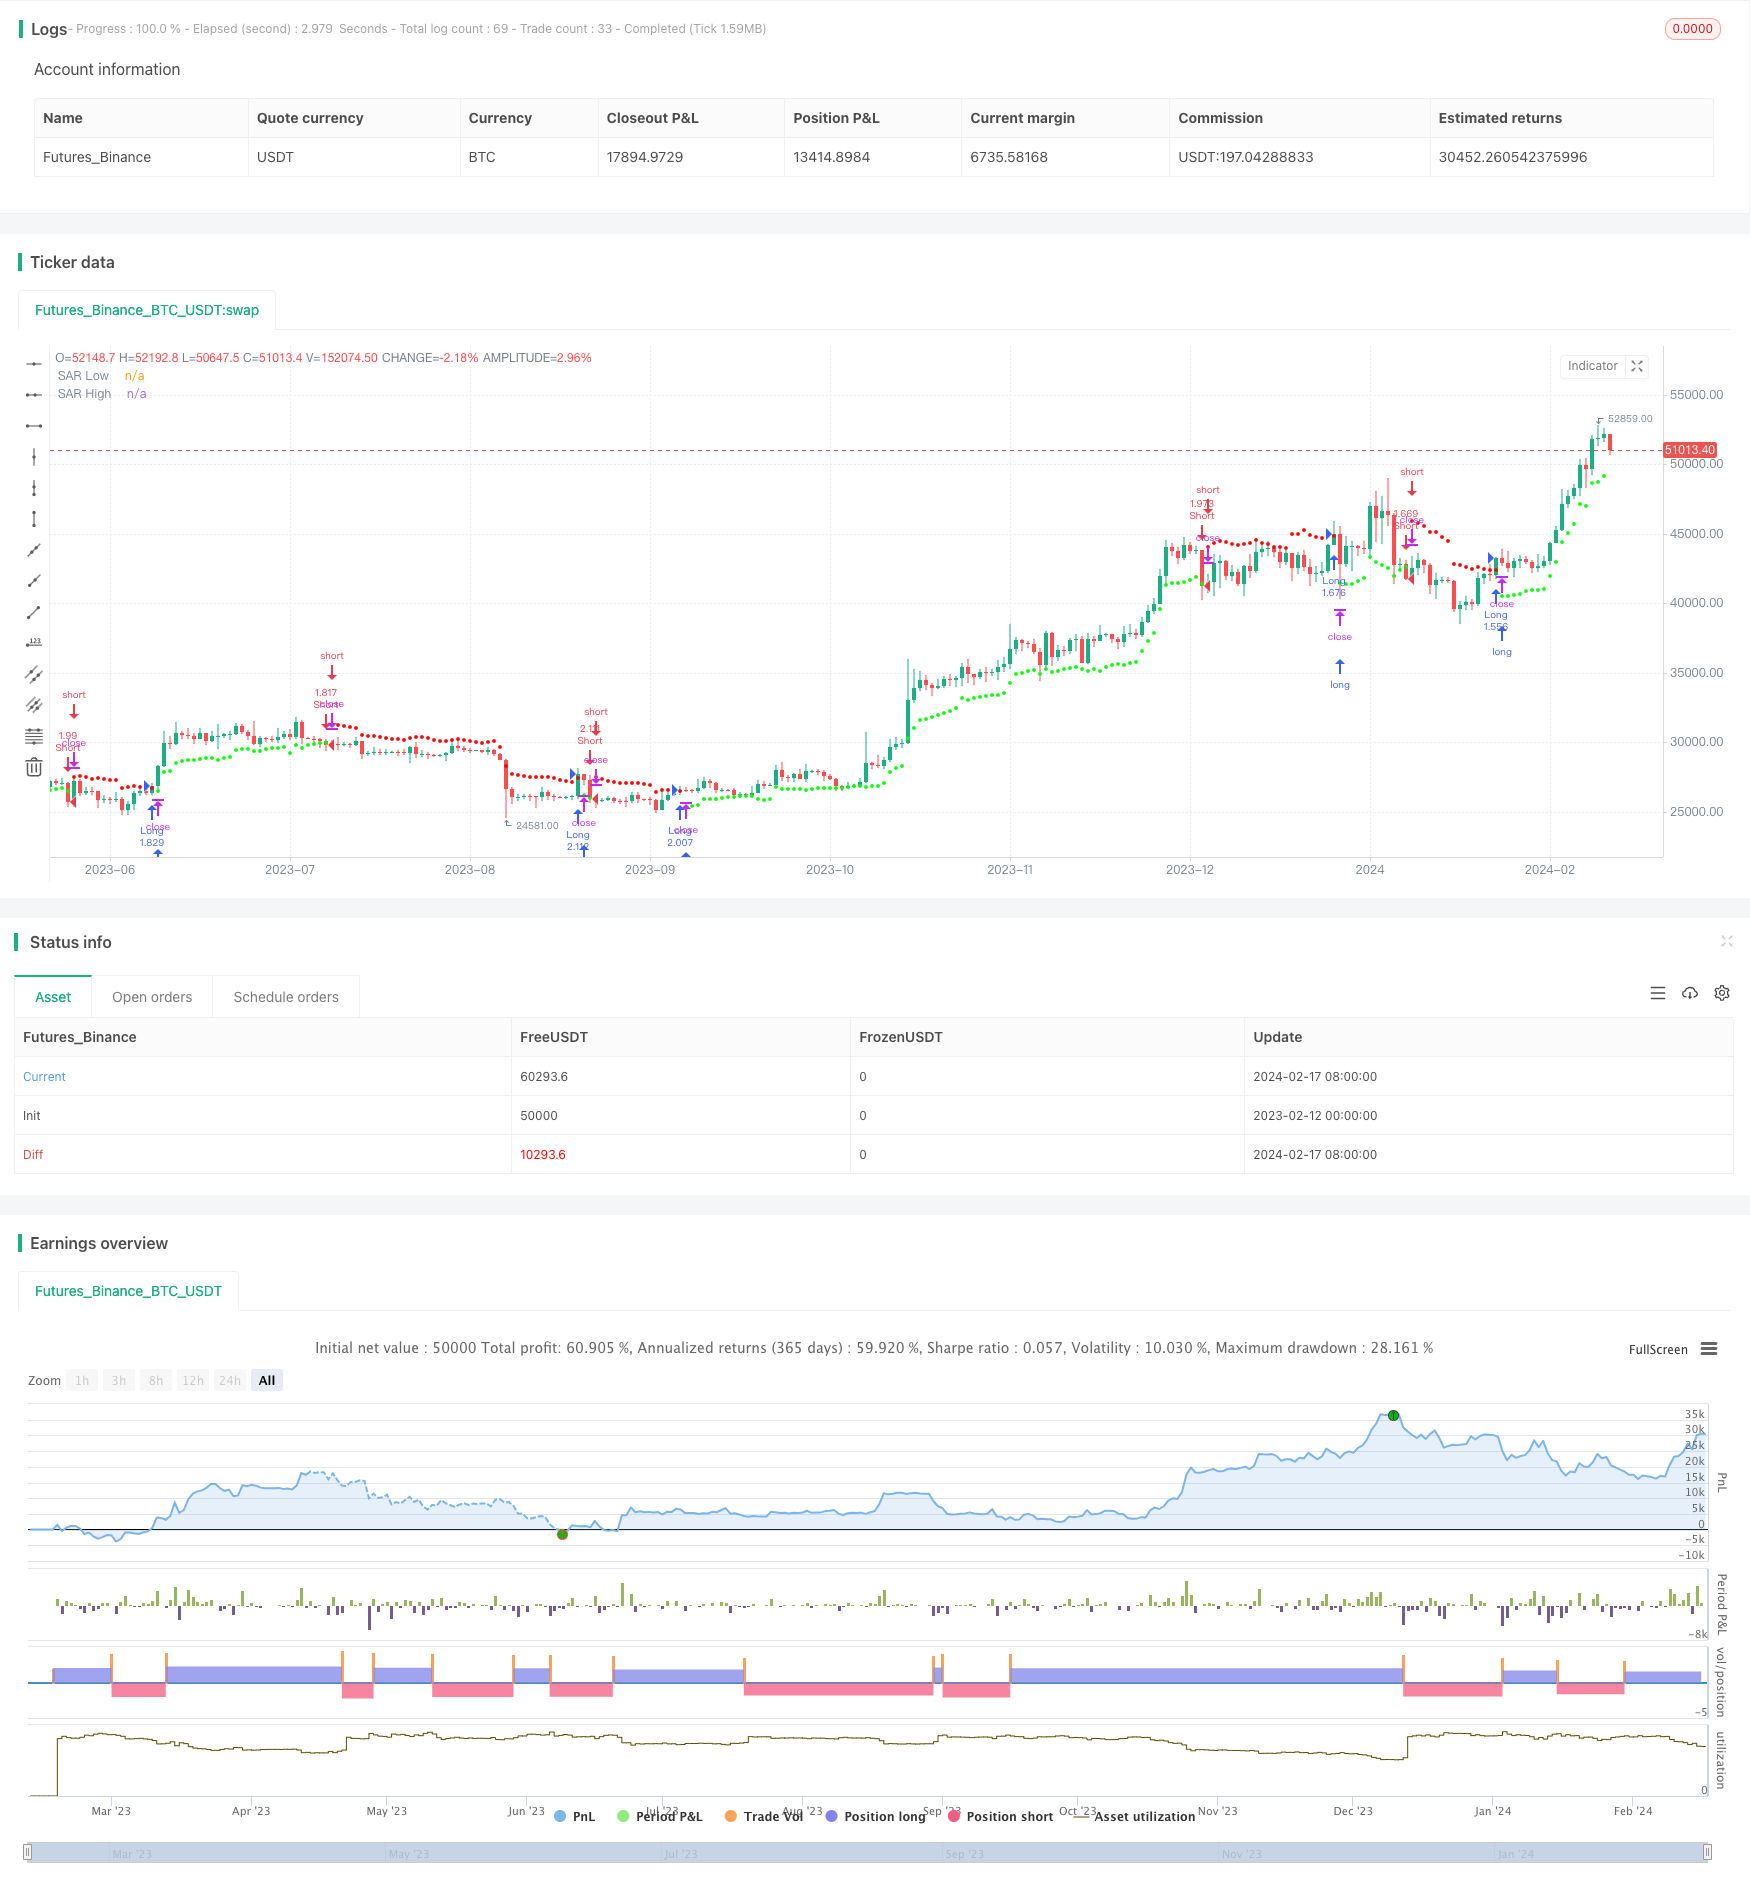
Стратегия торговли по прорыву канала

Обзор
Стратегия обратного трейдинга с прорывом канала - это стратегия обратного трейдинга с движущейся остановкой и убытком, которая отслеживает ценовой канал. Она рассчитывает ценовой канал с использованием взвешенного метода движущихся средних и создает многообещающие или пустые позиции при прорыве ценового канала.
Стратегический принцип
Эта стратегия сначала использует показатель Wilder Average True Range (ATR) для расчета частоты колебаний цен. Затем, исходя из значения ATR, вычисляется константа среднего диапазона (ARC). ARC - это половина ширины ценового канала. Затем вычисляются верхняя и нижняя полосы канала, то есть остановка и остановка, известная как точка SAR.
В частности, сначала вычислить ATR для последней N-корневой K-линии. Затем умножить ATR на коэффициент, чтобы получить ARC. ARC умножить на коэффициент, который может контролировать ширину канала. ARC, добавленный к N-корневой K-линии, получает верхнюю часть канала, то есть высокий SAR.
Стратегические преимущества
- Используя адаптивный канал для расчета ценовых колебаний, можно отслеживать изменения рынка
- Обратная торговля, подходящая для рынка с обратным трендом
- Мобильные стоп-стоп, блокирующие прибыль и контролирующие риск
Стратегический риск
- Обратная торговля легко поддается фиксации и требует соответствующих параметров.
- В условиях высокой волатильности рынка легко закрыть позицию
- Неправильные параметры приводят к слишком частым сделкам
Решение проблемы:
- Оптимизация циклов ATR и коэффициентов ARC для рационализации ширины каналов
- Фильтрация в сочетании с трендовыми индикаторами
- Увеличение циклов ATR и снижение частоты транзакций
Направление оптимизации стратегии
- Оптимизация циклов ATR и коэффициента ARC
- Условия для открытия позиции, например, в сочетании с индикатором MACD
- Увеличение стратегии по удержанию
Подвести итог
Стратегия прорыва в канале использует канал для отслеживания изменения цены, реверсивное создание позиции при усилении волатильности и установка адаптивного мобильного стоп-стоп. Эта стратегия применима к рынку, основанному на реверсии, и при условии точности определения точек обратного хода можно получить хорошую отдачу от инвестиций. Однако следует обратить внимание на то, чтобы предотвратить чрезмерную расслабление и оптимизацию параметров стоп-стоп.
/*backtest
start: 2023-02-12 00:00:00
end: 2024-02-18 00:00:00
period: 1d
basePeriod: 1h
exchanges: [{"eid":"Futures_Binance","currency":"BTC_USDT"}]
*/

//@version=3
//@author=LucF

// Volatility System [LucF]
// v1.0, 2019.04.14

// The Volatility System was created by Welles Wilder.
// It first appeared in his seminal masterpiece "New Concepts in Technical Trading Systems" (1978).
// He describes it on pp.23-26, in the chapter discussing the first presentation ever of the "Volatility Index",
// which later became known as ATR.
// Performance of the strategy usually increases with the time frame.
// Tuning of ATR length and, especially, the ARC factor, is key.

// This code runs as a strategy, which cannot generate alerts.
// If you want to use the alerts it must be converted to an indicator.
// To do so:
//      1. Swap the following 2 lines by commenting the first and uncommenting the second.
//      2. Comment out the last 4 lines containing the strategy() calls.
//      3. Save.
strategy(title="Volatility System by Wilder [LucF]", shorttitle="Volatility System [Strat]", overlay=true, precision=8, pyramiding=0, initial_capital=100000, default_qty_type=strategy.percent_of_equity, default_qty_value=100, commission_type=strategy.commission.percent, commission_value=0.1)
// study("Volatility System by Wilder [LucF]", shorttitle="Volatility System", precision=8, overlay=true)

// -------------- Colors
MyGreenRaw = color(#00FF00,0),      MyGreenMedium = color(#00FF00,50),  MyGreenDark = color(#00FF00,75),    MyGreenDarkDark = color(#00FF00,92)
MyRedRaw = color(#FF0000,0),        MyRedMedium = color(#FF0000,30),    MyRedDark = color(#FF0000,75),      MyRedDarkDark = color(#FF0000,90)

// -------------- Inputs
LongsOnly = input(false,"Longs only")
ShortsOnly = input(false,"Shorts only")
AtrLength = input(9, "ATR length", minval=2)
ArcFactor = input(1.8, "ARC factor", minval=0, type=float,step=0.1)
ShowSAR = input(false, "Show all SARs (Stop & Reverse)")
HideSAR = input(false, "Hide all SARs")
ShowTriggers = input(false, "Show Entry/Exit triggers")
ShowTradedBackground = input(false, "Show Traded Background")

FromYear  = input(defval = 2000,    title = "From Year", minval = 1900)
FromMonth = input(defval = 1,      title = "From Month", minval = 1, maxval = 12)
FromDay   = input(defval = 1,       title = "From Day", minval = 1, maxval = 31)
ToYear    = input(defval = 9999,    title = "To Year", minval = 1900)
ToMonth   = input(defval = 1,       title = "To Month", minval = 1, maxval = 12)
ToDay     = input(defval = 1,       title = "To Day", minval = 1, maxval = 31)

// -------------- Date range filtering
FromDate = timestamp(FromYear, FromMonth, FromDay, 00, 00)
ToDate = timestamp(ToYear, ToMonth, ToDay, 23, 59)
TradeDateIsAllowed() => true

// -------------- Calculate Stop & Reverse (SAR) points using Average Range Constant (ARC)
Arc   = atr(AtrLength)*ArcFactor
SarLo = highest(close, AtrLength)-Arc
SarHi = lowest(close, AtrLength)+Arc

// -------------- Entries/Exits
InLong = false
InShort = false
EnterLong = TradeDateIsAllowed() and not InLong[1] and crossover(close, SarHi[1])
EnterShort = TradeDateIsAllowed() and not InShort[1] and crossunder(close, SarLo[1])
InLong := (InLong[1] and not EnterShort[1]) or (EnterLong[1] and not ShortsOnly)
InShort := (InShort[1] and not EnterLong[1]) or (EnterShort[1] and not LongsOnly)

// -------------- Plots
// SAR points
plot( not HideSAR and ((InShort or EnterLong) or ShowSAR)? SarHi:na, color=MyRedMedium, style=circles, linewidth=2, title="SAR High")
plot( not HideSAR and ((InLong or EnterShort) or ShowSAR)? SarLo:na, color=MyGreenMedium, style=circles, linewidth=2, title="SAR Low")
// Entry/Exit markers
plotshape( ShowTriggers and not ShortsOnly and EnterLong, style=shape.triangleup, location=location.belowbar, color=MyGreenRaw, size=size.small, text="")
plotshape( ShowTriggers and not LongsOnly and EnterShort, style=shape.triangledown, location=location.abovebar, color=MyRedRaw, size=size.small, text="")
// Exits when printing only longs or shorts
plotshape( ShowTriggers and ShortsOnly and InShort[1] and EnterLong, style=shape.triangleup, location=location.belowbar, color=MyRedMedium, transp=70, size=size.small, text="")
plotshape( ShowTriggers and LongsOnly and InLong[1] and EnterShort, style=shape.triangledown, location=location.abovebar, color=MyGreenMedium, transp=70, size=size.small, text="")
// Background
bgcolor( color=ShowTradedBackground? InLong and not ShortsOnly?MyGreenDarkDark: InShort and not LongsOnly? MyRedDarkDark:na:na)

// ---------- Alerts
alertcondition( EnterLong or EnterShort, title="1. Reverse", message="Reverse")
alertcondition( EnterLong, title="2. Long", message="Long")
alertcondition( EnterShort, title="3. Short", message="Short")

// ---------- Strategy reversals
strategy.entry("Long", strategy.long, when=EnterLong and not ShortsOnly)
strategy.entry("Short", strategy.short, when=EnterShort  and not LongsOnly)
strategy.close("Short", when=EnterLong and ShortsOnly)
strategy.close("Long", when=EnterShort and LongsOnly)