ڈبل موونگ ایوریج کراس اوور ایرو اسٹریٹیجی

جائزہ
یہ حکمت عملی MACD اشارے کی دوہری مساوی لائن کراسنگ کا حساب کرکے خرید اور فروخت کا وقت طے کرتی ہے۔ یہ چارٹ پر تیر کی شکل میں ڈرائنگ کرتا ہے تاکہ ٹریڈنگ سگنل کو اشارہ کیا جاسکے۔
اصول
یہ حکمت عملی سب سے پہلے فوری لائن (ای ایم اے 12 ایڈیشن) ، سست لائن (ای ایم اے 26 ایڈیشن) اور MACD فرق کا حساب لگاتی ہے۔ اس کے بعد فوری لائن اور سست لائن کے گولڈ فورک اور MACD فرق کے مثبت اور منفی پر مبنی خرید و فروخت کے وقت کا تعین کرتی ہے۔
- ایک خرید سگنل کے طور پر جب ایک تیز لائن پر ایک سست لائن ((گولڈ فورک) ہے اور MACD فرق پر 0 ہے
- جب فاسٹ لائن کے نیچے سست لائن کو عبور کریں (ڈڈ فورک) اور MACD فرق کے نیچے 0 کو عبور کریں تو فروخت کرنے کا اشارہ کریں
جعلی سگنل کو فلٹر کرنے کے لئے ، کوڈ میں پچھلے K لائن کی سگنل کی صورتحال کا بھی فیصلہ کیا گیا ہے۔ موجودہ سگنل صرف اس وقت متحرک کیا جائے گا جب موجودہ K لائن الٹا سگنل ہے ((خریدنے کو فروخت میں تبدیل کیا گیا ہے یا فروخت کو خریدنے میں تبدیل کیا گیا ہے) ۔
اس کے علاوہ، اس کوڈ میں K لائن پر خرید و فروخت کے اوقات کے بارے میں اشارہ کرنے کے لئے ایک تیر کا گرافک بھی تیار کیا گیا ہے۔
فوائد
یہ حکمت عملی مندرجہ ذیل فوائد رکھتی ہے:
- دوہری مساوی کراس فیصلے کا استعمال کرتے ہوئے ، مارکیٹ کے شور کو مؤثر طریقے سے فلٹر کرنے اور رجحانات کی نشاندہی کرنے کے لئے
- ایم اے سی ڈی کے فرق سے متعلق فیصلے کے ساتھ ، نوٹ اور غلط فیصلے سے بچنے کے لئے
- جب آپ خریدنے یا بیچنے کے لئے اشارے دیتے ہیں تو آپ کو ایک تیر کے ساتھ اشارہ ملتا ہے۔
- قواعد سادہ اور واضح ہیں، آسانی سے سمجھنے اور نقل کرنے کے لئے
خطرات اور حل
اس حکمت عملی کے کچھ خطرات بھی ہیں:
- ڈبل میڈین لائن کراسنگ جھوٹے سگنل پیدا کرنے کے لئے آسان ہے ، جس کی وجہ سے ضرورت سے زیادہ تجارت ہوسکتی ہے۔ غلط سگنل کو کم کرنے کے لئے میڈین لائن پیرامیٹرز کو مناسب طریقے سے ایڈجسٹ کیا جاسکتا ہے یا فلٹرنگ کے دیگر شرائط شامل کی جاسکتی ہیں۔
- رجحانات میں ہلچل کا اندازہ لگانے میں ناکامی ، ممکنہ طور پر نقصانات کا سامنا کرنا پڑتا ہے۔ اس سے بچنے کے لئے رجحانات کے اشارے جیسے ADX کے ساتھ مل کر کام کیا جاسکتا ہے۔
- فکسڈ خرید و فروخت کی شرائط حکمت عملی کو میکانائز کرتی ہیں ، جو مارکیٹ میں تبدیلیوں کے مطابق نہیں رہ سکتی ہیں۔ آپ خود کار طریقے سے موافقت پذیر طریقوں کو بہتر بنانے کے لئے مشین لرننگ جیسے طریقوں کو آزما سکتے ہیں۔
اصلاح کی سمت
اس حکمت عملی کو مندرجہ ذیل طریقوں سے بہتر بنایا جاسکتا ہے:
- مختلف پیرامیٹرز کے مجموعے کو آزمائیں اور بہترین فاسٹ لائن ، سست لائن اور MACD پیرامیٹرز تلاش کریں
- داخلہ کی شرائط میں اضافہ ، جیسے ٹریڈنگ کی مقدار میں اضافے سے سگنل فلٹر ہوجاتے ہیں
- نقصانات کو کنٹرول کرنے کے لئے روک تھام کا طریقہ کار میں اضافہ
- VIX جیسے اتار چڑھاؤ کے اشارے کے ساتھ مل کر خطرے کی ترجیحات کا اندازہ لگائیں
- مشین لرننگ ماڈل کو فکسڈ قواعد کی جگہ لے کر حکمت عملیوں کی موافقت کو بہتر بنانے کی کوشش کرنا
خلاصہ کریں۔
یہ دوہری یکساں کراس تیر حکمت عملی مجموعی طور پر نسبتا simple آسان اور عملی ہے ، دوہری یکساں کراس فیصلے اور MACD فرق فلٹرنگ کے ذریعہ ، وسط لمبی لائن رجحان میں خرید و فروخت کے مقامات کی شناخت کی جاسکتی ہے ، قیمتوں میں ہونے والی تبدیلیوں سے بچنے سے بچنے کے لئے۔ تیر اشارے بھی آپریشن کو زیادہ واضح اور واضح بناتے ہیں۔ بعد میں پیرامیٹرز کو بہتر بنانے ، فلٹرنگ کے حالات میں اضافہ کرنے وغیرہ کے ذریعہ حکمت عملی کی استحکام اور منافع کو مزید بڑھا سکتے ہیں۔
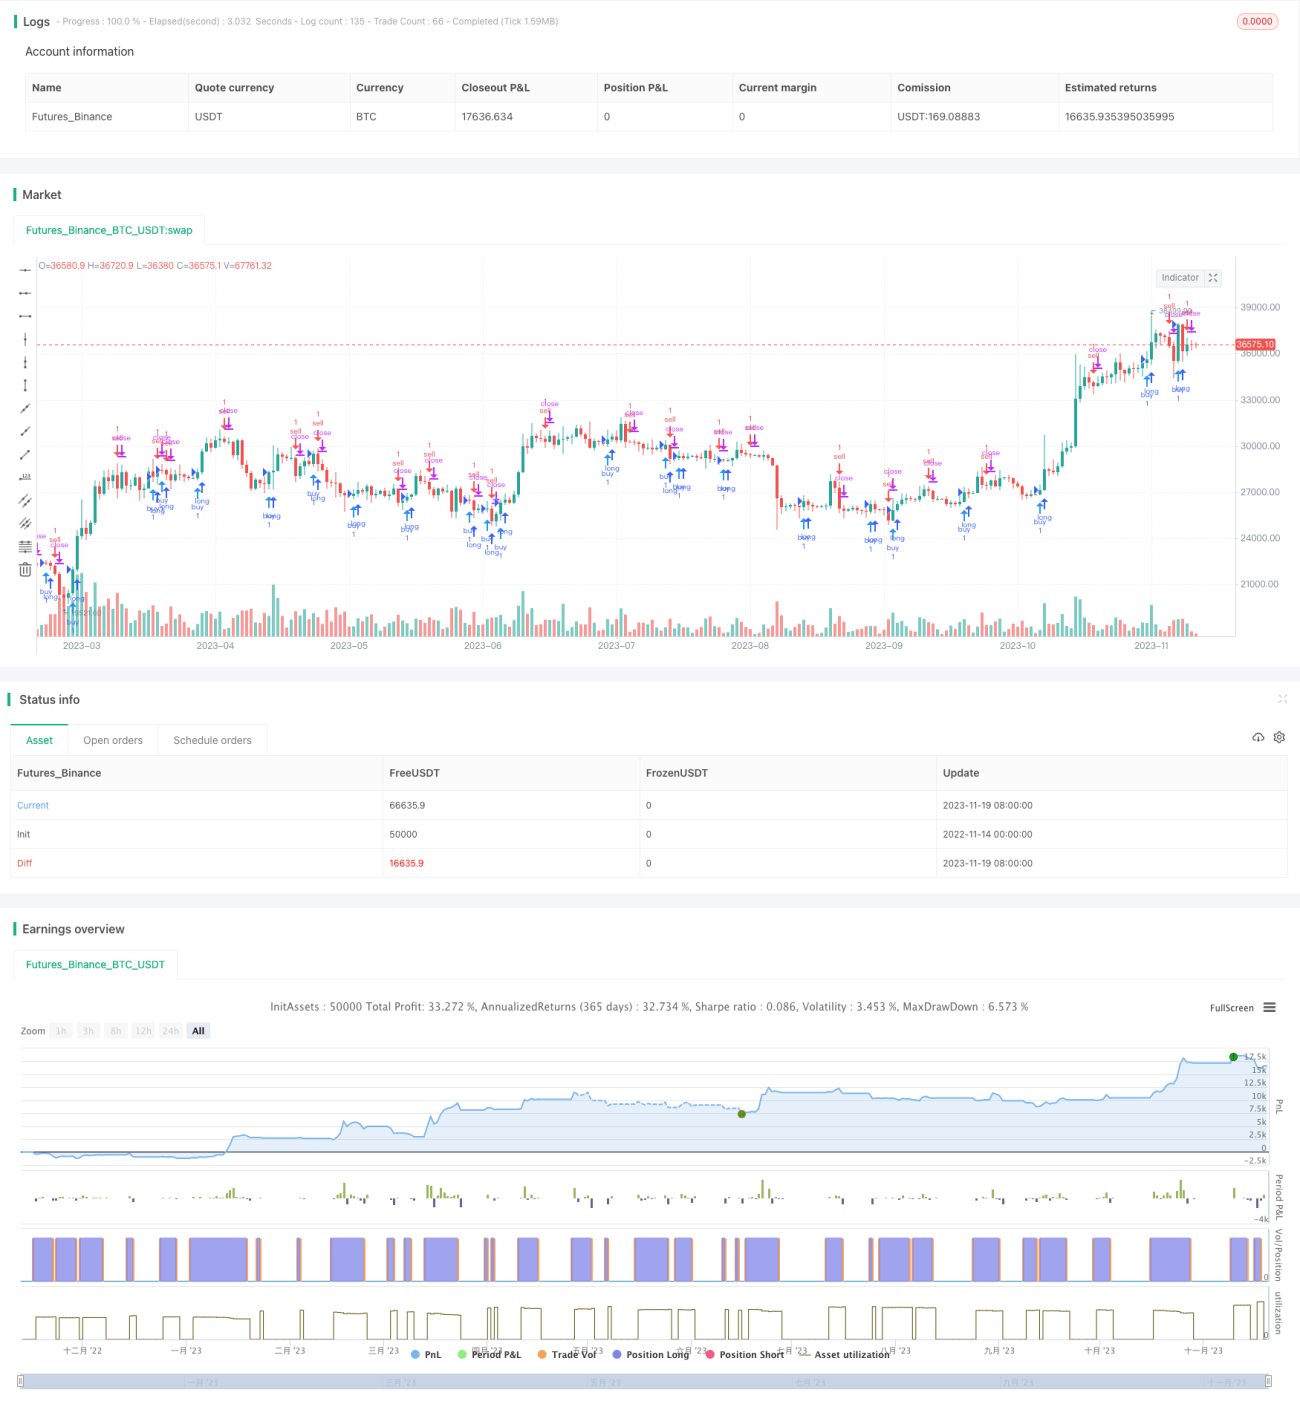
/*backtest
start: 2022-11-14 00:00:00
end: 2023-11-20 00:00:00
period: 1d
basePeriod: 1h
exchanges: [{"eid":"Futures_Binance","currency":"BTC_USDT"}]
*/

//@version=3
//Daniels stolen code
strategy(shorttitle="Daniels Stolen Code", title="Daniels Stolen Code", overlay=true, calc_on_order_fills=true, pyramiding=0)
- 1