ٹرینڈ بریک تھرو ڈبل موونگ ایوریج فلٹر کی حکمت عملی

جائزہ
یہ ایک ایسی حکمت عملی ہے جو رجحان کا فیصلہ کرنے کے لئے مساوی لائن اور برلن چینل کا استعمال کرتی ہے اور اس میں فلٹرنگ اور اسٹاپ نقصان کے اصولوں کو توڑنے کے ساتھ ملتی ہے۔ یہ رجحان میں تبدیلی کے وقت سگنل کو بروقت پکڑ سکتا ہے ، غلط سگنل کو کم کرنے کے لئے ڈبل مساوی لائن فلٹرنگ کے ذریعہ ، اور خطرے کو کنٹرول کرنے کے لئے اسٹاپ نقصان کی ترتیب دے سکتا ہے۔
حکمت عملی کا اصول
اس حکمت عملی میں مندرجہ ذیل اجزاء شامل ہیں:
-
رجحانات کا تعین: قیمتوں کے رجحانات کا تعین کرنے کے لئے MACD کا استعمال کریں ، کثیر اور خالی سر کے رجحانات میں فرق کریں۔
-
رینج فلٹرنگ: قیمتوں میں اتار چڑھاو کی حد کا تعین کرنے کے لئے برلن چینل کا استعمال کریں ، اور حد سے تجاوز نہ کرنے والے سگنل کو فلٹر کریں۔
-
ڈبل میڈین لائن کی تصدیق: تیز رفتار ای ایم اے اور سست رفتار ای ایم اے پر مشتمل ڈبل میڈین لائن ، جو رجحان سگنل کی تصدیق کے لئے استعمال ہوتی ہے۔ خریداری کا سگنل صرف اس وقت پیدا ہوتا ہے جب تیز رفتار ای ایم اے> سست رفتار ای ایم اے ہو۔
-
اسٹاپ نقصان کا طریقہ کار: اسٹاپ نقصان کا مقام طے کریں ، اور جب قیمت منفی سمت میں اسٹاپ نقصان کے مقام کو توڑ دیتی ہے تو اس کی پوزیشن بند کردیں۔
اس کے علاوہ ، یہ بھی کہا گیا ہے کہ:
- MACD اوپر کی طرف بڑھ رہا ہے
- قیمتوں میں بلین چینل کو توڑنے کی کوشش
- تیز EMA سست EMA سے زیادہ ہے
جب مذکورہ بالا تینوں شرائط ایک ساتھ ملیں تو خریدنے کا سگنل پیدا ہوتا ہے۔
فلیٹ پوزیشن کی منطق دو طرح کی ہوتی ہے ، فلیٹ پوزیشن کو روکنا اور فلیٹ پوزیشن کو روکنا۔ فلیٹ پوزیشن کو روکنے کے لئے داخلے کی قیمت کو ایک خاص تناسب سے ضرب دیا جاتا ہے ، اور فلیٹ پوزیشن کو داخلے کی قیمت کے لئے ایک خاص تناسب سے ضرب دیا جاتا ہے۔ جب قیمت ان میں سے کسی ایک نقطہ کو توڑ دیتی ہے۔ فلیٹ پوزیشن
طاقت کا تجزیہ
یہ حکمت عملی مندرجہ ذیل فوائد رکھتی ہے۔
- ٹرینڈ کی تبدیلیوں کو وقت پر پکڑنے کے لئے ، کم ٹریس بیک۔
- ڈبل مساوی فلٹر غلط سگنل کے ذریعے سگنل کے معیار کو بہتر بنانے کے لئے.
- نقصانات کو روکنے کا طریقہ کار انفرادی نقصانات کو مؤثر طریقے سے کنٹرول کرتا ہے۔
- پیرامیٹرز کو بہتر بنانے کے لئے کافی جگہ ہے ، اور اسے بہترین حالت میں ایڈجسٹ کیا جاسکتا ہے۔
خطرے کا تجزیہ
اس حکمت عملی کے کچھ خطرات بھی ہیں:
- زلزلے کے دوران پیدا ہونے والے غلط سگنل نقصان کا سبب بن سکتے ہیں۔
- اسٹاپ نقصان کی غلط ترتیب غیر ضروری نقصان کا سبب بن سکتی ہے۔
- غلط پیرامیٹرز کی وجہ سے حکمت عملی کی کارکردگی خراب ہوسکتی ہے۔
ان خطرات کے لئے ، آپ کو پیرامیٹرز کو بہتر بنانے ، اسٹاپ نقصان کی پوزیشن کو ایڈجسٹ کرنے وغیرہ کے ذریعہ اصلاح اور بہتری لائی جاسکتی ہے۔
اصلاح کی سمت
اس حکمت عملی کو مندرجہ ذیل طریقوں سے بہتر بنایا جاسکتا ہے:
- بہترین پیرامیٹرز کا مجموعہ تلاش کرنے کے لئے ڈبل مساوی لائن کی لمبائی کو ایڈجسٹ کریں۔
- نقصانات کو روکنے کے مختلف طریقوں کی جانچ کریں ، جیسے نقصانات کا سراغ لگانا ، جھٹکا نقصان وغیرہ۔
- MACD پیرامیٹرز کو جانچنے کے لئے بہترین پیرامیٹرز تلاش کریں۔
- مشین لرننگ کا استعمال کرتے ہوئے پیرامیٹرز کو خودکار طور پر بہتر بنانا۔
- اضافی مشروط فلٹرنگ سگنل شامل کریں۔
مختلف پیرامیٹرز کی ترتیبات کی جانچ پڑتال کرکے ، منافع اور شارپ تناسب کا اندازہ لگایا جاسکتا ہے تاکہ اس حکمت عملی کی بہترین حالت کا پتہ لگایا جاسکے۔
خلاصہ کریں۔
یہ ایک مقداری حکمت عملی ہے جو رجحانات کا اندازہ لگانے ، رینج فلٹرنگ ، ڈبل مساوی لائن کی تصدیق اور اسٹاپ نقصان کی سوچ کا استعمال کرتی ہے۔ یہ رجحانات کی سمت کا مؤثر انداز میں اندازہ لگانے اور منافع کو زیادہ سے زیادہ بنانے اور خطرے کو کنٹرول کرنے کے مابین توازن تلاش کرنے کے قابل ہے۔ اس حکمت عملی میں بہتری کی گنجائش ہے ، جس میں پیرامیٹرز کی اصلاح اور مشین لرننگ وغیرہ کے ذریعہ بہتری کی گنجائش ہے۔
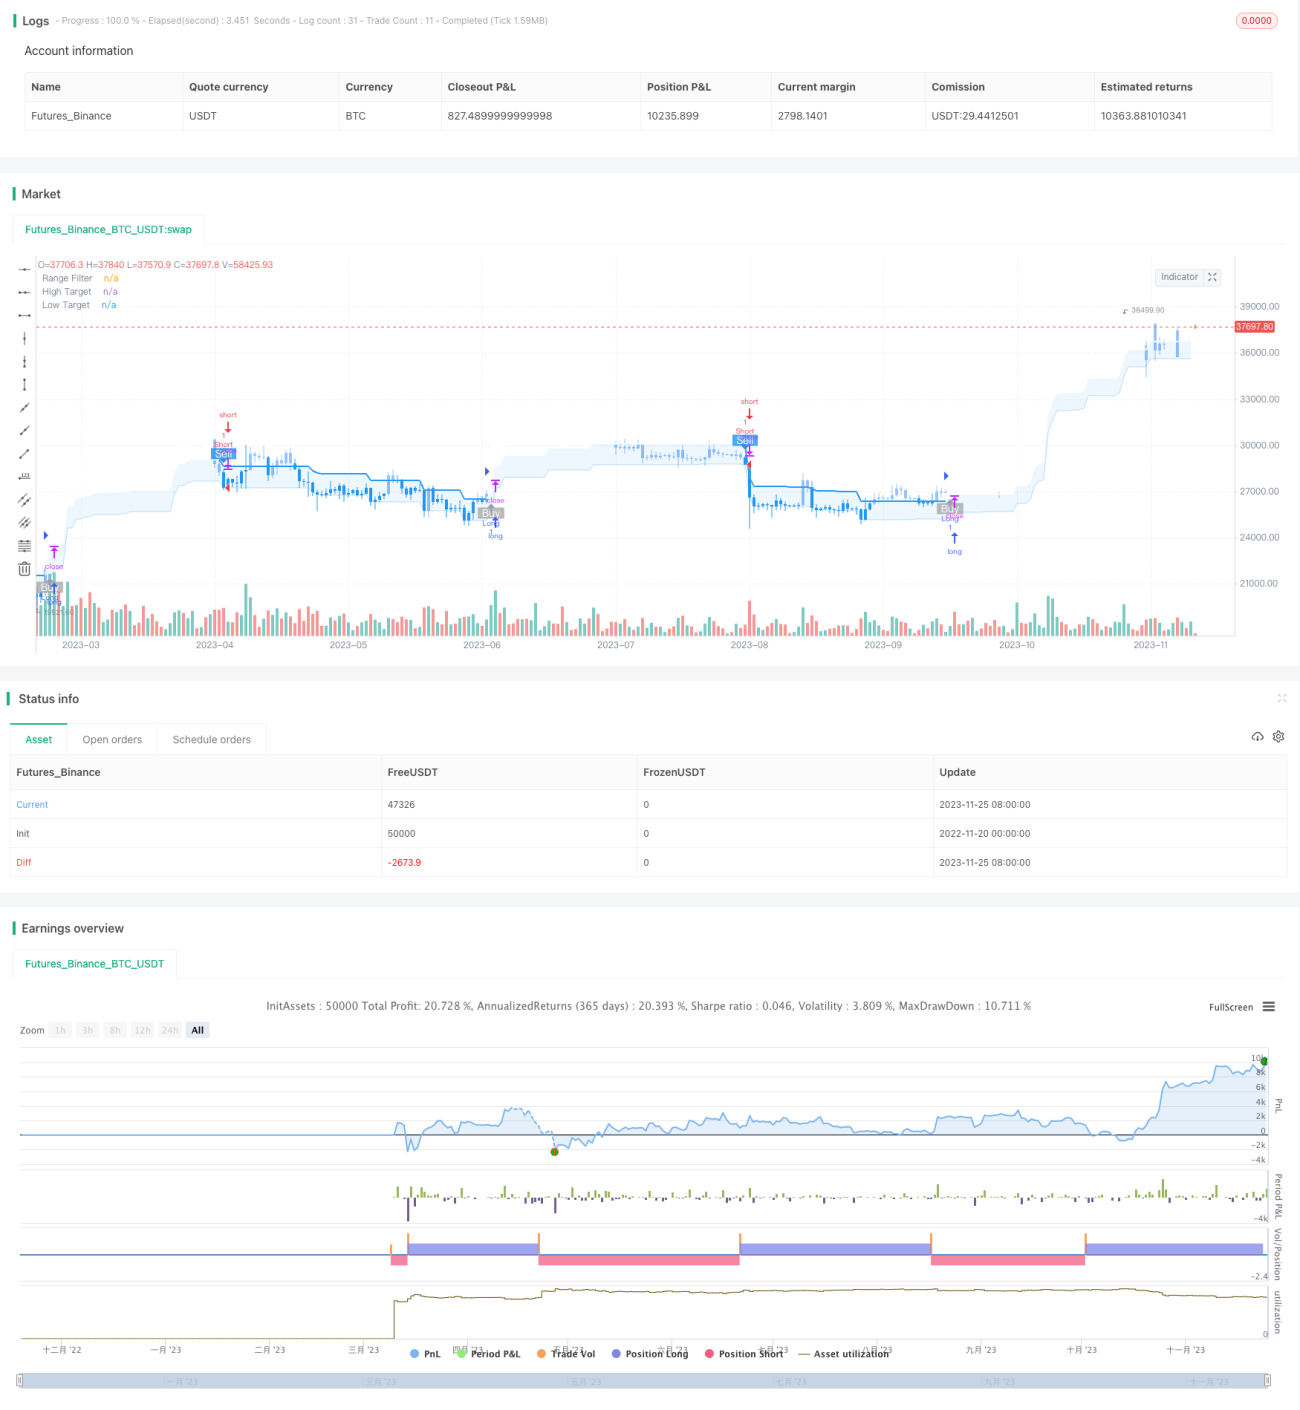
/*backtest
start: 2022-11-20 00:00:00
end: 2023-11-26 00:00:00
period: 1d
basePeriod: 1h
exchanges: [{"eid":"Futures_Binance","currency":"BTC_USDT"}]
*/

//@version=5
strategy(title="Range Filter Buy and Sell Strategies", shorttitle="Range Filter Strategies", overlay=true,pyramiding = 5)

// Original Script > @DonovanWall- 1