مہینے کے آخر کی رفتار 200 دن کی موونگ ایوریج حکمت عملی کے ذریعے ٹوٹ جاتی ہے۔

1
Follow
1779
Followers
جائزہ
اس حکمت عملی کا مقصد اسٹاک کی قیمتوں کے رجحان کی سمت کو پکڑنے کے لئے یہ فیصلہ کرنا ہے کہ آیا اسٹاک کی قیمتیں 200 دن کی اوسط اوسط سے تجاوز کرتی ہیں یا نہیں۔ جب قیمتیں 200 دن کی اوسط سے تجاوز کرتی ہیں تو ایک سے زیادہ پوزیشن قائم کریں ، ورنہ اسٹاک کو صاف کریں۔
حکمت عملی کا اصول
- قیمتوں کے رجحانات کا اندازہ لگانے کے لئے 200 دن کی سادہ حرکت پذیری اوسط dma200 کا استعمال کرنا
- ہر مہینے کے آخری ٹریڈنگ دن ، اس بات کا تعین کریں کہ آیا اس دن کے اختتامی قیمت 200 ڈی ایم اے سے زیادہ ہے یا نہیں
- اگر اختتامی قیمت 200 دن کی اوسط سے تجاوز کر جاتی ہے تو ، اگلے ٹریڈنگ دن کے آغاز پر ایک مکمل پوزیشن قائم کریں
- اگر اختتامی قیمت 200 دن کی اوسط سے نیچے آجاتی ہے تو ، اگلے تجارتی دن میں صفائی کی جائے گی
- اس طرح ، رجحانات کی پیروی کرنے کا اثر حاصل کیا جاسکتا ہے ، جب اسٹاک کی قیمتیں بڑھتی ہوئی رجحان میں داخل ہوتی ہیں تو پوزیشن بنائی جاتی ہے ، اور گرنے سے بچ جاتی ہے۔
طاقت کا تجزیہ
- حکمت عملی کی طاقت اس میں ہے کہ یہ سادہ اور موثر ہے اور اسے سمجھنا اور اس پر عمل درآمد کرنا آسان ہے۔
- اختتام ہفتہ کے اختتام پر پوائنٹس کی تعمیر کا استعمال کرتے ہوئے، آپ کو ٹریڈنگ کی تعدد کو کم کرنے، ٹریڈنگ کی لاگت کو کم کرنے اور پوائنٹس پر اثر انداز کرنے میں مدد ملتی ہے.
- 200 دن کی اوسط لائن ایک بہت ہی عام طور پر استعمال ہونے والا درمیانی اور طویل مدتی رجحانات کا اندازہ لگانے والا اشارے ہے ، جو زیادہ تر اسٹاک کے لئے موزوں ہے۔
- اسٹریٹجک ریٹائرمنٹ اور زیادہ سے زیادہ کمی کم ہے، خطرے کو کنٹرول کیا جا سکتا ہے
خطرے کا تجزیہ
- 200 دن کی اوسط لائن کچھ اسٹاک کے ل enough اتنی حساس نہیں ہوسکتی ہے کہ وہ قیمتوں میں تبدیلی کو وقت پر پکڑ نہ سکے
- مہینے کے آخر میں صرف ایک ہی ٹریڈنگ پوائنٹ نے پوزیشن بنائی ، وسط میں گرنے کا موقع ضائع ہوسکتا ہے
- جب بڑے پیمانے پر مجموعی رجحانات غیر یقینی ہیں تو یہ حکمت عملی درست نہیں ہوسکتی ہے
- ان خطرات کو کم کرنے کے لئے دوسرے اشارے کے ساتھ مل کر کیا جانا چاہئے
اصلاح کی سمت
- مہینے کے آغاز یا وسط میں اسٹورز کی تعداد میں اضافے پر غور کریں تاکہ حکمت عملی کی تعدد میں اضافہ کیا جاسکے
- قیمتوں کے اتار چڑھاؤ کا اندازہ لگانے کے لئے برن بینڈ جیسے اشارے شامل کریں تاکہ غلط تجارت سے بچا جاسکے
مختلف اسٹاک کے لئے مختلف مساوی پیرامیٹرز کی مطابقت کا اندازہ لگانا ، بہترین پیرامیٹرز کا مجموعہ تلاش کرنا - ایک متحرک پوزیشن مینجمنٹ میکانزم قائم کیا جاسکتا ہے ، جس میں جب زیادہ سے زیادہ واپس لیا جاتا ہے تو نقصان کو فعال طور پر روک دیا جاتا ہے۔
خلاصہ کریں۔
یہ حکمت عملی مجموعی طور پر آسان اور عملی ہے ، اور اسٹاک کی درمیانی اور طویل مدتی قیمتوں کے رجحانات کو مؤثر طریقے سے پکڑنے کے لئے اختتام کے آخر میں 200 دن کی اوسط لائن کو توڑنے کے ذریعہ ، پیچھے ہٹنا اور کم خطرہ ہے۔ مزید اشارے کے فیصلے اور متحرک اصلاح کے ساتھ مل کر ، حکمت عملی کی استحکام اور منافع کی شرح کو مزید بڑھاوا دیا جاسکتا ہے۔
Source
Pine
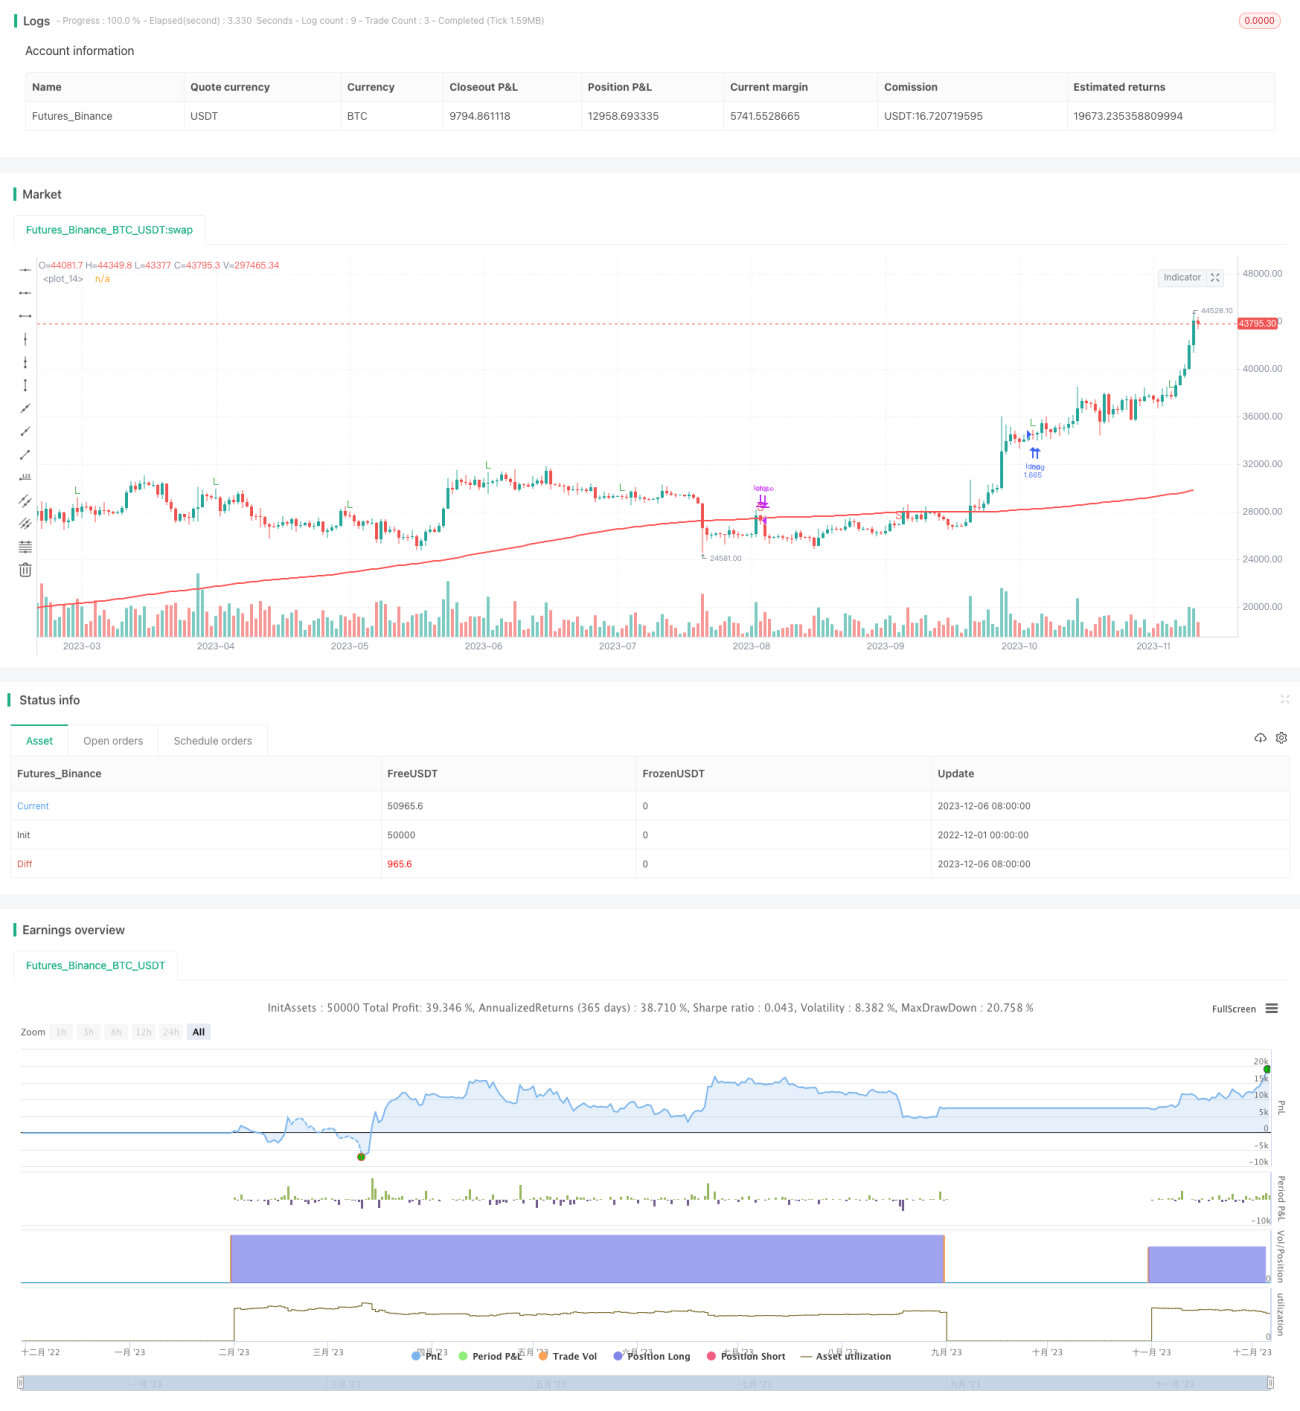
/*backtest
start: 2022-12-01 00:00:00
end: 2023-12-07 00:00:00
period: 1d
basePeriod: 1h
exchanges: [{"eid":"Futures_Binance","currency":"BTC_USDT"}]
*/

// This source code is subject to the terms of the Mozilla Public License 2.0 at https://mozilla.org/MPL/2.0/
// © muscleriot
//200 dma
//2000-2016 backtested Strategy parameters
Related strategies
Comment
All comments (0)
No data
- 1