Chiến lược giao dịch tự động RSI Long-Short

Tổng quan
Chiến lược này được thiết kế dựa trên chỉ số tương đối mạnh (RSI) để thiết kế một hệ thống giao dịch tự động đa tháo. Nó có thể tự động phát tín hiệu đa tháo để tự động giao dịch khi RSI đạt đến vùng quá mua quá bán.
Nguyên tắc chiến lược
Chiến lược này được tính toán bằng cách tính toán các biến động của cổ phiếu trong một chu kỳ nhất định, để có được các giá trị RSI trong khoảng 0-100. Khi RSI thấp hơn 30 là quá bán và cao hơn 70 là quá mua. Theo quy tắc này, chiến lược tự động tăng khi RSI đạt đến vùng quá bán và tự động giảm khi đạt đến vùng quá mua.
Cụ thể, chiến lược đầu tiên tính toán giá trị RSI của 15 chu kỳ. Khi RSI giảm xuống dưới 20, được coi là bán tháo, khi phá vỡ đường trung bình di chuyển 200 ngày, mua thêm. Khi RSI tăng lên trên 80, được coi là mua quá mức, khi mua thêm.
Ngoài ra, chiến lược này cũng vẽ các đường đánh dấu và thẻ liên quan khi tín hiệu giá xảy ra, giúp tín hiệu giao dịch trực quan hơn.
Lợi thế chiến lược
- Kế hoạch chiến lược rõ ràng, đơn giản, dễ hiểu và thực hiện
- Xác định chính xác tình trạng mua quá mức dựa trên chỉ số RSI
- Giao dịch hoàn toàn tự động, không cần sự can thiệp của con người
- Thiết lập Stop Loss, kiểm soát rủi ro hiệu quả
- Tín hiệu giao dịch trực quan, dễ theo dõi
Rủi ro chiến lược
- Chỉ số RSI có một số điểm chậm, có thể gây ra sai sót
- Mức giới hạn bán tháo cố định không áp dụng cho tất cả các giống
- Thiết lập điểm dừng không phù hợp có thể gây ra tổn thất lớn
- Thị trường có xu hướng có thể bị mất mát khi giảm giá nhiều hơn
Các biện pháp kiểm soát rủi ro bao gồm: tối ưu hóa các tham số RSI, điều chỉnh ngưỡng mua bán tháo lỏng cho các loại khác nhau, thiết lập điểm dừng lỗ hợp lý, kết hợp với các chỉ số xu hướng để tránh giao dịch ngược.
Hướng tối ưu hóa chiến lược
- Tối ưu hóa các tham số RSI để tăng độ chính xác trong việc đánh giá quá mua quá bán
- Kết hợp với các chỉ số khác để xác nhận tín hiệu giao dịch, chẳng hạn như KDJ, MACD, vv
- Thiết lập điểm dừng tối ưu hóa theo tình hình thị trường
- Tăng khả năng đánh giá xu hướng, tránh hành động ngược
- Thiết lập đường cong quyền lợi theo dõi dừng lỗ
- Phát triển mô-đun kiểm soát gió để kiểm soát rủi ro đơn lẻ và tổng thể
Tóm tắt
Chiến lược này nói chung là một chiến lược giao dịch tự động sử dụng chỉ số RSI để đánh giá quá mua quá bán. Nó phát ra tín hiệu giao dịch khi RSI đạt đến vùng cực đoan quá mua quá bán và có thể tự động thực hiện giao dịch. Ý tưởng của chiến lược đơn giản, rõ ràng, dễ thực hiện và phù hợp với chiến lược cơ bản của giao dịch tự động.
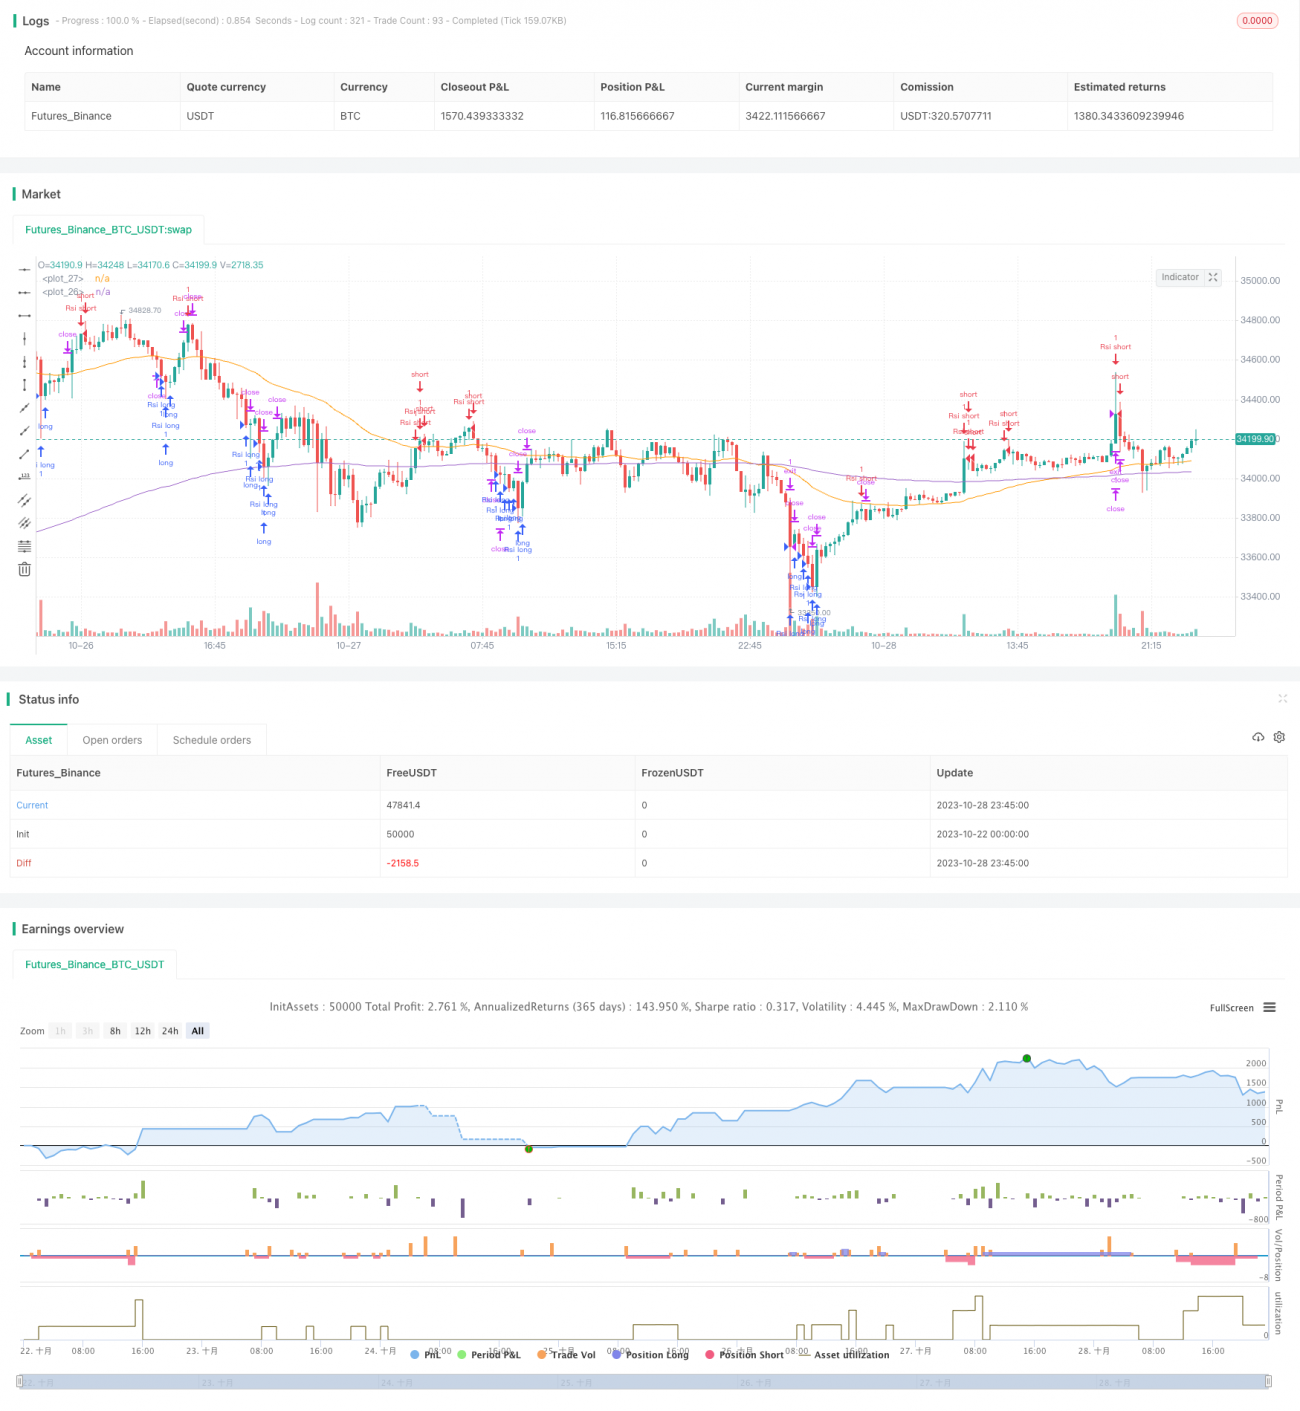
/*backtest
start: 2023-10-22 00:00:00
end: 2023-10-29 00:00:00
period: 15m
basePeriod: 5m
exchanges: [{"eid":"Futures_Binance","currency":"BTC_USDT"}]
*/

//@version=5
strategy("RSI Improved strategy", overlay=true)
higherTF1 = input.timeframe('15' , "Resolution", options = ['5', '15', '1H', 'D', 'W', 'M'])
dailyopen = request.security(syminfo.tickerid, higherTF1, close)- 1