Chỉ báo độ lệch xu hướng K-line kết hợp với chiến lược sóng trung bình động

Tổng quan
Chiến lược này tính toán xu hướng của giá lệch khỏi chỉ số TSI, sau đó xử lý moving average của TSI để tạo ra moving average của chỉ số TSI. Kết hợp với hướng đường K của giá, xác định giá cổ phiếu hiện đang trong xu hướng tăng hoặc xu hướng giảm, tạo ra tín hiệu mua và bán.
Nguyên tắc
Chiến lược này bao gồm một số bước:
- Tính toán thay đổi giá pct
- Phương pháp làm mịn HMA kép cho pct tạo ra double_smoothed_pc
- Tính toán HMA kép của giá trị tuyệt đối của pct, nhận được double_smoothed_abs_pc
- Tính toán giá trị của TSI: 100*(double_smoothed_pc / double_smoothed_abs_pc))
- Trao giá trị TSI với trung bình di chuyển HMA để có được trung bình di chuyển của TSI tsihmaline
- So sánh mối quan hệ giữa giá trị TSI và trung bình di chuyển TSI, xu hướng tăng khi giá trị TSI cao hơn trung bình di chuyển, xu hướng giảm khi giá trị TSI thấp hơn trung bình di chuyển
- Trong xu hướng tăng, nếu giá cả cũng tăng, nó sẽ tạo ra một tín hiệu mua
- Trong một xu hướng giảm, nếu giá cả cũng đang giảm, nó sẽ tạo ra một tín hiệu bán
Thông qua các bước trên, bạn có thể xác định hướng của xu hướng tổng thể hiện tại, kết hợp với xu hướng thực tế của giá, tạo ra tín hiệu giao dịch.
Ưu điểm
- Dual HMA xử lý trơn tru, có thể lọc hiệu quả tiếng ồn ngắn hạn, khóa xu hướng chính
- TSI kết hợp với đường trung bình di chuyển của nó để xác định xu hướng tổng thể
- Kết hợp hướng đường K của giá, tránh phá vỡ giả, tăng độ tin cậy của tín hiệu
- Các tham số có thể điều chỉnh, có thể điều chỉnh các tham số mịn theo thị trường, thích ứng với các chu kỳ khác nhau
- Hình đồ thị trực quan, màu xanh lá cây là xu hướng tăng, màu đỏ là xu hướng giảm
Rủi ro
- Trong trường hợp xảy ra chấn động, nó sẽ tạo ra nhiều tín hiệu sai.
- Điểm chuyển hướng, trung bình di chuyển bị trễ, có thể bỏ lỡ điểm vào tốt nhất
- Cần phải điều chỉnh các tham số thường xuyên để thích ứng với sự thay đổi của thị trường
- Chiến lược này chỉ dựa trên chỉ số TSI đơn lẻ và có thể được tối ưu hóa với các chỉ số khác
Hướng tối ưu hóa
- Có thể thêm bộ lọc để tránh tín hiệu sai của thị trường rung động
- Các chỉ số khác có thể được thêm vào để xác nhận điểm thay đổi xu hướng.
- Các tham số có thể được tự động tối ưu hóa thông qua các phương pháp như học máy
- Có thể đưa ra chiến lược dừng lỗ để kiểm soát tổn thất đơn lẻ
Tóm tắt
Chiến lược này sử dụng chỉ số TSI để xác định hướng xu hướng và kết hợp với đường K của giá để tạo ra tín hiệu giao dịch, có thể nắm bắt xu hướng một cách hiệu quả, mua xu hướng tăng và bán xu hướng giảm. Tuy nhiên, cũng có một số rủi ro cần được tối ưu hóa để tăng sự ổn định. Nhìn chung, chiến lược này dễ hiểu trực quan và phù hợp cho các nhà giao dịch quen thuộc với các chỉ số kỹ thuật.
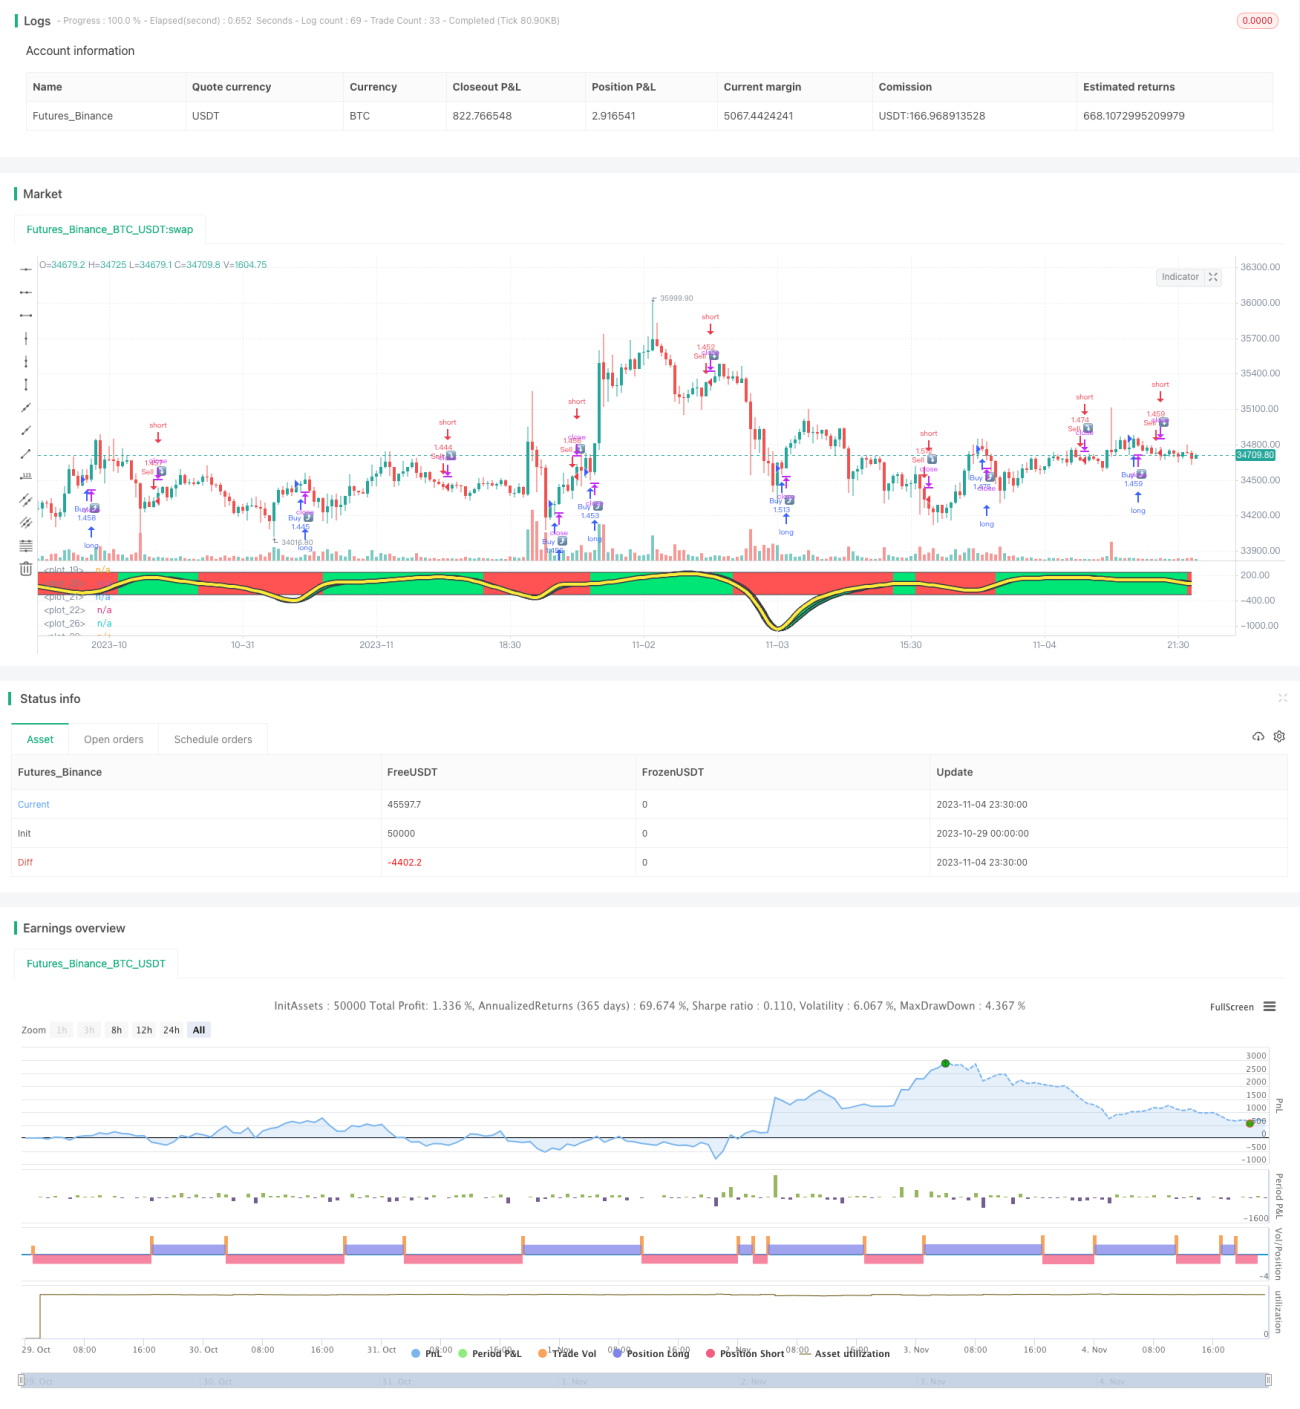
/*backtest
start: 2023-10-29 00:00:00
end: 2023-11-05 00:00:00
period: 30m
basePeriod: 15m
exchanges: [{"eid":"Futures_Binance","currency":"BTC_USDT"}]
*/

//@version=4
strategy(title="TSIHULLBOT", shorttitle="TSICCIHULL", default_qty_type=strategy.percent_of_equity, default_qty_value=100)
long = input(title="Long Length", type=input.integer, defval=50)
short = input(title="Short Length", type=input.integer, defval=50)- 1