Chiến lược đột phá biến động động


Ngày tạo: 2023-11-13 11:26:50 sửa đổi lần cuối: 2023-11-13 11:26:50
sao chép: 1 Số nhấp chuột: 754
1
tập trung vào
1621
Người theo dõi

Chiến lược đột phá biến động động

Tổng quan

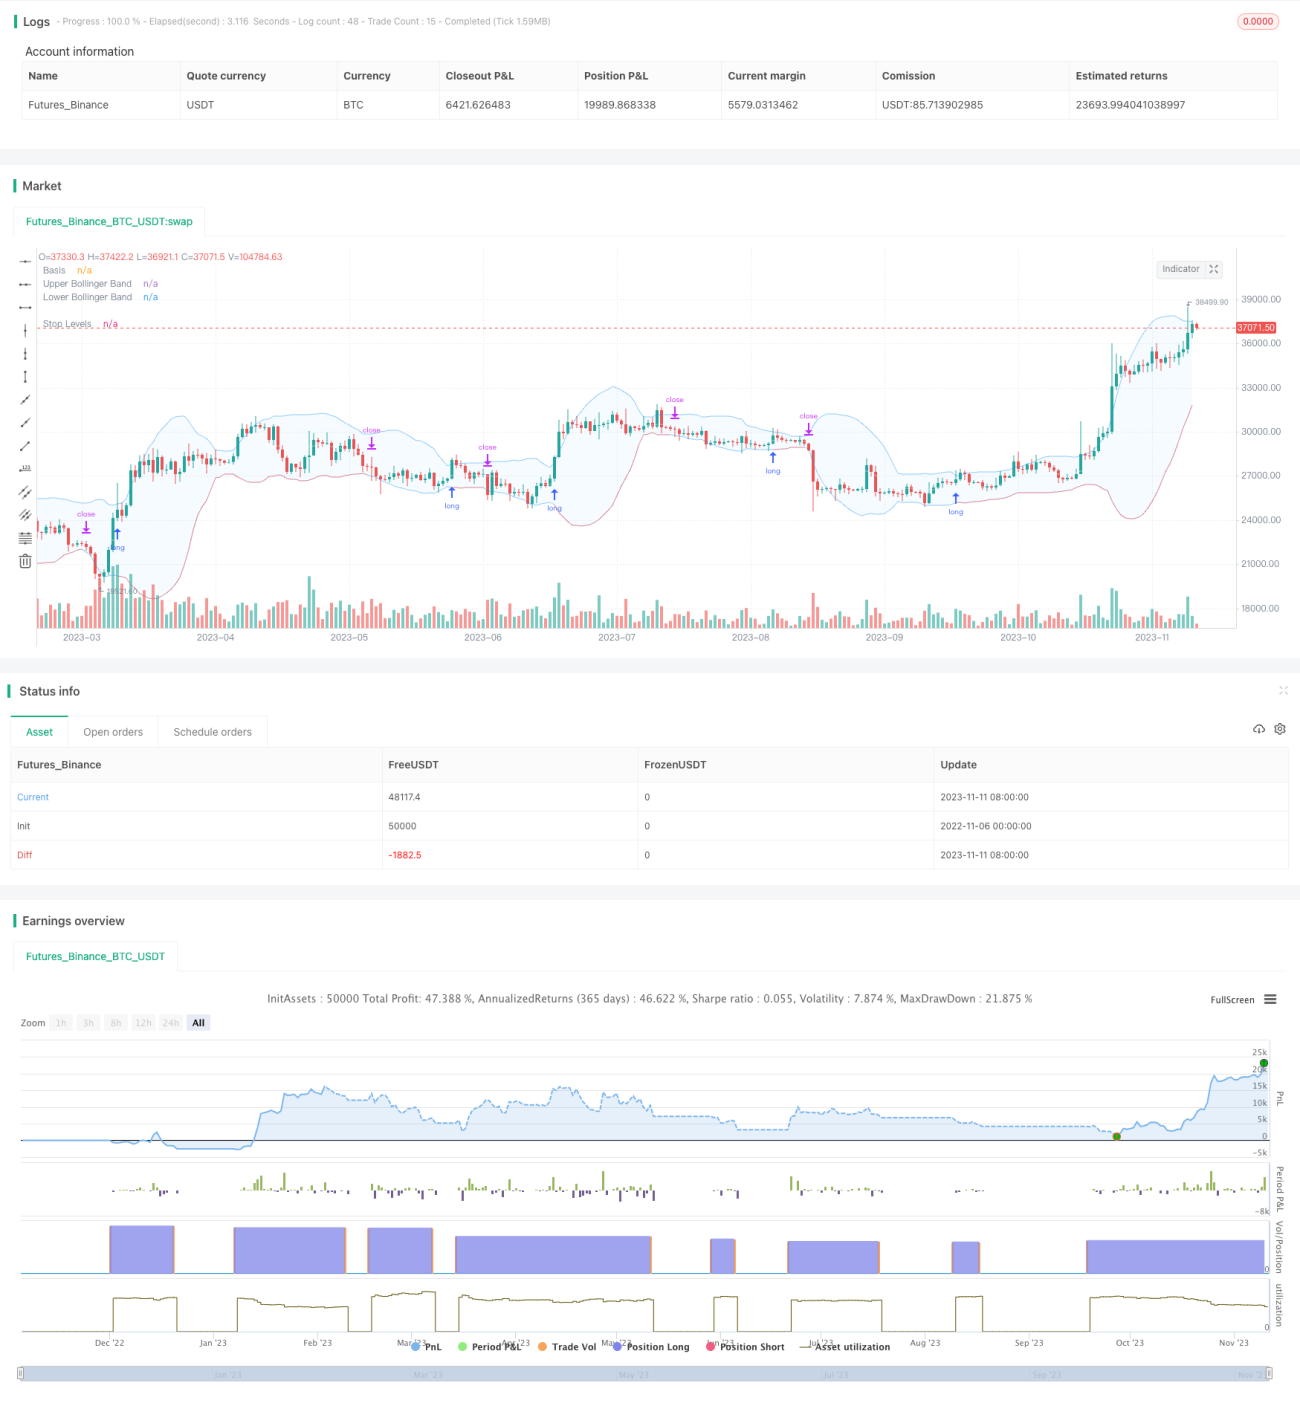
Chiến lược này sử dụng động lực lên và xuống của Bollinger Bands để thực hiện khi giá vượt qua Bollinger Bands lên đường và khi giá giảm xuống Bollinger Bands. Khác với chiến lược phá vỡ truyền thống, Bollinger Bands lên và xuống đường sẽ thay đổi động lực theo biến động lịch sử, có thể đánh giá tốt hơn tình trạng quá mua quá bán của thị trường.

Nguyên tắc chiến lược

Chiến lược này chủ yếu dựa trên sự phá vỡ của chỉ số Brin để xác định giá. Brin bao gồm ba đường:

  1. Đường giữa: trung bình di chuyển n ngày
  2. Đường lên: đường trung tâm + k * n ngày chênh lệch chuẩn
  3. Đường dưới: đường trung bình - k * n ngày chênh lệch chuẩn

Khi giá tăng vượt quá đường lên, coi thị trường đang trong tình trạng mua quá mức, bạn có thể làm nhiều hơn. Khi giá giảm vượt quá đường xuống, coi thị trường đang trong tình trạng bán quá mức, bạn nên thanh toán.

Chính sách này cho phép tùy chỉnh các tham số của dải Brin: chiều dài đường trung n và số nhân của chênh lệch chuẩn k. Độ dài đường trung mặc định là 20 ngày và số nhân của chênh lệch chuẩn là 2.

Sau khi đóng cửa mỗi ngày, nó sẽ kiểm tra xem giá đóng cửa của ngày đó có phá vỡ đường lên không. Nếu có, nó sẽ thực hiện nhiều tín hiệu khi mở cửa vào ngày hôm sau. Sau khi làm nhiều hơn, nó sẽ theo dõi trực tiếp liệu giá có phá vỡ đường xuống hay không, nếu phá vỡ thì thanh toán.

Chiến lược này cũng giới thiệu bộ lọc đường trung bình, chỉ được tạo ra khi giá cao hơn đường trung bình. Bạn có thể chọn vẽ đường trung bình trong chu kỳ hiện tại hoặc chu kỳ cao hơn để kiểm soát thời điểm vào.

Phương pháp dừng lỗ cũng cung cấp hai lựa chọn: dừng phần trăm cố định hoặc theo dõi đường ray của Brin. Điều sau này có thể cung cấp không gian lớn hơn để lợi nhuận hoạt động.

Lợi thế chiến lược

  • SUPERBUY/SUPPERSELL sử dụng Brin để đánh giá thị trường
  • Bộ lọc đồng nhất, tránh giao dịch ngược
  • Tùy chỉnh các tham số Brin để phù hợp với các chu kỳ khác nhau
  • Cung cấp hai lựa chọn dừng lỗ
  • Hỗ trợ các tham số tối ưu hóa phản hồi, chiến lược xác thực thực tế

Rủi ro chiến lược

  • Blinky không thể đánh giá được sự quá mua và quá bán
  • Bộ lọc trung bình có thể bỏ lỡ cơ hội đột phá nhanh hơn
  • Lệnh dừng cố định có thể quá bảo thủ, lệnh dừng theo dõi có thể quá cấp tiến
  • Cần tối ưu hóa các tham số để phù hợp với các giống và chu kỳ khác nhau
  • Không có giới hạn về mức độ tổn thất, phải xem xét quản lý tài chính

Tối ưu hóa chiến lược

  • Kiểm tra các kết hợp tham số trung bình khác nhau
  • Thử các tham số khác nhau của Brin
  • So sánh thu nhập của Stop Loss% cố định và Stop Loss theo dõi theo dõi
  • Thêm mô-đun quản lý tiền để hạn chế tổn thất đơn lẻ
  • Kết hợp với các chỉ số khác để xác nhận tín hiệu băng thông Brin

Tóm tắt

Chiến lược này sử dụng động lực của Brin Belt để đánh giá quá mua quá bán, tham khảo các tín hiệu lọc đồng nhất, sử dụng quỹ bảo vệ dừng lỗ. Nó thích nghi hơn với sự biến động của thị trường so với phá vỡ quỹ đạo cố định truyền thống.

Mã nguồn chiến lược
/*backtest
start: 2022-11-06 00:00:00
end: 2023-11-12 00:00:00
period: 1d
basePeriod: 1h
exchanges: [{"eid":"Futures_Binance","currency":"BTC_USDT"}]
*/

//@version=5

// Revision:        1
// Author:          @millerrh
// Strategy:  
//      Entry: Buy when price breaks out of upper Bollinger Band
//      Exit: Trail a stop with the lower Bollinger Band 
// Conditions/Variables:
//    1. Can add a filter to only take setups that are above a user-defined moving average on current timeframe and/or longer timeframe (helps avoid trading counter trend) 
//    2. Manually configure which dates to back test
//    3. User-Configurable Bollinger Band Settings
//    4. Optionally use a tighter initial stop level.  Once Bollinger Band catches up, trail with lower Bollinger Band to give more breathing room.

// strategy('Donchian Breakout', overlay=true, initial_capital=100000, currency='USD', default_qty_type=strategy.percent_of_equity, calc_on_every_tick = true,
//   default_qty_value=100, commission_type=strategy.commission.percent, commission_value=0.1)

strategy('Bollinger Breakout', overlay=true, initial_capital=100000, currency='USD', default_qty_type=strategy.percent_of_equity,
  default_qty_value=100, commission_type=strategy.commission.percent, commission_value=0.0, calc_on_order_fills=true)

// === BACKTEST RANGE ===
Start = input(defval = timestamp("01 Jan 2019 06:00 +0000"), title = "Backtest Start Date", group = "backtest window")
Finish = input(defval = timestamp("01 Jan 2100 00:00 +0000"), title = "Backtest End Date", group = "backtest window")

// == INPUTS ==
// Bollinger Band Inputs
bbLength = input.int(20, minval=1, group = "Bollinger Band Settings", title="Bollinger Band Length",
  tooltip = "Bollinger Band moving average length.")
bbMultTop = input.float(2.0, minval=0.001, maxval=50, title="Standard Deviation (Top)")
bbMultBot = input.float(2.0, minval=0.001, maxval=50, title="Standard Deviation (Bottom)")

useTightStop = input.bool(title='Use Fixed Percentage for Initial Stop?', defval=false, group = "order entry",
  tooltip = "'Keep your losers small and let winners run' is the saying.  This will allow you to use a tight initial stop
  until the lower Bollinger Band catches up.")
percStop = input.int(title="Stop", defval=8, group = "order entry", inline = "perc")
trigInput = input.string(title='Execute Trades On...', defval='Wick', options=['Wick', 'Close'], group = "order entry",
  tooltip = "Useful for comparing standing stop orders at the Bollinger Band boundary (executing on the wick) vs. waiting for candle closes prior to taking action")

// Moving Average Filtering Inputs
useMaFilter = input.bool(title='Use Moving Average for Filtering (Current Timeframe)?', defval=false, group = "moving average filtering",
  tooltip = "Signals will be ignored when price is under this moving average.  The intent is to keep you out of bear periods and only buying when 
             price is showing strength.")
maType = input.string(defval='SMA', options=['EMA', 'SMA'], title='MA Type For Filtering', group = "moving average filtering")
maLength = input.int(defval=50, title="Moving Average:    Length", minval=1, group = "moving average filtering", inline = "1ma")
ma1Color = input.color(color.new(color.green, 50), title = " Color", group = "moving average filtering", inline = "1ma")
useMaFilter2 = input.bool(title='Use Moving Average for Filtering (High Timeframe)?', defval=false, group = "moving average filtering")
tfSet = input.timeframe(defval="D", title="Timeframe of Moving Average", group = "moving average filtering",
  tooltip = "Allows you to set a different time frame for a moving average filter.  Trades will be ignored when price is under this moving average.
  The idea is to keep your eye on the larger moves in the market and stay on the right side of the longer term trends and help you be pickier about 
  the stocks you trade.")
ma2Type = input.string(defval='SMA', options=['EMA', 'SMA'], title='MA Type For Filtering', group = "moving average filtering")
ma2Length = input.int(defval=50, title="Moving Average:    Length", minval=1, group = "moving average filtering", inline = "2ma")
ma2Color = input.color(color.new(color.white, 50), title = " Color", group = "moving average filtering", inline = "2ma")


// === THE BOLLINGER BAND ===
// Logic
bbBasis = ta.sma(close, bbLength)
bbUpper = bbBasis + bbMultTop * ta.stdev(close, bbLength)
bbLower = bbBasis - bbMultBot * ta.stdev(close, bbLength)

// Plotting
plot(bbBasis, "Basis", color=color.new(color.white, 50))
p1 = plot(bbUpper, color=color.new(color.blue, 50), linewidth=1, title='Upper Bollinger Band')
p2 = plot(bbLower, color=color.new(color.blue, 50), linewidth=1, title='Lower Bollinger Band')
fill(p1, p2, title = "Background", color=color.rgb(33, 150, 243, 95))

// == FILTERING LOGIC ==
// Declare function to be able to swap out EMA/SMA
ma(maType, src, length) =>
    maType == 'EMA' ? ta.ema(src, length) : ta.sma(src, length)  //Ternary Operator (if maType equals EMA, then do ema calc, else do sma calc)
maFilter = ma(maType, close, maLength)
maFilter2 = request.security(syminfo.tickerid, tfSet, ma(ma2Type, close, ma2Length))

// Plotting
plot(useMaFilter ? maFilter : na, title='Trend Filter MA - CTF', color=ma1Color, linewidth=2, style=plot.style_line)
plot(useMaFilter2 ? maFilter2 : na, title='Trend Filter MA - HTF', color=ma2Color, linewidth=2, style=plot.style_line)


// == ENTRY AND EXIT CRITERIA ==
// Trigger stop based on candle close or High/Low (i.e. Wick)
trigResistance = trigInput == 'Close' ? close : trigInput == 'Wick' ? high : na
trigSupport = trigInput == 'Close' ? close : trigInput == 'Wick' ? low : na
buySignal = trigResistance >= bbUpper 

buyConditions = (useMaFilter ? bbUpper > maFilter : true) and
  (useMaFilter2 ? bbUpper > maFilter2 : true) 
  
// == STOP AND PRICE LEVELS ==
// Configure initial stop level
inPosition = strategy.position_size > 0
stopLevel = strategy.position_avg_price - (strategy.position_avg_price * percStop/100)
posStop = stopLevel > bbLower ? stopLevel : bbLower


// Check if using stop vs. not
stop = useTightStop ? posStop : bbLower
plot(inPosition ? stop : na, style=plot.style_linebr, color=color.new(color.red, 40), linewidth = 1, title = "Stop Levels", trackprice=false)

sellSignal = trigSupport <= stop

// == STRATEGY ENTRIES & EXITS ==
// This string of code enters and exits at the candle close
if trigInput == 'Close'
    strategy.entry('Long', strategy.long, when=buyConditions and buySignal)
    strategy.close('Long', when=sellSignal)

// This string of code enters and exits at the wick (i.e. with pre-set stops)
if trigInput == 'Wick'
    strategy.entry('Long', strategy.long, stop=bbUpper, when=buyConditions)
    strategy.exit('Exit Long', from_entry='Long', stop=stop)
strategy.cancel('Long',when= not(buyConditions)) // Resets stop level once buyConditions aren't true anymore