Chiến lược giao dịch hai hướng của Williams Fractals

Tác giả:ChaoZhang, Ngày: 2023-11-15 16:22:07
Tags:

img

Tổng quan

Chiến lược này sử dụng chỉ số giá cao và giá thấp mới của Williams để xác định các tín hiệu đảo ngược, với nhiều đường trung bình động cho giao dịch phá vỡ và RSI để lọc các tín hiệu sai, cho phép giao dịch hai hướng hiệu quả.

Chiến lược logic

  1. Chỉ số giá cao và thấp mới của Williams xác định các bước ngoặt bằng cách sử dụng giá cao nhất và thấp nhất trong một khoảng thời gian nhất định. Nó tạo ra tín hiệu mua và bán.

  2. Các đường trung bình động 20, 50 và 100 ngày tạo thành nhiều đường trung bình động.

  3. Chỉ số RSI xác định các khu vực mua quá mức và bán quá mức để lọc các tín hiệu không chắc chắn.

  4. Chiến lược xác định hai đường trung bình động nào bị phá vỡ, kết hợp các tín hiệu chỉ số Williams và lọc RSI để tạo ra các tín hiệu mua và bán đáng tin cậy.

  5. Quy tắc tham gia: Khi MA ngắn hạn vượt qua trên MA trung hạn hoặc dài hạn, và Williams tín hiệu thấp mới và RSI thấp xuất hiện, đi dài. Khi MA ngắn hạn vượt qua dưới MA trung hạn hoặc dài hạn, và Williams tín hiệu cao mới và RSI cao xuất hiện, đi ngắn.

  6. Dừng lỗ và lấy lợi nhuận: Lãi suất dừng lỗ và lấy lợi nhuận cố định.

Ưu điểm

  1. Chỉ số Williams xác định chính xác các tín hiệu hỗ trợ và kháng cự chính cho tín hiệu đảo ngược.

  2. Nhiều đường chéo trung bình động tránh các tín hiệu sai từ các whipsaws trung bình động duy nhất.

  3. Các bộ lọc RSI giúp thời gian nhập chính xác và đáng tin cậy hơn.

  4. Stop loss cố định và lấy lợi nhuận kiểm soát rủi ro và cung cấp sự rõ ràng về P&L.

  5. Kết hợp các chỉ số đảo ngược và xu hướng cung cấp các tín hiệu đáng tin cậy hơn.

Rủi ro

  1. Chọn biểu tượng không phù hợp, các thông số cần điều chỉnh cho các biểu tượng khác nhau.

  2. Lựa chọn khung thời gian không hiệu quả, các tham số cần điều chỉnh cho các khung thời gian khác nhau.

  3. Stop loss / take profit cố định không thể thích nghi với những thay đổi của thị trường, có thể dừng hoặc lấy lợi nhuận sớm.

  4. Whipsaws khi đường trung bình động dao động có thể tạo ra tín hiệu sai.

  5. Dễ tín hiệu khi các chỉ số khác nhau.

Cơ hội gia tăng

  1. Tối ưu hóa động các thông số cho các công cụ giao dịch khác nhau.

  2. Đưa ra stop loss thích nghi và lấy lợi nhuận để có lợi nhuận và L.

  3. Thêm thêm các bộ lọc như MACD, Stochastics để giảm tín hiệu sai.

  4. Kết hợp các thuật toán máy học để tự động phát hiện mục nhập tối ưu.

  5. Tích hợp nhiều chỉ số xu hướng để xác định các điều kiện xu hướng.

Tóm lại

Chiến lược này kết hợp Williams, đường trung bình động, RSI và các công cụ phân tích kỹ thuật khác, sử dụng xác nhận kép để giảm tín hiệu sai và nắm bắt hiệu quả sự đảo ngược, với việc dừng lỗ / lấy lợi nhuận cố định để kiểm soát rủi ro. Nhìn chung là một hệ thống giao dịch hai hướng đáng tin cậy và thực tế.


/*backtest
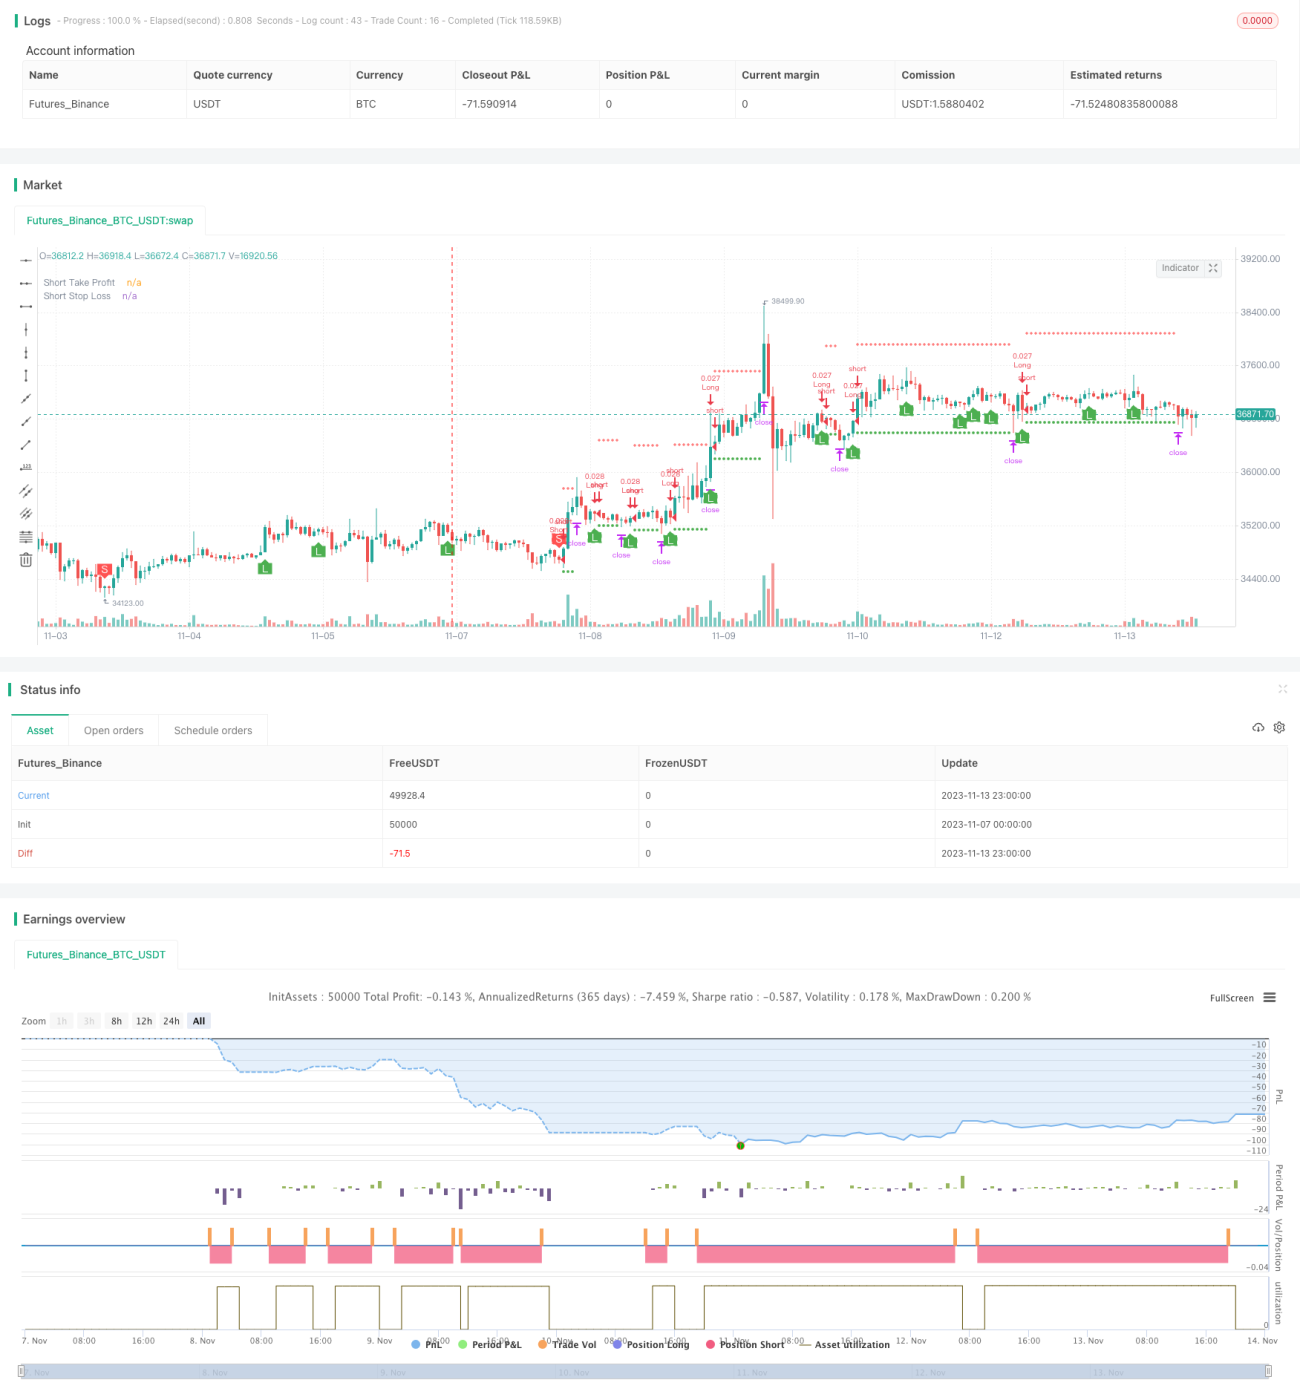
start: 2023-11-07 00:00:00
end: 2023-11-14 00:00:00
period: 1h
basePeriod: 15m
exchanges: [{"eid":"Futures_Binance","currency":"BTC_USDT"}]
*/

// This source code is subject to the terms of the Mozilla Public License 2.0 at https://mozilla.org/MPL/2.0/
// © B_L_A_C_K_S_C_O_R_P_I_O_N
// v 1.1

//@version=4
strategy("Williams Fractals Strategy by ȼhąţhµяąɲǥą", overlay=true, default_qty_type=strategy.cash, default_qty_value=1000, currency='USD')

// *************Appearance*************
theme = input(type=input.string, defval="dark", options=["light","dark"], group="Appearance")
show_fractals = input(false, "Show Fractals", group="Appearance")
show_ema = input(false, "Show EMAs", group="Appearance")

// *************colors*************
color_green = color.green
color_red = color.red
color_yellow = color.yellow
color_orange = color.orange
color_blue = color.blue
color_white = color.white

// *************WF*************
// Define "n" as the number of periods and keep a minimum value of 2 for error handling.
n = input(title="Fractal Periods", defval=2, minval=2, type=input.integer, group="Williams Fractals")

// UpFractal
bool upflagDownFrontier = true
bool upflagUpFrontier0 = true
bool upflagUpFrontier1 = true
bool upflagUpFrontier2 = true
bool upflagUpFrontier3 = true
bool upflagUpFrontier4 = true

for i = 1 to n
    upflagDownFrontier := upflagDownFrontier and (high[n-i] < high[n])
    upflagUpFrontier0 := upflagUpFrontier0 and (high[n+i] < high[n])
    upflagUpFrontier1 := upflagUpFrontier1 and (high[n+1] <= high[n] and high[n+i + 1] < high[n])
    upflagUpFrontier2 := upflagUpFrontier2 and (high[n+1] <= high[n] and high[n+2] <= high[n] and high[n+i + 2] < high[n])
    upflagUpFrontier3 := upflagUpFrontier3 and (high[n+1] <= high[n] and high[n+2] <= high[n] and high[n+3] <= high[n] and high[n+i + 3] < high[n])
    upflagUpFrontier4 := upflagUpFrontier4 and (high[n+1] <= high[n] and high[n+2] <= high[n] and high[n+3] <= high[n] and high[n+4] <= high[n] and high[n+i + 4] < high[n])
flagUpFrontier = upflagUpFrontier0 or upflagUpFrontier1 or upflagUpFrontier2 or upflagUpFrontier3 or upflagUpFrontier4

upFractal = (upflagDownFrontier and flagUpFrontier)

// downFractal
bool downflagDownFrontier = true
bool downflagUpFrontier0 = true
bool downflagUpFrontier1 = true
bool downflagUpFrontier2 = true
bool downflagUpFrontier3 = true
bool downflagUpFrontier4 = true

for i = 1 to n
    downflagDownFrontier := downflagDownFrontier and (low[n-i] > low[n])
    downflagUpFrontier0 := downflagUpFrontier0 and (low[n+i] > low[n])
    downflagUpFrontier1 := downflagUpFrontier1 and (low[n+1] >= low[n] and low[n+i + 1] > low[n])
    downflagUpFrontier2 := downflagUpFrontier2 and (low[n+1] >= low[n] and low[n+2] >= low[n] and low[n+i + 2] > low[n])
    downflagUpFrontier3 := downflagUpFrontier3 and (low[n+1] >= low[n] and low[n+2] >= low[n] and low[n+3] >= low[n] and low[n+i + 3] > low[n])
    downflagUpFrontier4 := downflagUpFrontier4 and (low[n+1] >= low[n] and low[n+2] >= low[n] and low[n+3] >= low[n] and low[n+4] >= low[n] and low[n+i + 4] > low[n])
flagDownFrontier = downflagUpFrontier0 or downflagUpFrontier1 or downflagUpFrontier2 or downflagUpFrontier3 or downflagUpFrontier4

downFractal = (downflagDownFrontier and flagDownFrontier)

plotshape(downFractal and show_fractals, style=shape.triangleup, location=location.belowbar, offset=-n, color=color_green)
plotshape(upFractal and show_fractals, style=shape.triangledown, location=location.abovebar, offset=-n, color=color_red)

// *************EMA*************
len_a = input(20, minval=1, title="EMA Length A", group="EMA")
src_a = input(close, title="EMA Source A", group="EMA")
offset_a = input(title="EMA Offset A", type=input.integer, defval=0, minval=-500, maxval=500, group="EMA")
out_a = ema(src_a, len_a)
plot(show_ema ? out_a : na, title="EMA A", color=color_green, offset=offset_a)

len_b = input(50, minval=1, title="EMA Length B", group="EMA")
src_b = input(close, title="EMA Source B", group="EMA")
offset_b = input(title="EMA Offset B", type=input.integer, defval=0, minval=-500, maxval=500, group="EMA")
out_b = ema(src_b, len_b)
ema_b_color = (theme == "dark") ? color_yellow : color_orange
plot(show_ema ? out_b : na, title="EMA B", color=ema_b_color, offset=offset_b)

len_c = input(100, minval=1, title="EMA Length C", group="EMA")
src_c = input(close, title="EMA Source C", group="EMA")
offset_c = input(title="EMA Offset C", type=input.integer, defval=0, minval=-500, maxval=500, group="EMA")
out_c = ema(src_c, len_c)
ema_c_color = (theme == "dark") ? color_white : color_blue
plot(show_ema ? out_c : na, title="EMA C", color=ema_c_color, offset=offset_c)

// *************RSI*************
rsi_len = input(14, minval=1, title="RSI Length", group="RSI")
rsi_src = input(close, "RSI Source", type = input.source, group="RSI")
up = rma(max(change(rsi_src), 0), rsi_len)
down = rma(-min(change(rsi_src), 0), rsi_len)
rsi = down == 0 ? 100 : up == 0 ? 0 : 100 - (100 / (1 + up / down))

// *************Calculation*************
long = (out_a > out_b) and (out_a > out_c) and downFractal and low[2] > out_c and rsi[2] < rsi
short = (out_a < out_b) and (out_a < out_c) and upFractal and high[2] < out_c and rsi[2] > rsi

plotshape(long, style=shape.labelup, color=color_green, location=location.belowbar, title="long label", text= "L", textcolor=color_white)
plotshape(short, style=shape.labeldown, color=color_red, location=location.abovebar, title="short label", text= "S", textcolor=color_white)

// *************End of Signals calculation*************

// Make input options that configure backtest date range
startDate = input(title="Start Date", type=input.integer,
     defval=1, minval=1, maxval=31, group="Orders")
startMonth = input(title="Start Month", type=input.integer,
     defval=1, minval=1, maxval=12, group="Orders")
startYear = input(title="Start Year", type=input.integer,
     defval=2018, minval=1800, maxval=2100, group="Orders")

endDate = input(title="End Date", type=input.integer,
     defval=1, minval=1, maxval=31, group="Orders")
endMonth = input(title="End Month", type=input.integer,
     defval=12, minval=1, maxval=12, group="Orders")
endYear = input(title="End Year", type=input.integer,
     defval=2022, minval=1800, maxval=2100, group="Orders")

// Look if the close time of the current bar
// falls inside the date range
inDateRange =  true

// Make inputs that set the take profit % (optional)
longProfitPerc = input(title="Long Take Profit (%)",
     type=input.float, minval=0.0, step=0.1, defval=0.5, group="Orders") * 0.01

shortProfitPerc = input(title="Short Take Profit (%)",
     type=input.float, minval=0.0, step=0.1, defval=0.5, group="Orders") * 0.01

// Figure out take profit price
longExitPrice  = strategy.position_avg_price * (1 + longProfitPerc)
shortExitPrice = strategy.position_avg_price * (1 - shortProfitPerc)

// Plot take profit values for confirmation
plot(series=(strategy.position_size > 0) ? longExitPrice : na,
     color=color_green, style=plot.style_circles,
     linewidth=1, title="Long Take Profit")
plot(series=(strategy.position_size < 0) ? shortExitPrice : na,
     color=color_green, style=plot.style_circles,
     linewidth=1, title="Short Take Profit")

// Submit entry orders
if (inDateRange and long and strategy.opentrades == 0)
    strategy.entry(id="Long", long=true)

if (inDateRange and short and strategy.opentrades == 0)
    strategy.entry(id="Short", long=false)

// Submit exit orders based on take profit price
// if (strategy.position_size > 0)
//     strategy.exit(id="LTP", limit=longExitPrice)

// if (strategy.position_size < 0)
//     strategy.exit(id="STP", limit=shortExitPrice)
    
// Set stop loss level with input options (optional)
longLossPerc = input(title="Long Stop Loss (%)",
     type=input.float, minval=0.0, step=0.1, defval=3.1, group="Orders") * 0.01

shortLossPerc = input(title="Short Stop Loss (%)",
     type=input.float, minval=0.0, step=0.1, defval=3.1, group="Orders") * 0.01

// Determine stop loss price
longStopPrice  = strategy.position_avg_price * (1 - longLossPerc)
shortStopPrice = strategy.position_avg_price * (1 + shortLossPerc)

// Plot stop loss values for confirmation
plot(series=(strategy.position_size > 0) ? longStopPrice : na,
     color=color_red, style=plot.style_cross,
     linewidth=1, title="Long Stop Loss")
plot(series=(strategy.position_size < 0) ? shortStopPrice : na,
     color=color_red, style=plot.style_cross,
     linewidth=1, title="Short Stop Loss")

// Submit exit orders based on calculated stop loss price
if (strategy.position_size > 0)
    strategy.exit(id="ExL",limit=longExitPrice, stop=longStopPrice)

if (strategy.position_size < 0)
    strategy.exit(id="ExS", limit=shortExitPrice, stop=shortStopPrice)

// Exit open market position when date range ends
if (not inDateRange)
    strategy.close_all()

Thêm nữa