Chiến lược mũi tên giao nhau của đường trung bình động kép

Tổng quan
Chiến lược này đánh giá thời gian mua và bán bằng cách tính toán đường chéo hai đường bằng nhau của chỉ số MACD. Nó vẽ hình mũi tên trên biểu đồ để gợi ý tín hiệu giao dịch.
Nguyên tắc
Chiến lược này đầu tiên tính toán đường nhanh (EMA 12), đường chậm (EMA 26) và chênh lệch MACD. Sau đó, tính toán thời gian mua và bán dựa trên đường nhanh và đường chậm và các giá trị dương và âm của chênh lệch MACD:
- Kích thước của MACD là 0 khi đường nhanh đi qua đường chậm.
- Giao thức bán khi đường nhanh đi qua đường chậm (đường chết) và đường MACD đi qua 0
Để lọc tín hiệu giả, mã cũng đánh giá tình trạng tín hiệu của dòng K trước đó. Chỉ khi một trong các dòng K hiện tại là tín hiệu ngược lại (mua chuyển sang bán hoặc bán chuyển sang mua), tín hiệu hiện tại sẽ được kích hoạt.
Ngoài ra, mã cũng vẽ một hình ảnh mũi tên trên đường K để gợi ý thời gian mua và bán.
Ưu điểm
Chiến lược này có những ưu điểm sau:
- Sử dụng phán đoán chéo hai đường bằng nhau, có thể lọc hiệu quả tiếng ồn thị trường, nhận biết xu hướng
- Kết hợp với phân biệt giá trị của MACD, bạn có thể tránh bị bỏ phiếu và sai lệch
- Sử dụng mũi tên để gợi ý thời gian mua và bán, điều hành rõ ràng hơn
- Các quy tắc đơn giản, rõ ràng, dễ hiểu và dễ sao chép
Rủi ro và giải pháp
Chiến lược này cũng có một số rủi ro:
- Giao chéo hai đường trung bình dễ tạo ra tín hiệu giả, có thể dẫn đến giao dịch quá mức. Các tham số đường trung bình có thể được điều chỉnh thích hợp hoặc thêm các điều kiện lọc khác để giảm tín hiệu giả
- Không thể đánh giá được sự biến động trong xu hướng, có thể có tổn thất. Có thể kết hợp với chỉ số xu hướng như ADX để tránh điều này
- Các điều kiện mua và bán cố định làm cho chiến lược trở nên cơ giới, không thể thích ứng với sự thay đổi của thị trường. Bạn có thể thử các phương pháp thích ứng tự động như học máy để tối ưu hóa
Hướng tối ưu hóa
Chiến lược này có thể được tối ưu hóa theo các hướng sau:
- Kiểm tra các tổ hợp tham số khác nhau để tìm ra các tham số nhanh, chậm và MACD tốt nhất
- Thêm các điều kiện nhập cảnh, chẳng hạn như thông qua các tín hiệu lọc khối lượng giao dịch
- Tăng cơ chế ngăn chặn để kiểm soát tổn thất đơn lẻ
- Kết hợp các chỉ số biến động như VIX để đánh giá sở thích rủi ro
- Thử nghiệm mô hình học máy thay cho các quy tắc cố định để thực hiện tối ưu hóa tự thích ứng của chiến lược
Tóm tắt
Chiến lược mũi tên chéo song song này nói chung là đơn giản và thực tế, thông qua phán đoán chéo song song và lọc chênh lệch MACD, bạn có thể nhận ra điểm mua và bán trong xu hướng đường dài và trung bình, tránh bỏ lỡ biến đổi giá. Các dấu hiệu mũi tên cũng làm cho hoạt động rõ ràng hơn và rõ ràng hơn.
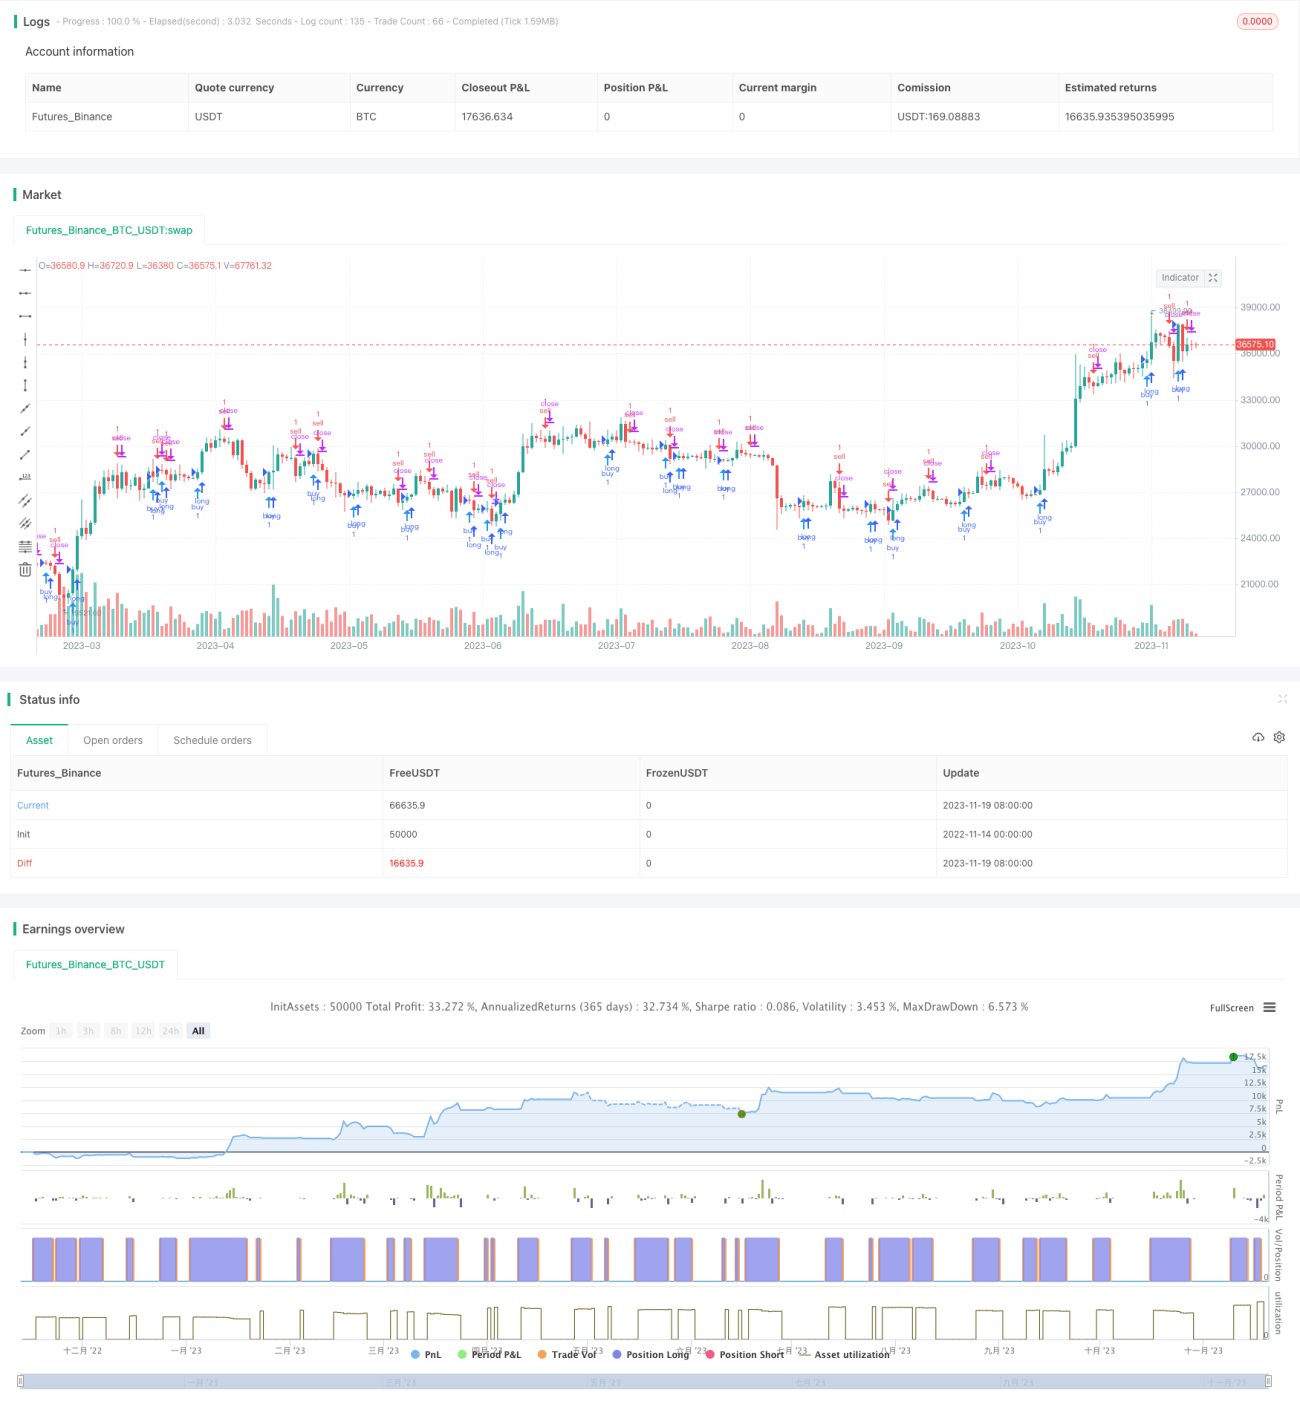
/*backtest
start: 2022-11-14 00:00:00
end: 2023-11-20 00:00:00
period: 1d
basePeriod: 1h
exchanges: [{"eid":"Futures_Binance","currency":"BTC_USDT"}]
*/

//@version=3
//Daniels stolen code
strategy(shorttitle="Daniels Stolen Code", title="Daniels Stolen Code", overlay=true, calc_on_order_fills=true, pyramiding=0)
- 1