
Chiến lược này là một chiến lược giao dịch định lượng sử dụng các chỉ số RSI và T3 để đánh giá xu hướng, kết hợp với các chỉ số ATR để thiết lập đường dừng lỗ, để thực hiện PMax thích nghi với đột phá. Ý tưởng chính của nó là tối ưu hóa các thiết lập đánh giá xu hướng và dừng lỗ để kiểm soát rủi ro đồng thời tăng khả năng lợi nhuận.
Tính toán RSI và T3 để xác định xu hướng
Cài đặt đường dừng tự điều chỉnh PMax theo chỉ số ATR
Bắt đầu mua và dừng lỗ
Chiến lược này có những lợi thế chính như sau:
Chiến lược này có những rủi ro:
Khi giá đảo ngược trong thời gian ngắn, có thể dẫn đến việc dừng lỗ được kích hoạt để tạo ra tổn thất. Đường dừng lỗ có thể được mở rộng thích hợp để giảm tác động của sự đảo ngược.
Hiệu quả của RSI và T3 chỉ số đánh giá xu hướng không phải là 100% đáng tin cậy, khi đánh giá sai cũng có thể dẫn đến tổn thất. Bạn có thể điều chỉnh các tham số thích hợp hoặc thêm các chỉ số khác để tối ưu hóa.
Chiến lược này có thể được tối ưu hóa hơn nữa ở những khía cạnh sau:
Chiến lược này tích hợp lợi thế của việc sử dụng ba chỉ số RSI, T3 và ATR để thực hiện sự kết hợp hữu cơ giữa phán đoán xu hướng và kiểm soát rủi ro. So với chỉ số đơn lẻ, nhóm này có tính năng phán đoán chính xác cao, kiểm soát lùi, là một chiến lược theo dõi xu hướng đáng tin cậy.
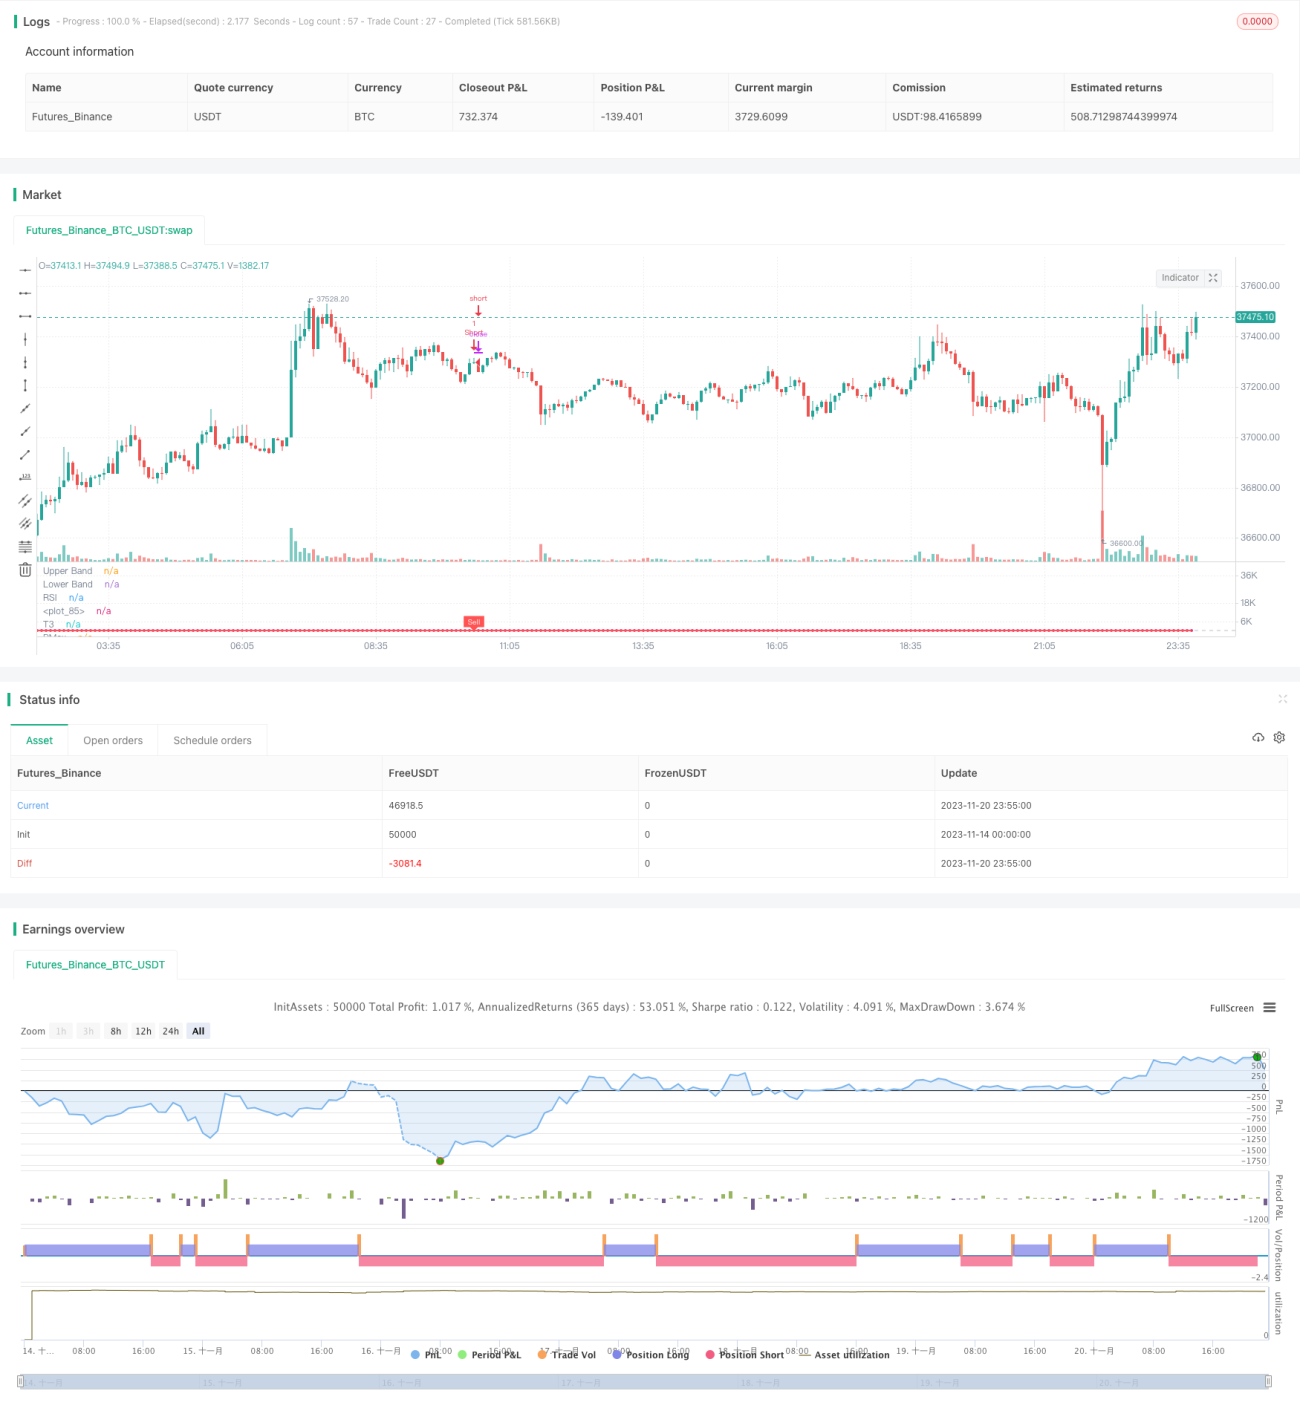
/*backtest
start: 2023-11-14 00:00:00
end: 2023-11-21 00:00:00
period: 5m
basePeriod: 1m
exchanges: [{"eid":"Futures_Binance","currency":"BTC_USDT"}]
*/
//@version=4
// This source code is subject to the terms of the Mozilla Public License 2.0 at https://mozilla.org/MPL/2.0/
// © KivancOzbilgic
//developer: @KivancOzbilgic
//author: @KivancOzbilgic
strategy("PMax on Rsi w T3 Strategy","PmR3St.", overlay=false, precision=2)
src = input(hl2, title="Source")
Multiplier = input(title="ATR Multiplier", type=input.float, step=0.1, defval=3)
length =input(8, "Tillson T3 Length", minval=1)
T3a1 = input(0.7, "TILLSON T3 Volume Factor", step=0.1)
Periods = input(10,title="ATR Length", type=input.integer)
rsilength = input(14, minval=1, title="RSI Length")
showrsi = input(title="Show RSI?", type=input.bool, defval=true)
showsupport = input(title="Show Moving Average?", type=input.bool, defval=true)
showsignalsk = input(title="Show Crossing Signals?", type=input.bool, defval=true)
highlighting = input(title="Highlighter On/Off ?", type=input.bool, defval=true)
i = close>=close[1] ? close-close[1] : 0
i2 = close<close[1] ? close[1]-close : 0
Wwma_Func(src,rsilength)=>
wwalpha = 1/ rsilength
WWMA = 0.0
WWMA := wwalpha*src + (1-wwalpha)*nz(WWMA[1])
WWMA=Wwma_Func(src,rsilength)
AvUp = Wwma_Func(i,rsilength)
AvDown = Wwma_Func(i2,rsilength)
AvgUp = sma(i,rsilength)
AvgDown =sma(i2,rsilength)
k1 = high>close[1] ? high-close[1] : 0
k2 = high<close[1] ? close[1]-high : 0
k3 = low>close[1] ? low-close[1] : 0
k4 = low<close[1] ? close[1]-low : 0
AvgUpH=(AvgUp*(rsilength-1)+ k1)/rsilength
AvgDownH=(AvgDown*(rsilength-1)+ k2)/rsilength
AvgUpL=(AvgUp*(rsilength-1)+ k3)/rsilength
AvgDownL=(AvgDown*(rsilength-1)+ k4)/rsilength
rs = AvUp/AvDown
rsi= rs==-1 ? 0 : (100-(100/(1+rs)))
rsh=AvgUpH/AvgDownH
rsih= rsh==-1 ? 0 : (100-(100/(1+rsh)))
rsl=AvgUpL/AvgDownL
rsil= rsl==-1 ? 0 : (100-(100/(1+rsl)))
TR=max(rsih-rsil,abs(rsih-rsi[1]),abs(rsil-rsi[1]))
atr=sma(TR,Periods)
plot(showrsi ? rsi : na, "RSI", color=#8E1599)
band1 = hline(70, "Upper Band", color=#C0C0C0)
band0 = hline(30, "Lower Band", color=#C0C0C0)
fill(band1, band0, color=#9915FF, transp=90, title="Background")
T3e1=ema(rsi, length)
T3e2=ema(T3e1,length)
T3e3=ema(T3e2,length)
T3e4=ema(T3e3,length)
T3e5=ema(T3e4,length)
T3e6=ema(T3e5,length)
T3c1=-T3a1*T3a1*T3a1
T3c2=3*T3a1*T3a1+3*T3a1*T3a1*T3a1
T3c3=-6*T3a1*T3a1-3*T3a1-3*T3a1*T3a1*T3a1
T3c4=1+3*T3a1+T3a1*T3a1*T3a1+3*T3a1*T3a1
T3=T3c1*T3e6+T3c2*T3e5+T3c3*T3e4+T3c4*T3e3
MAvg=T3
Pmax_Func(rsi,length)=>
longStop = MAvg - Multiplier*atr
longStopPrev = nz(longStop[1], longStop)
longStop := MAvg > longStopPrev ? max(longStop, longStopPrev) : longStop
shortStop = MAvg + Multiplier*atr
shortStopPrev = nz(shortStop[1], shortStop)
shortStop := MAvg < shortStopPrev ? min(shortStop, shortStopPrev) : shortStop
dir = 1
dir := nz(dir[1], dir)
dir := dir == -1 and MAvg > shortStopPrev ? 1 : dir == 1 and MAvg < longStopPrev ? -1 : dir
PMax = dir==1 ? longStop: shortStop
PMax=Pmax_Func(rsi,length)
plot(showsupport ? MAvg : na, color=color.black, linewidth=2, title="T3")
pALL=plot(PMax, color=color.red, linewidth=2, title="PMax", transp=0)
alertcondition(cross(MAvg, PMax), title="Cross Alert", message="PMax - Moving Avg Crossing!")
alertcondition(crossover(MAvg, PMax), title="Crossover Alarm", message="Moving Avg BUY SIGNAL!")
alertcondition(crossunder(MAvg, PMax), title="Crossunder Alarm", message="Moving Avg SELL SIGNAL!")
alertcondition(cross(src, PMax), title="Price Cross Alert", message="PMax - Price Crossing!")
alertcondition(crossover(src, PMax), title="Price Crossover Alarm", message="PRICE OVER PMax - BUY SIGNAL!")
alertcondition(crossunder(src, PMax), title="Price Crossunder Alarm", message="PRICE UNDER PMax - SELL SIGNAL!")
buySignalk = crossover(MAvg, PMax)
plotshape(buySignalk and showsignalsk ? PMax*0.995 : na, title="Buy", text="Buy", location=location.absolute, style=shape.labelup, size=size.tiny, color=color.green, textcolor=color.white, transp=0)
sellSignallk = crossunder(MAvg, PMax)
plotshape(sellSignallk and showsignalsk ? PMax*1.005 : na, title="Sell", text="Sell", location=location.absolute, style=shape.labeldown, size=size.tiny, color=color.red, textcolor=color.white, transp=0)
mPlot = plot(rsi, title="", style=plot.style_circles, linewidth=0,display=display.none)
longFillColor = highlighting ? (MAvg>PMax ? color.green : na) : na
shortFillColor = highlighting ? (MAvg<PMax ? color.red : na) : na
fill(mPlot, pALL, title="UpTrend Highligter", color=longFillColor)
fill(mPlot, pALL, title="DownTrend Highligter", color=shortFillColor)
dummy0 = input(true, title = "=Backtest Inputs=")
FromDay = input(defval = 1, title = "From Day", minval = 1, maxval = 31)
FromMonth = input(defval = 1, title = "From Month", minval = 1, maxval = 12)
FromYear = input(defval = 2005, title = "From Year", minval = 2005)
ToDay = input(defval = 1, title = "To Day", minval = 1, maxval = 31)
ToMonth = input(defval = 1, title = "To Month", minval = 1, maxval = 12)
ToYear = input(defval = 9999, title = "To Year", minval = 2006)
Start = timestamp(FromYear, FromMonth, FromDay, 00, 00)
Finish = timestamp(ToYear, ToMonth, ToDay, 23, 59)
Timerange() =>
time >= Start and time <= Finish ? true : false
if buySignalk
strategy.entry("Long", strategy.long,when=Timerange())
if sellSignallk
strategy.entry("Short", strategy.short,when=Timerange())