
Đây là một chiến lược sử dụng đường đồng nhất và kênh Brin để đánh giá xu hướng và kết hợp các nguyên tắc lọc và dừng phá vỡ. Nó có thể bắt tín hiệu khi xu hướng thay đổi, giảm tín hiệu sai bằng cách lọc hai đường đồng nhất, thiết lập dừng để kiểm soát rủi ro.
Chiến lược này bao gồm:
Xác định xu hướng: Sử dụng MACD để xác định xu hướng giá, phân biệt xu hướng nhiều đầu và không đầu.
Bộ lọc phạm vi: Sử dụng kênh Brin để xác định phạm vi biến động giá và lọc các tín hiệu không vượt qua phạm vi.
Xác nhận hai đường trung bình: hai đường trung bình bao gồm EMA nhanh và EMA chậm, được sử dụng để xác nhận tín hiệu xu hướng. Chỉ có tín hiệu mua được tạo ra khi EMA nhanh> EMA chậm.
Cơ chế dừng lỗ: thiết lập điểm dừng lỗ, dừng lỗ khi giá phá vỡ điểm dừng lỗ theo hướng bất lợi.
Lập luận của tín hiệu nhập là:
Một tín hiệu mua được tạo ra khi ba điều kiện trên được đáp ứng cùng một lúc.
Logic giao dịch bằng phẳng có hai loại, giao dịch bằng phẳng dừng và giao dịch bằng phẳng dừng. Điểm dừng được nhân với giá vào một tỷ lệ nhất định, điểm dừng được nhân với giá vào một tỷ lệ nhất định. Khi giá phá vỡ một trong những điểm đó, giao dịch bằng phẳng.
Chiến lược này có những lợi thế sau:
Chiến lược này cũng có một số rủi ro:
Các rủi ro này có thể được tối ưu hóa và cải thiện bằng cách tối ưu hóa các tham số, điều chỉnh vị trí dừng lỗ.
Chiến lược này có thể được tối ưu hóa theo các hướng sau:
Bằng cách thử nghiệm các thiết lập tham số khác nhau, đánh giá lợi nhuận và tỷ lệ Sharpe, bạn có thể tìm thấy trạng thái tối ưu của chiến lược này.
Đây là một chiến lược định lượng sử dụng suy nghĩ định hướng, lọc phạm vi, xác nhận hai đường cong và dừng lỗ. Nó có thể xác định hiệu quả hướng xu hướng, tìm sự cân bằng giữa tối đa hóa lợi nhuận và kiểm soát rủi ro.
/*backtest
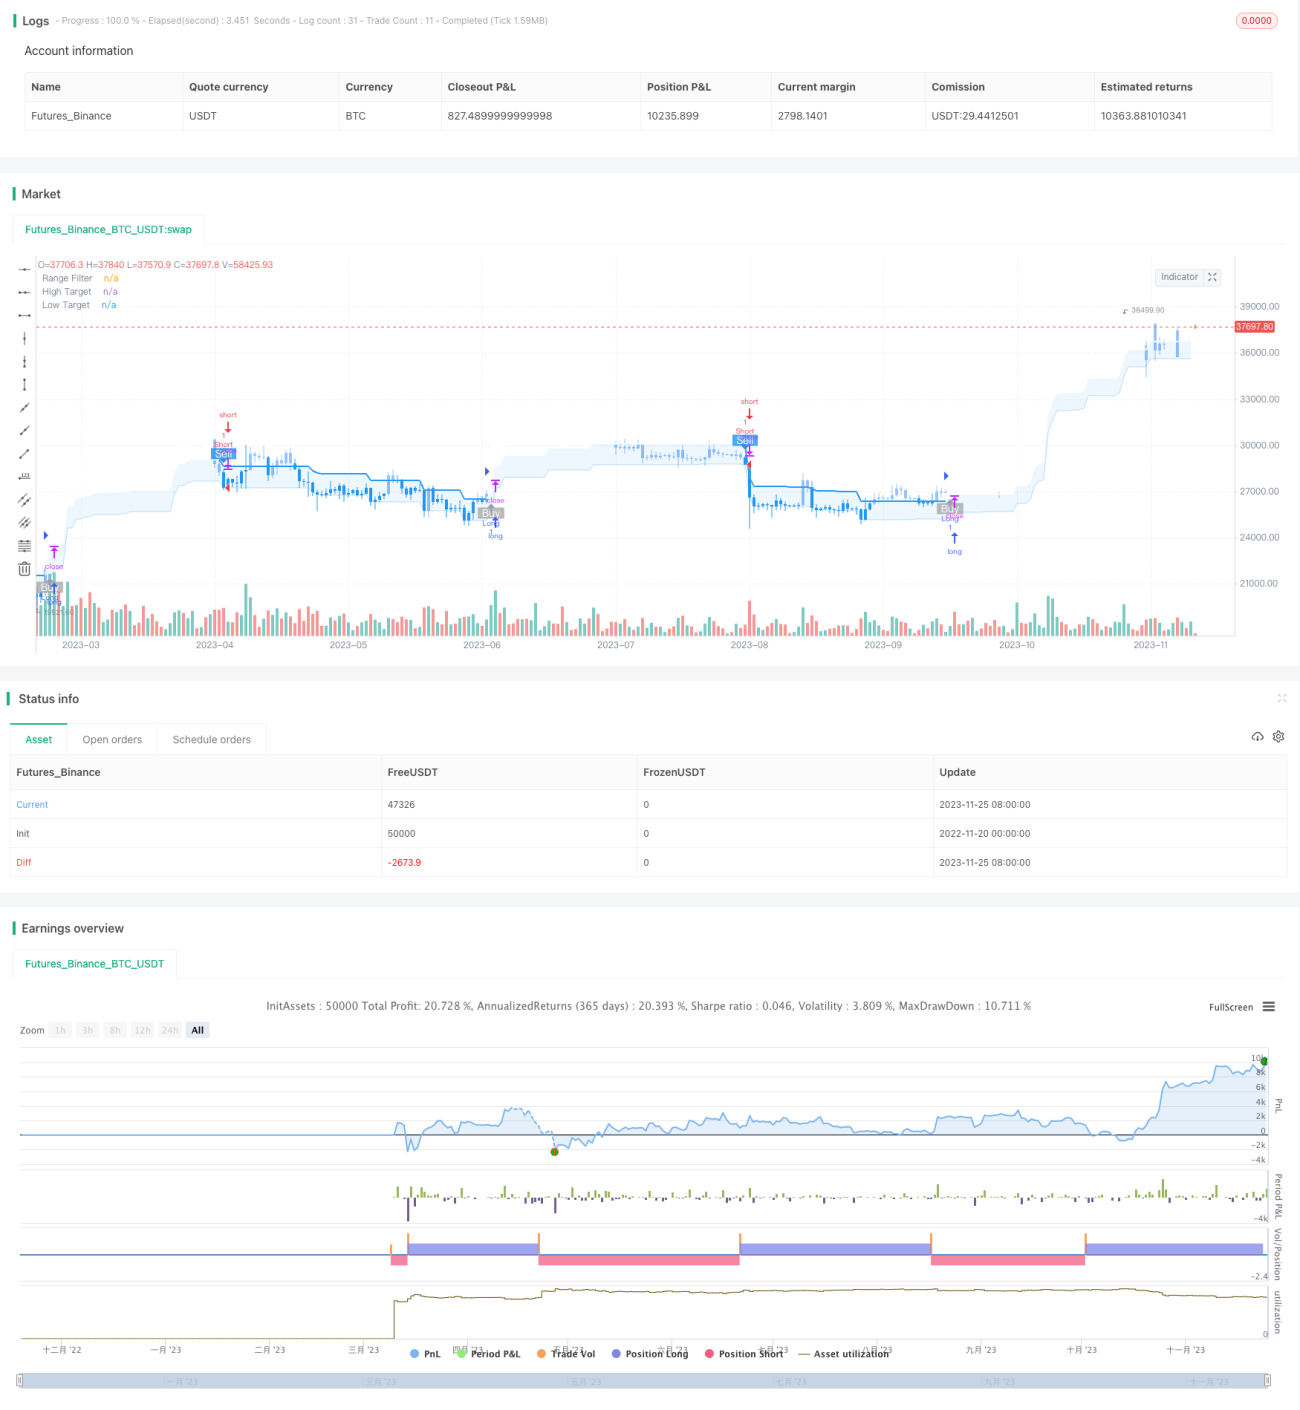
start: 2022-11-20 00:00:00
end: 2023-11-26 00:00:00
period: 1d
basePeriod: 1h
exchanges: [{"eid":"Futures_Binance","currency":"BTC_USDT"}]
*/
//@version=5
strategy(title="Range Filter Buy and Sell Strategies", shorttitle="Range Filter Strategies", overlay=true,pyramiding = 5)
// Original Script > @DonovanWall
// Adapted Version > @guikroth
//
// Updated PineScript to version 5
// Republished by > @tvenn
// Strategizing by > @RonLeigh
//////////////////////////////////////////////////////////////////////////
// Settings for 5min chart, BTCUSDC. For Other coin, change the parameters
//////////////////////////////////////////////////////////////////////////
SS = input.bool(false,"Percentage Take Profit Stop Loss")
longProfitPerc = input.float(title='LongProfit(%)', minval=0.0, step=0.1, defval=1.5) * 0.01
shortProfitPerc = input.float(title='ShortProfit(%)', minval=0.0, step=0.1, defval=1.5) * 0.01
longLossPerc = input.float(title='LongStop(%)', minval=0.0, step=0.1, defval=1.5) * 0.01
shortLossPerc = input.float(title='ShortStop(%)', minval=0.0, step=0.1, defval=1.5) * 0.01
// Color variables
upColor = color.white
midColor = #90bff9
downColor = color.blue
// Source
src = input(defval=close, title="Source")
// Sampling Period
// Settings for 5min chart, BTCUSDC. For Other coin, change the paremeters
per = input.int(defval=100, minval=1, title="Sampling Period")
// Range Multiplier
mult = input.float(defval=3.0, minval=0.1, title="Range Multiplier")
// Smooth Average Range
smoothrng(x, t, m) =>
wper = t * 2 - 1
avrng = ta.ema(math.abs(x - x[1]), t)
smoothrng = ta.ema(avrng, wper) * m
smoothrng
smrng = smoothrng(src, per, mult)
// Range Filter
rngfilt(x, r) =>
rngfilt = x
rngfilt := x > nz(rngfilt[1]) ? x - r < nz(rngfilt[1]) ? nz(rngfilt[1]) : x - r :
x + r > nz(rngfilt[1]) ? nz(rngfilt[1]) : x + r
rngfilt
filt = rngfilt(src, smrng)
// Filter Direction
upward = 0.0
upward := filt > filt[1] ? nz(upward[1]) + 1 : filt < filt[1] ? 0 : nz(upward[1])
downward = 0.0
downward := filt < filt[1] ? nz(downward[1]) + 1 : filt > filt[1] ? 0 : nz(downward[1])
// Target Bands
hband = filt + smrng
lband = filt - smrng
// Colors
filtcolor = upward > 0 ? upColor : downward > 0 ? downColor : midColor
barcolor = src > filt and src > src[1] and upward > 0 ? upColor :
src > filt and src < src[1] and upward > 0 ? upColor :
src < filt and src < src[1] and downward > 0 ? downColor :
src < filt and src > src[1] and downward > 0 ? downColor : midColor
filtplot = plot(filt, color=filtcolor, linewidth=2, title="Range Filter")
// Target
hbandplot = plot(hband, color=color.new(upColor, 70), title="High Target")
lbandplot = plot(lband, color=color.new(downColor, 70), title="Low Target")
// Fills
fill(hbandplot, filtplot, color=color.new(upColor, 90), title="High Target Range")
fill(lbandplot, filtplot, color=color.new(downColor, 90), title="Low Target Range")
// Bar Color
barcolor(barcolor)
// Break Outs
longCond = bool(na)
shortCond = bool(na)
longCond := src > filt and src > src[1] and upward > 0 or
src > filt and src < src[1] and upward > 0
shortCond := src < filt and src < src[1] and downward > 0 or
src < filt and src > src[1] and downward > 0
CondIni = 0
CondIni := longCond ? 1 : shortCond ? -1 : CondIni[1]
longCondition = longCond and CondIni[1] == -1
shortCondition = shortCond and CondIni[1] == 1
// alertcondition(longCondition, title="Buy alert on Range Filter", message="Buy alert on Range Filter")
// alertcondition(shortCondition, title="Sell alert on Range Filter", message="Sell alert on Range Filter")
// alertcondition(longCondition or shortCondition, title="Buy and Sell alert on Range Filter", message="Buy and Sell alert on Range Filter")
////////////// 副
sensitivity = input(150, title='Sensitivity')
fastLength = input(20, title='FastEMA Length')
slowLength = input(40, title='SlowEMA Length')
channelLength = input(20, title='BB Channel Length')
multt = input(2.0, title='BB Stdev Multiplier')
DEAD_ZONE = nz(ta.rma(ta.tr(true), 100)) * 3.7
calc_macd(source, fastLength, slowLength) =>
fastMA = ta.ema(source, fastLength)
slowMA = ta.ema(source, slowLength)
fastMA - slowMA
calc_BBUpper(source, length, multt) =>
basis = ta.sma(source, length)
dev = multt * ta.stdev(source, length)
basis + dev
calc_BBLower(source, length, multt) =>
basis = ta.sma(source, length)
dev = multt * ta.stdev(source, length)
basis - dev
t1 = (calc_macd(close, fastLength, slowLength) - calc_macd(close[1], fastLength, slowLength)) * sensitivity
e1 = calc_BBUpper(close, channelLength, multt) - calc_BBLower(close, channelLength, multt)
trendUp = t1 >= 0 ? t1 : 0
trendDown = t1 < 0 ? -1 * t1 : 0
duoad = trendUp > 0 and trendUp > e1
kongad = trendDown > 0 and trendDown > e1
duo = longCondition and duoad
kong = shortCondition and kongad
//Alerts
plotshape(longCondition and trendUp > e1 and trendUp > 0 , title="Buy Signal", text="Buy", textcolor=color.white, style=shape.labelup, size=size.small, location=location.belowbar, color=color.new(#aaaaaa, 20))
plotshape(shortCondition and trendDown > e1 and trendDown > 0 , title="Sell Signal", text="Sell", textcolor=color.white, style=shape.labeldown, size=size.small, location=location.abovebar, color=color.new(downColor, 20))
if longCondition and trendUp > e1 and trendUp > 0
strategy.entry('Long',strategy.long, comment = "buy" )
if shortCondition and trendDown > e1 and trendDown > 0
strategy.entry('Short',strategy.short, comment = "sell" )
longlimtPrice = strategy.position_avg_price * (1 + longProfitPerc)
shortlimtPrice = strategy.position_avg_price * (1 - shortProfitPerc)
longStopPrice = strategy.position_avg_price * (1 - longLossPerc)
shortStopPrice = strategy.position_avg_price * (1 + shortLossPerc)
if (strategy.position_size > 0) and SS == true
strategy.exit(id="Long",comment_profit = "Profit",comment_loss = "StopLoss", stop=longStopPrice,limit = longlimtPrice)
if (strategy.position_size < 0) and SS == true
strategy.exit(id="Short",comment_profit = "Profit",comment_loss = "StopLoss", stop=shortStopPrice,limit = shortlimtPrice)