Các chỉ số kép Combo Crazy Intraday Scalping Strategy

Tác giả:ChaoZhang, Ngày: 2023-12-01 14:47:57
Tags:

img

Tổng quan

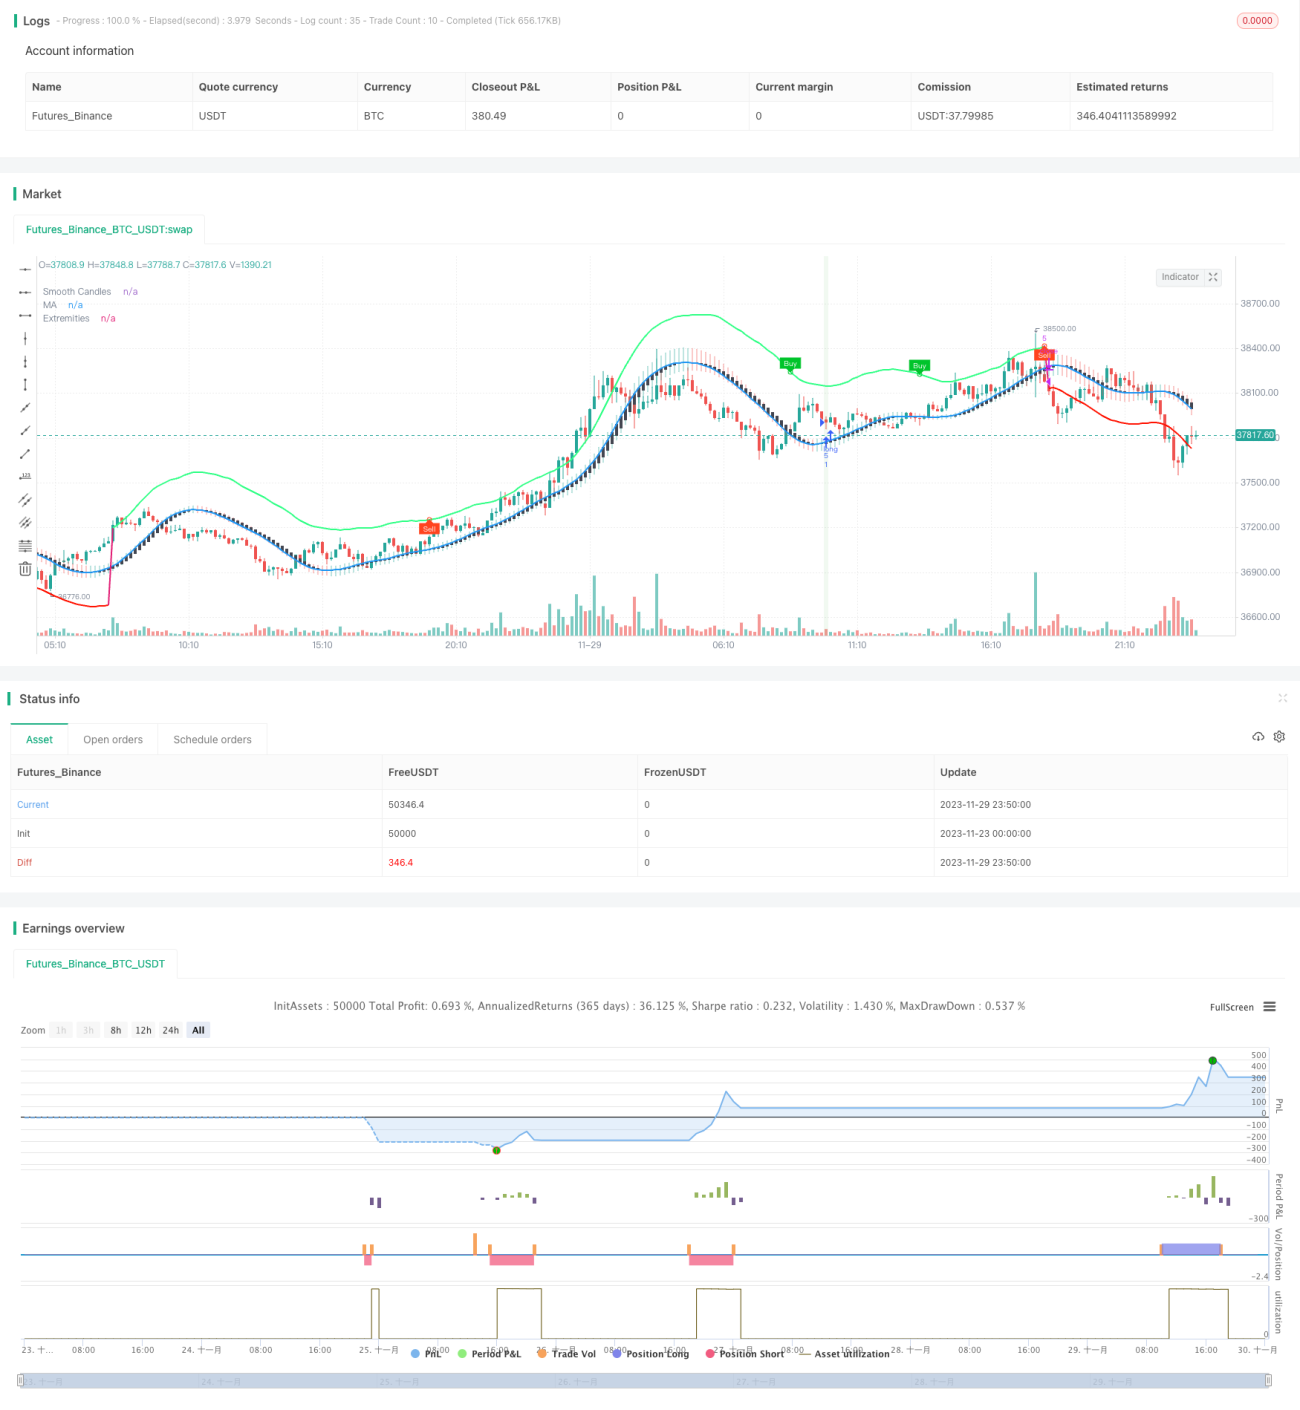
Chiến lược này kết hợp các tín hiệu mua và bán từ các chỉ số TMO và AMA của LuxAlgo để bắt đầu một xu hướng trong quá trình củng cố giới hạn phạm vi. Nó đi dài hoặc ngắn khi các điều kiện của tín hiệu TMO, cực AMA và tăng kích thước thân nến được đáp ứng. Stop loss được đặt ở mức dao động cao / thấp nhất dựa trên các thanh gần đây.

Chiến lược logic

Chỉ số TMO phản ánh đà tăng giá. Nó thuộc loại chỉ số dao động và có thể tạo ra tín hiệu giao dịch khi xảy ra chênh lệch. Chỉ số AMA là một đường trung bình động trơn. Nó cho thấy một loạt các biến động giá, chỉ ra các điều kiện mua quá mức / bán quá mức khi giá tiếp cận dải trên / dưới.

Định nghĩa chính đằng sau chiến lược này là: TMO có thể phát hiện sự khác biệt xu hướng để tạo ra tín hiệu giao dịch. AMA có thể xác định các vùng đảo ngược giá. Cùng với xác nhận từ việc tăng kích thước thân nến, họ có thể cải thiện độ chính xác của việc bắt bắt đầu xu hướng. Vì vậy, chiến lược sẽ đi dài / ngắn khi:

  1. TMO cung cấp tín hiệu mua, tức là chênh lệch tăng và AMA cho thấy cực độ tối đa của nó
  2. TMO cung cấp tín hiệu bán. tức là chênh lệch giảm và AMA cho thấy cực thấp nhất
  3. Cũng đòi hỏi cơ thể nến mới nhất 3 để mở rộng kích thước

Điều này giải quyết vấn đề tín hiệu sai của chỉ số duy nhất.

Ưu điểm

Những lợi thế của chiến lược này bao gồm:

  1. Indicator combo cải thiện độ chính xác tín hiệu. TMO và AMA xác nhận lẫn nhau để giảm tín hiệu sai và cải thiện độ chính xác.

  2. Nhiều điều kiện bắt đầu xu hướng. Sự kết hợp của tín hiệu TMO, cực AMA và tăng kích thước nến cho phép chiến lược xác định hiệu quả sự khởi đầu xu hướng, mà các chiến lược bán đầu scalping theo đuổi.

  3. Bằng cách sử dụng các thanh gần đây giá cao nhất / thấp nhất như là stop loss, nó kiểm soát rủi ro của mỗi giao dịch trong khi tránh rủi ro chậm lại từ tính toán lại chỉ số.

  4. Có chỉ hai chỉ số, chiến lược đã thực hiện một hệ thống scalping hoàn chỉnh với logic rõ ràng và đơn giản.

Rủi ro

Những rủi ro chính của chiến lược:

  1. Rủi ro giao dịch thường xuyên. Là một chiến lược bán da có mục tiêu thời gian nắm giữ ngắn, chi phí giao dịch cao có thể ảnh hưởng đến lợi nhuận của nó.

  2. Nguy cơ dừng lỗ hung hăng. Bằng cách sử dụng giá cực đoan gần đây cho dừng lỗ, nó có thể dễ bị nhiễu thị trường và làm tăng cơ hội kích hoạt dừng lỗ.

  3. Rủi ro tối ưu hóa tham số khó khăn. Chiến lược liên quan đến nhiều tham số. Tìm kiếm sự kết hợp tham số tối ưu có thể là một thách thức.

Tối ưu hóa

Chiến lược có thể được tối ưu hóa hơn nữa trong các lĩnh vực sau:

  1. Thêm nhiều chỉ số lọc như âm lượng để loại bỏ tín hiệu sai và cải thiện chất lượng tín hiệu hơn nữa.

  2. Thử sửa đổi các quy tắc dừng lỗ để làm cho nó ít hung hăng hơn, ví dụ: thêm các thanh xác nhận trước khi kích hoạt dừng lỗ.

  3. Thực hiện tối ưu hóa tham số để tìm kết hợp tham số tốt nhất cho các chỉ số, có thể giúp lọc ra nhiều tiếng ồn hơn và tăng tỷ lệ thắng.

  4. Kiểm tra lại và giao dịch trực tiếp trên các sản phẩm và khung thời gian khác nhau để tìm ra điều kiện thị trường phù hợp nhất với logic chiến lược này.

Kết luận

Chiến lược này kết hợp các tín hiệu giao dịch từ TMO và AMA vào da đầu trong các thị trường giới hạn phạm vi bằng cách nắm bắt các chuyển động xu hướng sớm. Nó có lợi thế chính xác tín hiệu cao, nắm bắt xu hướng sớm và kiểm soát rủi ro hiệu quả.


/*backtest
start: 2023-11-23 00:00:00
end: 2023-11-30 00:00:00
period: 10m
basePeriod: 1m
exchanges: [{"eid":"Futures_Binance","currency":"BTC_USDT"}]
*/

// This source code is subject to the terms of the Mozilla Public License 2.0 at https://mozilla.org/MPL/2.0/
// © Kaspricci

//@version=5
strategy("TradeIQ - Crazy Scalping Trading Strategy [Kaspricci]", overlay=true, initial_capital = 1000, currency = currency.USD)

headlineTMO = "TMO Settings"

tmoLength   = input.int(7, "TMO Length", minval = 1, group = headlineTMO)
tmoSource   = input.source(close, "TMO Source", group = headlineTMO)

// calculate values
osc         = ta.mom(ta.sma(ta.sma(tmoSource, tmoLength), tmoLength), tmoLength)

// determine color of historgram
oscColor    = osc > osc[1] and osc > 0 ? #00c42b : osc < osc[1] and osc > 0 ? #4ee567 : osc < osc[1] and osc < 0 ? #ff441f : osc > osc[1] and osc < 0 ? #c03920 : na

// plot histogram
//plot(osc, "OSC", oscColor, linewidth = 3, style = plot.style_histogram)

// conditon to find highs and lows
up          = ta.highest(tmoSource, tmoLength)
dn          = ta.lowest(tmoSource, tmoLength)

// define conditions to be used for finding divergence
phosc = ta.crossunder(ta.change(osc), 0)
plosc = ta.crossover (ta.change(osc), 0)

// test for divergence
bear = osc > 0 and phosc and ta.valuewhen(phosc,osc,0) < ta.valuewhen(phosc,osc,1) and ta.valuewhen(phosc,up,0) > ta.valuewhen(phosc,up,1) ? 1 : 0
bull = osc < 0 and plosc and ta.valuewhen(plosc,osc,0) > ta.valuewhen(plosc,osc,1) and ta.valuewhen(plosc,dn,0) < ta.valuewhen(plosc,dn,1) ? 1 : 0

// -------------------------------------------------------------------------------------------------------------

headlineAMA = "AMA Settings"

amaSource   = input.source(defval = close, title = "AMA Source", group = headlineAMA)
amaLength   = input.int(defval = 50, title = "AMA Length", minval = 2, group = headlineAMA)


amaMulti    = input.float(defval = 2.0, title = "Factor", minval = 1)

amaShowCd   = input(defval = true , title = "As Smoothed Candles")
amaShowEx   = input(defval = true,   title = "Show Alternating Extremities")

amaAlpha    = input.float(1.0, "Lag",       minval=0, step=.1, tooltip='Control the lag of the moving average (higher = more lag)', group= 'AMA Kernel Parameters')
amaBeta     = input.float(0.5, "Overshoot", minval=0, step=.1, tooltip='Control the overshoot amplitude of the moving average (higher = overshoots with an higher amplitude)', group='AMA Kernel Parameters')

// -------------------------------------------------------------------------------------------------------------

headlineSL = "Stop Loss Settings"

slLength    = input.int(defval = 10, title = "SL Period", minval = 1, group = headlineSL, tooltip = "Number of bars for swing high / low")

// -------------------------------------------------------------------------------------------------------------

var b       = array.new_float(0)
var float x = na

if barstate.isfirst
    for i = 0 to amaLength - 1
        x := i / (amaLength - 1)
        w = math.sin(2 * 3.14159 * math.pow(x, amaAlpha)) * (1 - math.pow(x, amaBeta))
        array.push(b, w)

// local function to filter the source
filter(series float x) =>
    sum = 0.

    for i = 0 to amaLength - 1
        sum := sum + x[i] * array.get(b,i)
    
    sum / array.sum(b)

// apply filter function on source series

srcFiltered = filter(amaSource)

deviation   = ta.sma(math.abs(amaSource - srcFiltered), amaLength) * amaMulti

upper       = srcFiltered + deviation
lower       = srcFiltered - deviation

//----
crossHigh   = ta.cross(high, upper)
crossLow    = ta.cross(low, lower)

var os      = 0
os          := crossHigh ? 1 : crossLow ? 0 : os[1]

ext         = os * upper + (1 - os) * lower

//----
os_css = ta.rsi(srcFiltered, amaLength) / 100

extColor    = os == 1 ? #30FF85 : #ff1100

plot(srcFiltered, "MA", amaShowCd ? na : color.black, 2, editable = false)
plot(amaShowEx ? ext : na, "Extremities", ta.change(os) ? na : extColor, 2, editable=false)

// handle smoothed candles
var float h = na
var float l = na
var float c = na
var float body = na

if amaShowCd
    h := filter(high)
    l := filter(low)
    c := filter(amaSource)
    body := math.abs(math.avg(c[1], c[2]) - c)

ohlc_os = ta.rsi(c, amaLength) / 100

plotcandle(math.avg(c[1], c[2]), h, l, c, "Smooth Candles", #434651, bordercolor = na, editable = false, display = amaShowCd ? display.all : display.none)

// -------------------------------------------------------------------------------------------------------------

plotshape(bull ? ext : na, "Bullish Circle", shape.circle,    location.absolute, color = #00c42b, size=size.tiny)
plotshape(bear ? ext : na, "Bearish Circle", shape.circle,    location.absolute, color = #ff441f, size=size.tiny)
plotshape(bull ? ext : na, "Bullish Label",  shape.labeldown, location.absolute, color = #00c42b, text="Buy", textcolor=color.white, size=size.tiny)
plotshape(bear ? ext : na, "Bearish Label",  shape.labelup,   location.absolute, color = #ff441f, text="Sell", textcolor=color.white, size=size.tiny)

// -------------------------------------------------------------------------------------------------------------

candleSizeIncreasing = body[2] < body[1] and body[1] < body[0]

longEntryCond   = os == 1 and bull
shortEntryCond  = os == 0 and bear

longEntry       = strategy.opentrades == 0 and candleSizeIncreasing and not candleSizeIncreasing[1] and ta.barssince(longEntryCond)  < ta.barssince(os == 0) and ta.barssince(longEntryCond) < ta.barssince(bear)
shortEntry      = strategy.opentrades == 0 and candleSizeIncreasing and not candleSizeIncreasing[1] and ta.barssince(shortEntryCond) < ta.barssince(os == 1) and ta.barssince(shortEntryCond) < ta.barssince(bull)

longExit        = strategy.opentrades > 0 and strategy.position_size > 0 and (bear or os == 0)
shortExit       = strategy.opentrades > 0 and strategy.position_size < 0 and (bull or os == 1)

recentSwingHigh = ta.highest(high, slLength) // highest high of last candles
recentSwingLow  = ta.lowest(low,   slLength) // lowest low of recent candles

bgcolor(longEntry  ? color.rgb(76, 175, 79, 90) : na)
bgcolor(shortEntry ? color.rgb(255, 82, 82, 90) : na)

slLong          = (close - recentSwingLow) / syminfo.mintick  // stop loss in ticks
slShort         = (recentSwingHigh - close) / syminfo.mintick // stop loss in ticks

newOrderID         = str.tostring(strategy.closedtrades + strategy.opentrades + 1)
curOrderID         = str.tostring(strategy.closedtrades + strategy.opentrades)

alertMessageForEntry = "Trade {0} - New {1} Entry at price: {2} with stop loss at: {3}"

if (longEntry)
    alertMessage = str.format(alertMessageForEntry, newOrderID, "Long", close, recentSwingLow)
    
    strategy.entry(newOrderID, strategy.long, alert_message = alertMessage)
    strategy.exit("Stop Loss Long", newOrderID, loss = slLong, alert_message = "Stop Loss for Trade " + newOrderID)

if(longExit)
    strategy.close(curOrderID, alert_message = "Close Trade " + curOrderID)

if (shortEntry)
    alertMessage = str.format(alertMessageForEntry, newOrderID, "Short", close, recentSwingLow)

    strategy.entry(newOrderID, strategy.short, alert_message = alertMessage)
    strategy.exit("Stop Loss Short", newOrderID, loss = slShort, alert_message = "Stop Loss for Trade " + newOrderID)

if(shortExit)
    strategy.close(curOrderID, alert_message = "Close Trade " + curOrderID)

Thêm nữa