
Chiến lược này được thiết kế dựa trên các chỉ số của Tiến sĩ John Ehlers, Trend Flex Oscillator (TFO) và Average True Range (ATR). Nó áp dụng cho thị trường đa đầu, mở vị trí đa đầu khi có sự đảo ngược của giá sau khi Bổ sung. Nó thường sẽ bình thường trong vài ngày, trừ khi bị bắt bởi thị trường gấu, trong trường hợp đó nó sẽ giữ vị trí.
Chiến lược này kết hợp hai chỉ số TFO và ATR, mở nhiều vị trí khi đáp ứng các điều kiện mua và bán khi đáp ứng các điều kiện bán.
Điều kiện mua: Khi TFO thấp hơn một ngưỡng nhất định (để biểu thị lỗ hổng quá mức) và giá trị TFO của đường K trên thấp hơn đường K hiện tại (để biểu thị TFO tăng ngược) và ATR cao hơn ngưỡng biến động được thiết lập (để biểu thị sự biến động của thị trường tăng lên), đáp ứng ba điều kiện này sẽ mở nhiều vị trí.
Điều kiện thanh toán: Khi TFO cao hơn một ngưỡng (được biểu thị là quá nhiều đầu) và ATR cao hơn ngưỡng thiết lập, tất cả các vị trí thanh toán sẽ được thanh toán. Ngoài ra, chiến lược này cũng thiết lập một lệnh dừng theo dõi, và tất cả các vị trí thanh toán sẽ được thanh toán khi giá giảm xuống mức giá dừng theo dõi. Người dùng có thể chọn để chiến lược thanh toán theo tín hiệu chỉ số hoặc chỉ dừng theo mức giá thanh toán.
Chiến lược này có thể mở nhiều hơn 15 vị trí đầu tư cùng một lúc. Các tham số có thể được điều chỉnh để phù hợp với các khoảng thời gian khác nhau.
Kết hợp xu hướng và độ biến động để xác định hướng thị trường, tương đối ổn định. TFO có thể nắm bắt các tín hiệu sớm của xu hướng phá vỡ, ATR có thể nắm bắt thời điểm thị trường biến động.
Cài đặt tham số mua bán và dừng lỗ có thể điều chỉnh được, hoạt động linh hoạt. Người dùng có thể điều chỉnh tham số theo thị trường để tối ưu hóa.
Cấu hình dừng lỗ được xây dựng để giảm thiểu tổn thất trong các tình huống cực đoan. Chiến lược dừng lỗ là một phần rất quan trọng trong giao dịch định lượng.
Hỗ trợ mở thêm vị trí và bán vị trí, có thể tăng lợi nhuận bằng cách tăng vị trí.
Chiến lược này chỉ làm quá nhiều, không làm rỗng, không thể kiếm lợi nhuận trong thị trường giảm. Nếu gặp phải một thị trường gấu thảm khốc, có thể gây ra thiệt hại lớn.
Thiết lập tham số không đúng có thể dẫn đến giao dịch quá mức hoặc bán tháo. Cần thử nghiệm nhiều lần để tìm ra sự kết hợp tham số tối ưu.
Trong trường hợp cực đoan, dừng lỗ có thể không có hiệu quả và không thể ngăn chặn tổn thất lớn. Đây là vấn đề mà tất cả các chiến lược dừng lỗ có thể gặp phải.
Đánh giá không thể phản ánh hoàn toàn giao dịch trên sàn giao dịch thực, kết quả trên sàn giao dịch thực sẽ có một sai lệch nhất định.
Bạn có thể xem xét thêm đường dừng di động trong điều kiện bán để chiến lược dừng lỗ kịp thời và kiểm soát hiệu quả rủi ro giảm giá.
Có thể mở rộng cơ chế làm trắng, mở lỗ khi TFO đảo ngược giảm và ATR đủ lớn, để chiến lược có thể áp dụng cho thị trường trống.
Có thể thêm các điều kiện lọc, chẳng hạn như thay đổi khối lượng giao dịch, để giảm tác động của hành vi bất thường đối với chiến lược.
Các thiết lập tham số và kết quả đo lại có thể được thử nghiệm trong các chu kỳ thời gian khác nhau để tìm kiếm chu kỳ và sự kết hợp tham số tối ưu.
Chiến lược này tích hợp các ưu điểm của phân tích xu hướng và giám sát biến động, đánh giá hướng thị trường thông qua các chỉ số kết hợp của TFO và ATR; thiết lập các cơ chế như mở thêm vị trí, bán vị trí, dừng lỗ di chuyển, để tăng lợi nhuận và kiểm soát rủi ro, phù hợp với hoạt động đa đầu; còn có không gian tối ưu hóa có thể mở rộng, có thể cải thiện hơn nữa hiệu suất chiến lược bằng cách thêm các bộ lọc chỉ số và điều chỉnh tham số.
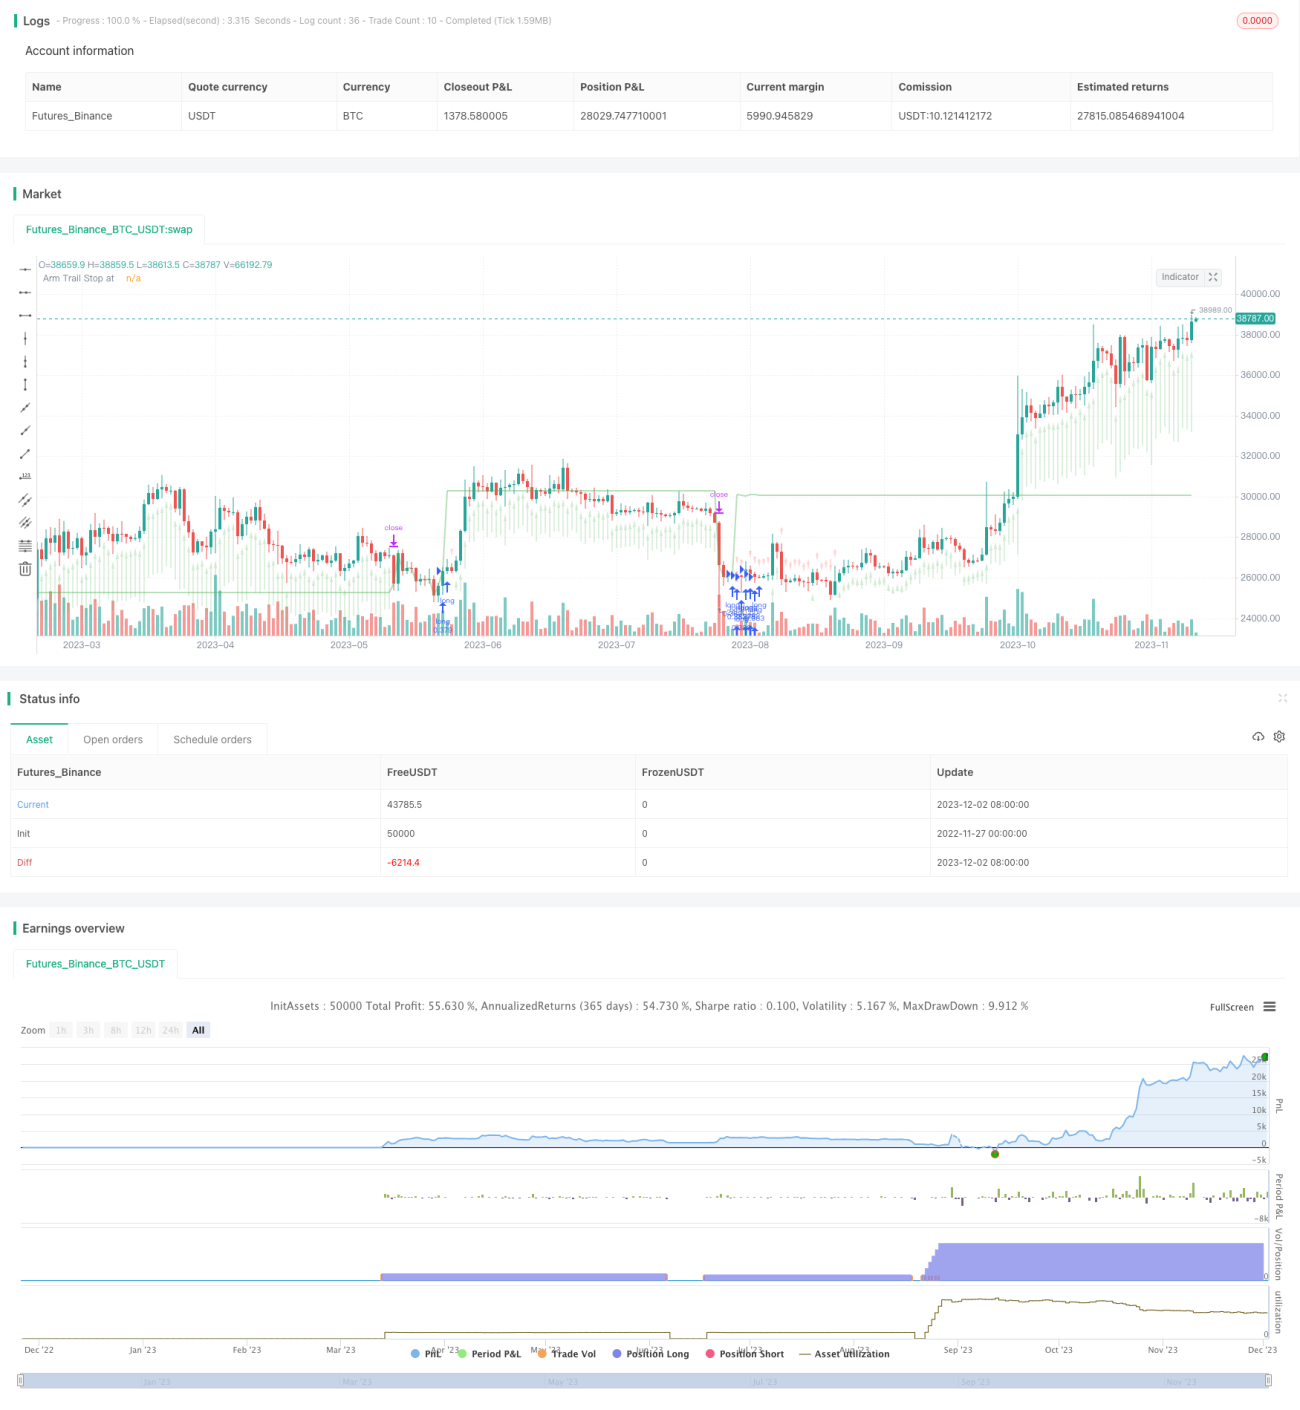
/*backtest
start: 2022-11-27 00:00:00
end: 2023-12-03 00:00:00
period: 1d
basePeriod: 1h
exchanges: [{"eid":"Futures_Binance","currency":"BTC_USDT"}]
*/
// This source code is subject to the terms of the Mozilla Public License 2.0 at https://mozilla.org/MPL/2.0/
// © Chart0bserver
//
// Open Source attributions:
// portions © allanster (date window code)
// portions © Dr. John Ehlers (Trend Flex Oscillator)
//
// READ THIS CAREFULLY!!! ----------------//
// This code is provided for educational purposes only. The results of this strategy should not be considered investment advice.
// The user of this script acknolwedges that it can cause serious financial loss when used as a trading tool
// This strategy has a bias for HODL (Holds on to Losses) meaning that it provides NO STOP LOSS protection!
// Also note that the default behavior is designed for up to 15 open long orders, and executes one order to close them all at once.
// Opening a long position is predicated on The Trend Flex Oscillator (TFO) rising after being oversold, and ATR above a certain volatility threshold.
// Closing a long is handled either by TFO showing overbought while above a certain ATR level, or the Trailing Stop Loss. Pick one or both.
// If the strategy is allowed to sell before a Trailing Stop Loss is triggered, you can set a "must exceed %". Do not mistake this for a stop loss.
// Short positions are not supported in this version. Back-testing should NEVER be considered an accurate representation of actual trading results.
//@version=5
strategy('TFO + ATR Strategy with Trailing Stop Loss', 'TFO ATR Trailing Stop Loss', overlay=true, pyramiding=15, default_qty_type=strategy.cash, default_qty_value=10000, initial_capital=150000, currency='USD', commission_type=strategy.commission.percent, commission_value=0.5)
strategy.risk.allow_entry_in(strategy.direction.long) // There will be no short entries, only exits from long.
// -----------------------------------------------------------------------------------------------------------//
// Back-testing Date Range code ----------------------------------------------------------------------------//
// ---------------------------------------------------------------------------------------------------------//
fromMonth = input.int(defval=9, title='From Month', minval=1, maxval=12, group='Back-Testing Start Date')
fromDay = input.int(defval=1, title='From Day', minval=1, maxval=31, group='Back-Testing Start Date')
fromYear = input.int(defval=2021, title='From Year', minval=1970, group='Back-Testing Start Date')
thruMonth = 1 //input(defval = 1, title = "Thru Month", type = input.integer, minval = 1, maxval = 12, group="Back-Testing Date Range")
thruDay = 1 //input(defval = 1, title = "Thru Day", type = input.integer, minval = 1, maxval = 31, group="Back-Testing Date Range")
thruYear = 2112 //input(defval = 2112, title = "Thru Year", type = input.integer, minval = 1970, group="Back-Testing Date Range")
// === FUNCTION EXAMPLE ===
start = timestamp(fromYear, fromMonth, fromDay, 00, 00) // backtest start window
finish = timestamp(thruYear, thruMonth, thruDay, 23, 59) // backtest finish window
window() => // create function "within window of time
time >= start and time <= finish ? true : false
// Date range code -----//
// -----------------------------------------------------------------------------------------------------------//
// ATR Indicator Code --------------------------------------------------------------------------------------//
// ---------------------------------------------------------------------------------------------------------//
length = 18 //input(title="ATR Length", defval=18, minval=1)
Period = 18 //input(18,title="ATR EMA Period")
basicEMA = ta.ema(close, length)
ATR_Function = ta.ema(ta.tr(true), length)
EMA_ATR = ta.ema(ATR_Function, Period)
ATR = ta.ema(ta.tr(true), length)
ATR_diff = ATR - EMA_ATR
volatility = 100 * ATR_diff / EMA_ATR // measure of spread between ATR and EMA
volatilityAVG = math.round((volatility + volatility[1] + volatility[2]) / 3)
buyVolatility = input.int(3, 'Min Volatility for Buy', minval=-20, maxval=20, step=1, group='Average True Range')
sellVolatility = input.int(13, 'Min Volatility for Sell', minval=-10, maxval=20, step=1, group='Average True Range')
useAvgVolatility = input.bool(defval=false, title='Average the Volatility over 3 bars', group='Average True Range')
// End of ATR ------------/
// -----------------------------------------------------------------------------------------------------------//
// TFO Indicator code --------------------------------------------------------------------------------------//
// ---------------------------------------------------------------------------------------------------------//
trendflex(Series, PeriodSS, PeriodTrendFlex, PeriodEMA) =>
var SQRT2xPI = math.sqrt(8.0) * math.asin(1.0) // 4.44288293815 Constant
alpha = SQRT2xPI / PeriodSS
beta = math.exp(-alpha)
gamma = -beta * beta
delta = 2.0 * beta * math.cos(alpha)
float superSmooth = na
superSmooth := (1.0 - delta - gamma) * (Series + nz(Series[1])) * 0.5 + delta * nz(superSmooth[1]) + gamma * nz(superSmooth[2])
E = 0.0
for i = 1 to PeriodTrendFlex by 1
E += superSmooth - nz(superSmooth[i])
E
epsilon = E / PeriodTrendFlex
zeta = 2.0 / (PeriodEMA + 1.0)
float EMA = na
EMA := zeta * epsilon * epsilon + (1.0 - zeta) * nz(EMA[1])
return_1 = EMA == 0.0 ? 0.0 : epsilon / math.sqrt(EMA)
return_1
upperLevel = input.float(1.2, 'TFO Upper Level', minval=0.1, maxval=2.0, step=0.1, group='Trend Flex Ocillator')
lowerLevel = input.float(-0.9, 'TFO Lower Level', minval=-2.0, maxval=-0.1, step=0.1, group='Trend Flex Ocillator')
periodTrendFlex = input.int(14, 'TrendFlex Period', minval=2, group='Trend Flex Ocillator')
useSuperSmootherOveride = true //input( true, "Apply SuperSmoother Override Below*", input.bool, group="Trend Flex Ocillator")
periodSuperSmoother = 8.0 //input(8.0, "SuperSmoother Period*", input.float , minval=4.0, step=0.5, group="Trend Flex Ocillator")
postSmooth = 33 //input(33.0, "Post Smooth Period**", input.float , minval=1.0, step=0.5, group="Trend Flex Ocillator")
trendFlexOscillator = trendflex(close, periodSuperSmoother, periodTrendFlex, postSmooth)
// End of TFO -------------//
// -----------------------------------------------------------------------------------------------------------//
// HODL Don't sell if losing n% ---------------------------------------------------------------------------- //
// ---------------------------------------------------------------------------------------------------------//
sellOnStrategy = input.bool(defval=true, title='Allow Stategy to close positions', group='Selling Conditions')
doHoldLoss = true // input(defval = true, title = "Strategy can sell for a loss", type = input.bool, group="Selling Conditions")
holdLoss = input.int(defval=0, title='Value (%) must exceed ', minval=-25, maxval=10, step=1, group='Selling Conditions')
totalInvest = strategy.position_avg_price * strategy.position_size
openProfitPerc = strategy.openprofit / totalInvest
bool acceptableROI = openProfitPerc * 100 > holdLoss
// -----------------------//
// -----------------------------------------------------------------------------------------------------------//
// Buying and Selling conditions -------------------------------------------------------------------------- //
// ---------------------------------------------------------------------------------------------------------//
if useAvgVolatility
volatility := volatilityAVG
volatility
tfoBuy = trendFlexOscillator < lowerLevel and trendFlexOscillator[1] < trendFlexOscillator // Always make a purchase if TFO is in this lowest range
atrBuy = volatility > buyVolatility
tfoSell = ta.crossunder(trendFlexOscillator, upperLevel)
consensusBuy = tfoBuy and atrBuy
consensusSell = tfoSell and volatility > sellVolatility
if doHoldLoss
consensusSell := consensusSell and acceptableROI
consensusSell
// --------------------//
// -----------------------------------------------------------------------------------------------------------//
// Tracing & Debugging --------------------------------------------------------------------------------------//
// ---------------------------------------------------------------------------------------------------------//
plotchar(strategy.opentrades, 'Number of open trades', ' ', location.top)
plotarrow(100 * openProfitPerc, 'Profit on open longs', color.new(color.green, 75), color.new(color.red, 75))
// plotchar(strategy.position_size, "Shares on hand", " ", location.top)
// plotchar(totalInvest, "Total Invested", " ", location.top)
// plotarrow(strategy.openprofit, "Open profit dollar amount", color.new(color.green,100), color.new(color.red, 100))
// plotarrow(strategy.netprofit, "Net profit for session", color.new(color.green,100), color.new(color.red, 100))
// plotchar(acceptableROI, "Acceptable ROI", " ", location.top)
// plotarrow(volatility, "ATR volatility value", color.new(color.green,75), color.new(color.red, 75))
// plotchar(strategy.position_avg_price, "Avgerage price of holdings", " ", location.top)
// plotchar(volatilityAVG, "AVG volatility", " ", location.top)
// plotchar(fiveBarsVal, "change in 5bars", " ", location.top)
// plotchar(crossingUp, "crossingUp", "x", location.belowbar, textcolor=color.white)
// plotchar(crossingDown, "crossingDn", "x", location.abovebar, textcolor=color.white)
// plotchar(strategy.closedtrades, "closedtrades", " ", location.top)
// plotchar(strategy.wintrades, "wintrades", " ", location.top)
// plotchar(strategy.losstrades, "losstrades", " ", location.top)
// plotchar(close, "close", " ", location.top)
//--------------------//
// -----------------------------------------------------------------------------------------------------------//
// Trade Alert Execution ------------------------------------------------------------------------------------//
// ---------------------------------------------------------------------------------------------------------//
strategy.entry('long', strategy.long, when=window() and consensusBuy, comment='long')
if sellOnStrategy
strategy.close('long', when=window() and consensusSell, qty_percent=100, comment='Strat')
// -----------------------------------------------------------------------------------------------------------//
// Trailing Stop Loss logic -------------------------------------------------------------------------------- //
// ---------------------------------------------------------------------------------------------------------//
useTrailStop = input.bool(defval=true, title='Set Trailing Stop Loss on avg positon value', group='Selling Conditions')
arm = input.float(defval=15, title='Trailing Stop Arms At (%)', minval=1, maxval=30, step=1, group='Selling Conditions') * 0.01
trail = input.float(defval=2, title='Trailing Stop Loss (%)', minval=0.25, maxval=9, step=0.25, group='Selling Conditions') * 0.1
longStopPrice = 0.0
stopLossPrice = 0.0
if strategy.position_size > 0
longStopPrice := strategy.position_avg_price * (1 + arm)
stopLossPrice := strategy.position_avg_price * ((100 - math.abs(holdLoss)) / 100) // for use with 'stop' in strategy.exit
stopLossPrice
else
longStopPrice := close
longStopPrice
// If you want to hide the Trailing Stop Loss threshold (green line), comment this out
plot(longStopPrice, 'Arm Trail Stop at', color.new(color.green, 60), linewidth=2)
if strategy.position_size > 0 and useTrailStop
strategy.exit('exit', 'long', when=window(), qty_percent=100, trail_price=longStopPrice, trail_offset=trail * close / syminfo.mintick, comment='Trail')
//-----------------------------------------------------------------------------------------------------------//