Chiến lược giao dịch swing thích ứng dựa trên sự đột phá giá

1
Follow
1779
Followers
Tổng quan
Chiến lược này dựa trên điểm phá vỡ giá để xác định xu hướng thị trường và kết hợp với các chỉ số tự điều chỉnh để phán đoán xu hướng lớn để nắm bắt cơ hội đảo ngược giá trong ngắn hạn. Chiến lược này phù hợp với giao dịch tiền kỹ thuật số có tỷ lệ biến động cao.
Nguyên tắc chiến lược
- Xác định điểm giá cực là biên giới của kênh. Khi giá tạo ra một mức cao mới hoặc thấp mới, hãy coi điểm đó là biên giới của kênh.
- Tính toán chỉ số biến động tự điều chỉnh MA để đánh giá xu hướng tổng thể.
- Một tín hiệu mua được tạo ra khi giá vượt lên trên kênh; một tín hiệu bán được tạo ra khi giá vượt xuống dưới kênh.
- Thiết lập điểm dừng lỗ. Đặt điểm dừng lỗ cho vị trí dài là 1% giá nhập.
Phân tích lợi thế
- Các kênh giá có khả năng tự điều chỉnh và có thể xác định chính xác các điểm thay đổi.
- Các chỉ số dao động đánh giá xu hướng lớn, tránh mất hướng lớn trong xu hướng dao động.
- Chiến lược đảo ngược, phù hợp để nắm bắt sự phục hồi ngắn hạn của giá.
Phân tích rủi ro
- Trong một thị trường giảm giá lớn và kéo dài, nhiều điểm dừng lỗ có thể được kích hoạt, gây ra tổn thất lớn.
- Trong bối cảnh khủng hoảng, các giao dịch mua bán thường xuyên làm tăng chi phí giao dịch.
- Cần xác định thời gian nhập cảnh bằng tay, giao dịch tự động có rủi ro phù hợp.
Hướng tối ưu hóa
- Tối ưu hóa các tham số của MA để nó có thể đánh giá tốt hơn về xu hướng tổng thể.
- Tăng chỉ số năng lượng, tránh tín hiệu đảo ngược về suy giảm năng lượng.
- Thêm mô hình học máy, tối ưu hóa động của tham số.
Tóm tắt
Chiến lược này có ý tưởng tổng thể rõ ràng và có giá trị thực tế nhất định. Tuy nhiên, vẫn cần chú ý kiểm soát rủi ro giao dịch để tránh gây thiệt hại lớn trong trường hợp cụ thể. Bước tiếp theo có thể được tối ưu hóa từ nhiều chiều như khung tổng thể, tham số chỉ số, kiểm soát rủi ro, làm cho tham số chiến lược và tín hiệu giao dịch đáng tin cậy hơn.
Source
Pine
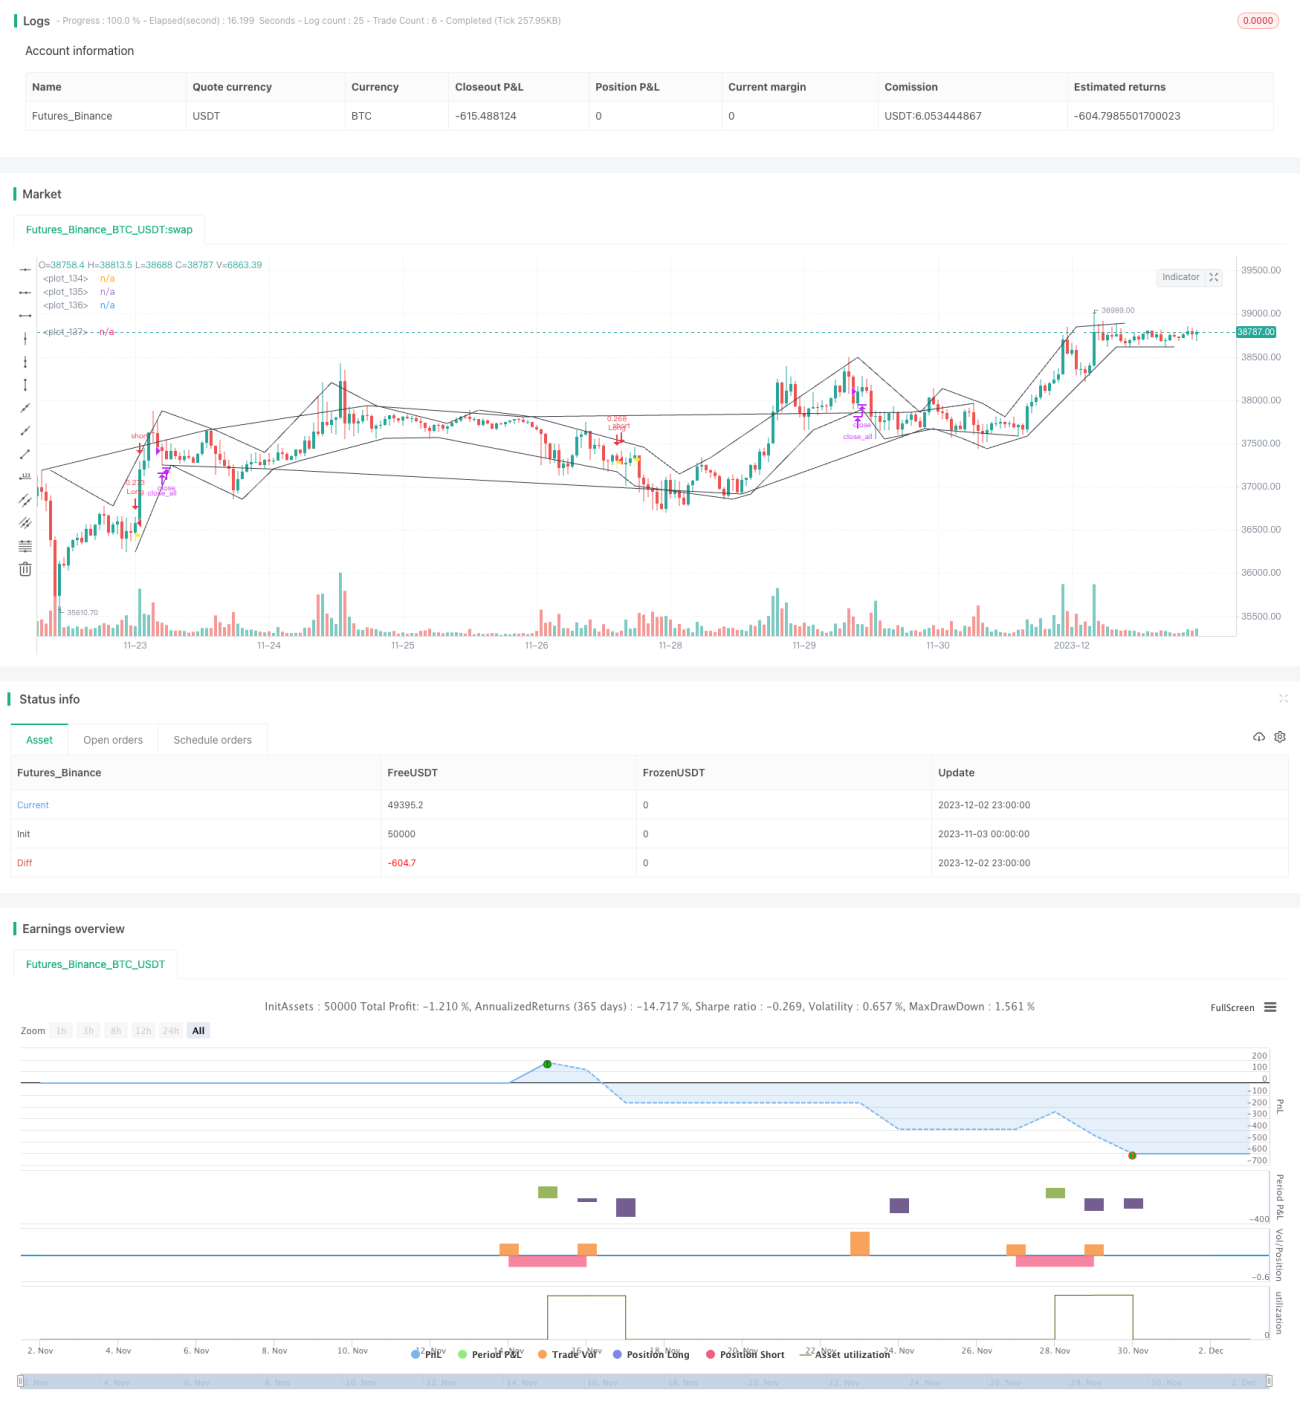
/*backtest
start: 2023-11-03 00:00:00
end: 2023-12-03 00:00:00
period: 1h
basePeriod: 15m
exchanges: [{"eid":"Futures_Binance","currency":"BTC_USDT"}]
*/

// @version = 4
// This source code is subject to the terms of the Mozilla Public License 2.0 at https://mozilla.org/MPL/2.0/
// © TradingGroundhog
Strategy parameters
Related strategies
Comment
All comments (0)
No data
- 1