Chiến lược đảo ngược RSI đa yếu tố


Ngày tạo: 2023-12-06 11:57:29 sửa đổi lần cuối: 2023-12-06 11:57:29
sao chép: 0 Số nhấp chuột: 645
1
tập trung vào
1619
Người theo dõi

Chiến lược đảo ngược RSI đa yếu tố

Tổng quan

Chiến lược này sử dụng chỉ số RSI để xác định hiện tượng quá mua quá bán, kết hợp với nhiều yếu tố phụ trợ như MACD, chỉ số Stochastic. Chiến lược này được thiết kế để nắm bắt cơ hội đảo ngược ngắn hạn, thuộc chiến lược đảo ngược.

Nguyên tắc chiến lược

Chiến lược này chủ yếu sử dụng chỉ số RSI để xác định thị trường có đang mua quá mức hay bán quá mức không. Khi chỉ số RSI vượt quá đường mua quá mức được thiết lập, cho thấy thị trường có thể đang mua quá mức, chiến lược chọn tháo lỗ; Khi chỉ số RSI thấp hơn đường bán quá mức được thiết lập, cho thấy thị trường có thể đang bán quá mức, chiến lược chọn làm nhiều hơn. Bằng cách này, bằng cách nắm bắt các cơ hội giao dịch ngắn hạn phát sinh trong quá trình chuyển đổi từ một trạng thái cực đoan sang một trạng thái cực đoan khác.

Ngoài ra, chiến lược cũng giới thiệu nhiều yếu tố phụ trợ như MACD, Stochastic. Các yếu tố phụ trợ này hoạt động để lọc một số tín hiệu giao dịch sai tích cực có thể xuất hiện. Chiến lược sẽ thực hiện hành động giao dịch thực sự chỉ khi chỉ số RSI phát ra tín hiệu và yếu tố phụ trợ cũng hỗ trợ tín hiệu đó. Cách phối hợp nhiều yếu tố này có thể làm tăng độ tin cậy của tín hiệu chiến lược và do đó tăng sự ổn định của chiến lược.

Phân tích lợi thế

Ưu điểm lớn nhất của chiến lược này là hiệu quả chụp cao, thực hiện xác minh đa yếu tố cải thiện chất lượng tín hiệu. Cụ thể, chủ yếu được thể hiện trong các khía cạnh sau:

  1. Chỉ số RSI tự nó có khả năng nhận diện các chế độ thị trường và có thể nhận diện hiệu quả các hiện tượng quá mua quá bán.
  2. Các công cụ hỗ trợ khác nhau đã được sử dụng để xác thực đa yếu tố, cải thiện chất lượng tín hiệu và lọc ra nhiều kết quả giả.
  3. Chiến lược không nhạy cảm với tham số và dễ dàng tối ưu hóa.

Rủi ro và giải pháp

Chiến lược này cũng có một số rủi ro, chủ yếu tập trung vào hai khía cạnh:

  1. Rủi ro thất bại đảo ngược. Các tín hiệu đảo ngược tự nó phụ thuộc vào cơ hội đánh giá thống kê, không loại trừ xác suất thất bại đảo ngược cá nhân. Rủi ro có thể được kiểm soát bằng cách giảm vị trí hoặc thiết lập dừng lỗ.
  2. Rủi ro thua lỗ trong tình huống đa đầu. Chiến lược nói chung vẫn được điều khiển bởi thị trường ngược, trong tình huống đa đầu chắc chắn sẽ có một số tổn thất. Điều này đòi hỏi chúng ta phải đánh giá chính xác xu hướng lớn, và nếu cần thiết, hãy can thiệp bằng tay để vượt qua tình huống bất lợi.

Hướng tối ưu hóa

Chiến lược này cần được tối ưu hóa theo các khía cạnh sau:

  1. Kiểm tra các giống khác nhau để tìm kiếm sự kết hợp tốt nhất. Chiến lược không nhạy cảm với các tham số, nhưng vẫn khuyến nghị tìm kiếm các tham số tối ưu cho các giống khác nhau.
  2. Thêm cơ chế rút lui thích ứng. Bạn có thể thử nghiệm thêm các phương thức như dừng động, rút lui theo thời gian, để chiến lược phù hợp hơn với sự thay đổi của thị trường.
  3. Tham gia thuật toán học máy. Bạn có thể thử cho mô hình học để đánh giá xác suất thành công của sự đảo ngược, do đó tăng tỷ lệ chiến lược.

Tóm tắt

Chiến lược này nói chung là một chiến lược đảo ngược đường ngắn. Sử dụng chỉ số RSI để đánh giá khả năng mua quá mức và bán quá mức, đồng thời thực hiện xác minh đa yếu tố bằng nhiều công cụ phụ trợ, do đó cải thiện chất lượng tín hiệu. Chiến lược này có hiệu quả nắm bắt cao và ổn định hơn.
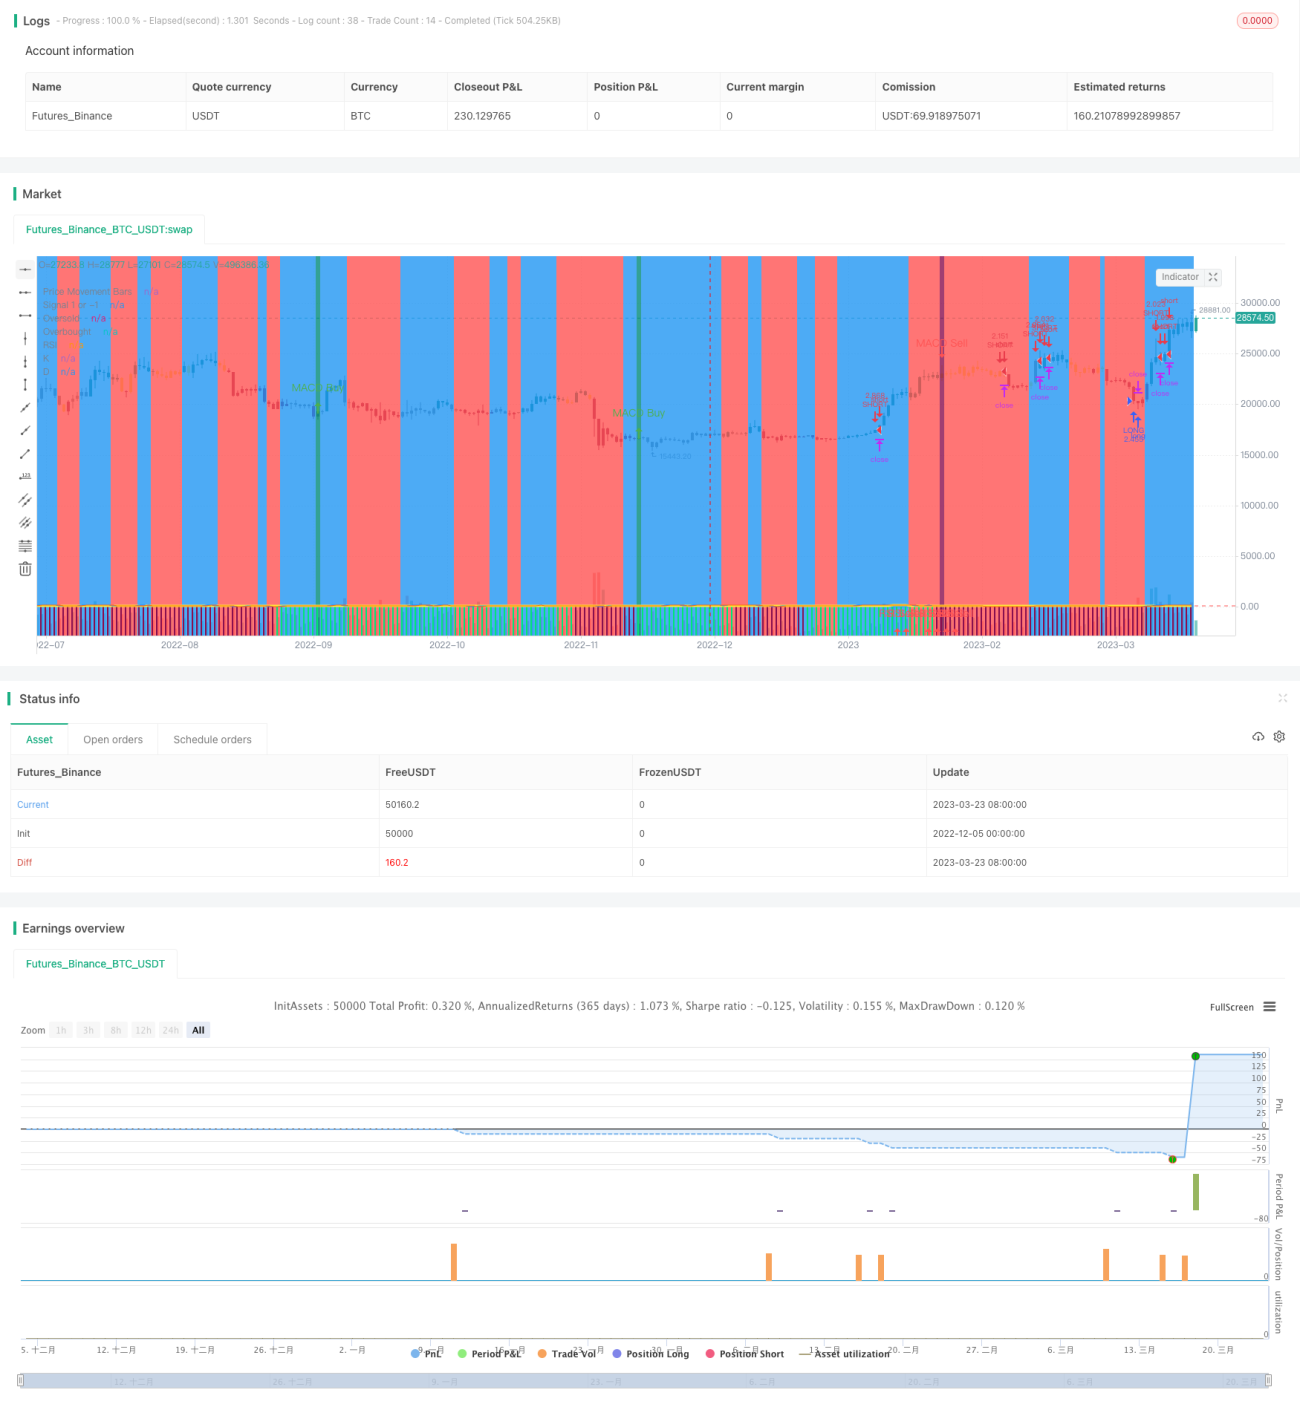
Mã nguồn chiến lược
/*backtest
start: 2022-12-05 00:00:00
end: 2023-03-24 00:00:00
period: 1d
basePeriod: 1h
exchanges: [{"eid":"Futures_Binance","currency":"BTC_USDT"}]
*/

// This source code is subject to the terms of the Mozilla Public License 2.0 at https://mozilla.org/MPL/2.0/
//@version=4

strategy(shorttitle='Ain1',title='All in One Strategy', overlay=true, initial_capital = 1000, process_orders_on_close=true, default_qty_type = strategy.percent_of_equity, default_qty_value = 100, commission_type=strategy.commission.percent, commission_value=0.18, calc_on_every_tick=true)

kcolor = #0094FF
dcolor = #FF6A00


// -----------------  Strategy Inputs -------------------------------------------------------------
//Backtest dates with auto finish date of today
start = input(defval = timestamp("01 April 2021 00:00 -0500"), title = "Start Time", type = input.time)
finish = input(defval = timestamp("31 December 2021 00:00 -0600"), title = "Start Time", type = input.time)
window()  => true


// Strategy Selection - Long, Short, or Both
strat = input(title="Strategy", defval="Long/Short", options=["Long Only", "Long/Short", "Short Only"])
strat_val = strat == "Long Only" ? 1 : strat == "Long/Short" ? 0 : -1

// Risk Management Inputs
sl= input(10.0, "Stop Loss %", minval = 0, maxval = 100, step = 0.01)
stoploss = sl/100
tp = input(20.0, "Target Profit %", minval = 0, maxval = 100, step = 0.01)
TargetProfit = tp/100

// RSI and Stochastic Inputs
length = input(14, "RSI Length", minval=1)
ob_min = input(52, "Overbought Lookback Minimum Value", minval=0, maxval=200)
ob_lb = input(25, "Overbought Lookback Bars", minval=0, maxval=100)
os_min = input(50, "Oversold Lookback Minimum Value", minval=0, maxval=200)
os_lb = input(35, "Oversold Lookback Bars", minval=0, maxval=100)
source = input(title="Source", type=input.source, defval=close)
RSI = rsi(source, length)

// Define f_print function to show key recommendations for RSI
// f_print(_text) =>
//     // Create label on the first bar.
//     var _label = label(na),
//     label.delete(_label), 
//     _label := label.new(
//      time + (time-time[1]), 
//      ohlc4,
//      _text,
//      xloc.bar_time,
//      yloc.price,
//      color(na),
//      label.style_none,
//      color.gray,
//      size.large,
//      text.align_left
//      )


// Display highest and lowest RSI values

AvgHigh(src,cnt,val) =>
    total = 0.0
    count = 0
    for i = 0 to cnt
        if src[i] > val
            count := count + 1
            total := total + src[i]
    round(total / count)
    
RSI_high = AvgHigh(RSI, ob_lb, ob_min)

AvgLow(src,cnt,val) =>
    total = 0.0
    count = 0
    for i = 5 to cnt by 5
        if src[i] < val
            count := count + 1
            total := total + src[i]
    round(total / count)

RSI_low = AvgLow(RSI, os_lb, os_min)


// f_print("Recommended RSI Settings:" + "\nOverbought = " + tostring(RSI_high) + "\nOversold = " + tostring(RSI_low))


overbought= input(62, "Overbought")
oversold= input(35, "Oversold")


// Price Movement Inputs
look_back = input(9,"Look Back Bars")
high_source = input(high,"High Source")
low_source= input(low,"Low Source")
HTF = input("","Curernt or Higher time frame only", type=input.resolution)

// EMA and SMA Background Inputs
smoothK     = input(3, "K", minval=1)
smoothD     = input(3, "D", minval=1)
k_mode      = input("SMA", "K Mode", options=["SMA", "EMA", "WMA"])

// MACD Inputs
fastLength = input(5, minval=1, title="EMA Fast Length")
slowLength = input(10, minval=1, title="EMA Slow Length")

// Selections to show or hide the overlays
showZones = input(true, title="Show Bullish/Bearish Zones")
showStoch = input(true, title="Show Stochastic Overlays")
showRSIBS = input(true, title="Show RSI Buy Sell Zones")
showMACD = input(true, title="Show MACD")
color_bars=input(true, "Color Bars")
useXRSI = input(false, "Use RSI crossing back, select only one")
useMACD = input(false, "Use MACD Only, select only one")
useCRSI = input(false, "Use Tweaked Connors RSI, select only one")


// ------------------ Background Colors based on EMA Indicators -----------------------------------
// Uses standard lengths of 9 and 21, if you want control delete the constant definition and uncomment the inputs
haClose(gap) => (open[gap] + high[gap] + low[gap] + close[gap]) / 4
rsi_ema = rsi(haClose(0), length)
v2 = ema(rsi_ema, length)                                                
v3 = 2 * v2 - ema(v2, length)  
emaA = ema(rsi_ema, fastLength)                                     
emaFast = 2 * emaA - ema(emaA, fastLength)
emaB = ema(rsi_ema, slowLength)                                     
emaSlow = 2 * emaB - ema(emaB, slowLength)  

// bullish signal rule: 
bullishRule =emaFast > emaSlow
// bearish signal rule: 
bearishRule =emaFast < emaSlow

// current trading State
ruleState = 0
ruleState := bullishRule ? 1 : bearishRule ? -1 : nz(ruleState[1])
bgcolor(showZones ? ( ruleState==1 ? color.blue : ruleState==-1 ? color.red : color.gray ) : na , title=" Bullish/Bearish Zones", transp=95)


// ------------------  Stochastic Indicator Overlay -----------------------------------------------

// Calculation
// Use highest highs and lowest lows
h_high = highest(high_source ,look_back)
l_low = lowest(low_source ,look_back)

stoch = stoch(RSI, RSI, RSI, length)
k =
 k_mode=="EMA" ? ema(stoch, smoothK) :
 k_mode=="WMA" ? wma(stoch, smoothK) :
 sma(stoch, smoothK)
d = sma(k, smoothD)
k_c = change(k)
d_c = change(d)
kd = k - d

// Plot
signalColor = k>oversold and d<overbought and k>d and k_c>0 and d_c>0 ? kcolor : 
 k<overbought and d>oversold and k<d and k_c<0 and d_c<0 ? dcolor : na
kp = plot(showStoch ? k : na, "K", transp=80, color=kcolor)
dp = plot(showStoch ? d : na, "D", transp=80, color=dcolor)
fill(kp, dp, color = signalColor, title="K-D", transp=88)
signalUp = showStoch ? not na(signalColor) and kd>0 : na
signalDown = showStoch ? not na(signalColor) and kd<0 : na
plot(signalUp ? kd : na, "Signal Up", color=kcolor, transp=90, style=plot.style_columns)
plot(signalDown ? (kd+100) : na , "Signal Down", color=dcolor, transp=90, style=plot.style_columns, histbase=100)


// -------------- Add Price Movement to Strategy for better visualization -------------------------
// Calculations
h1 = vwma(high, length)
l1 = vwma(low, length)
hp = h_high[1]
lp = l_low[1]

// Plot
var plot_color=#353535
var sig = 0
if (h1 >hp)
    sig:=1
    plot_color:=color.lime
else if (l1 <lp)
    sig:=-1
    plot_color:=color.maroon
plot(1,title = "Price Movement Bars", style=plot.style_columns,color=plot_color)
plot(sig,title="Signal 1 or -1",display=display.none)


// --------------------------------------- RSI Plot ----------------------------------------------
// Plot Oversold and Overbought Lines
over = hline(oversold, title="Oversold", color=color.green)
under = hline(overbought, title="Overbought", color=color.red)
fill(over, under, color=#9915FF, transp=90, title="Band Background")


// Show RSI and EMA crosses with arrows and RSI Color (tweaked Connors RSI)
// Improves strategy setting ease by showing where EMA 5 crosses EMA 10 from above to confirm overbought conditions or trend reversals
// This shows where you should enter shorts or exit longs

// Tweaked Connors RSI Calculation
connor_ob = 80
connor_os = 20
ma3 = sma(close,3)
ma20 = sma(close, 20)
ma50 = sma(close, 50)
erection = ((((close[1]-close[2])/close[2]) + ((close[0]-close[1])/close[1]))/2)*100

// Buy Sell Zones using tweaked Connors RSI (RSI values of 80 and 20 for Crypto as well as ma3, ma20, and ma50 are the tweaks)
RSI_SELL = ma20 > ma50 and open > ma3 and RSI >= connor_ob and erection <=4 and window()
RSI_BUY = ma20 < ma50 and ma3 > close and RSI <= connor_os and window()

// Color Definition
col = useCRSI ? (close > ma20 and close < ma3 and RSI <= connor_os ? color.lime : close < ma20 and close > ma3 and RSI <= connor_ob ? color.red : color.yellow ) : color.yellow

// Plot colored RSI Line
plot(RSI, title="RSI", linewidth=3, color=col)


// Shape Plots
plotshape(showRSIBS ? RSI_BUY: na, title = "RSI Buy", style = shape.arrowup, text = "RSI Buy", location = location.bottom, color=color.green, textcolor=color.green, size=size.small)
plotshape(showRSIBS ? RSI_SELL: na, title = "RSI Sell", style = shape.arrowup, text = "RSI Sell", location = location.bottom, color=color.red, textcolor=color.red, size=size.small)


// MACD as another complement to RSI strategy
[macdLine, signalLine, _] = macd(close, fastLength, slowLength, length)

bartrendcolor = macdLine > signalLine and k > 50 and RSI > 50 ? color.teal : macdLine < signalLine and k < 50 and RSI < 50 ? color.maroon : macdLine < signalLine ? color.yellow : color.gray
barcolor(color = color_bars ? bartrendcolor : na)


MACDBuy = crossover(macdLine, signalLine) and macdLine<0 and RSI<RSI_low and window()
MACDSell = crossunder(macdLine, signalLine) and macdLine>0 and RSI>RSI_high and window()

plotshape(showMACD ? MACDBuy: na, title = "MACD Buy", style = shape.arrowup, text = "MACD Buy", color=color.green, textcolor=color.green, size=size.small)
plotshape(showMACD ? MACDSell: na, title = "MACD Sell", style = shape.arrowdown, text = "MACD Sell", color=color.red, textcolor=color.red, size=size.small)
bgcolor(showMACD ? (MACDBuy ? color.teal : MACDSell ? color.maroon : na) : na, title ="MACD Signals", transp=50)


// -------------------------------- Entry and Exit Logic ------------------------------------


// Entry Logic
XRSI_OB = crossunder(RSI, overbought) and window()
RSI_OB = crossover(RSI, overbought) and window()
XRSI_OS = crossover(RSI, oversold) and window()
RSI_OS = crossunder(RSI, oversold) and window()


// Strategy Entry and Exit with built in Risk Management
GoLong = strat_val > -1 ? (useXRSI ? XRSI_OS : useMACD ? MACDBuy : useCRSI ? RSI_BUY : RSI_OS) : false

GoShort = strat_val < 1 ? (useXRSI ? XRSI_OB : useMACD ? MACDSell : useCRSI ? RSI_SELL : RSI_OB) : false

convert_percent_to_points(percent) =>
    strategy.position_size != 0 ? round(percent * strategy.position_avg_price / syminfo.mintick) : float(na)
    
setup_percent(percent) =>
    convert_percent_to_points(percent)


if (GoLong)
    strategy.entry("LONG", strategy.long)
    strategy.exit(id="Exit Long", from_entry = "LONG", loss=setup_percent(stoploss), profit=setup_percent(TargetProfit))

CloseLong = strategy.position_size > 0 ? (useXRSI ? XRSI_OB : useMACD ? MACDSell : useCRSI ? RSI_SELL : RSI_OB) : false

if(CloseLong)
    strategy.close("LONG")


if (GoShort) 
    strategy.entry("SHORT", strategy.short)
    strategy.exit(id="Exit Short", from_entry = "SHORT", loss=setup_percent(stoploss), profit=setup_percent(TargetProfit))
        
CloseShort = strat_val < 1 and strategy.position_size < 0 ? (useXRSI ? XRSI_OS : useMACD ? MACDBuy : useCRSI ? RSI_BUY : RSI_OS) : false

if(CloseShort)
    strategy.close("SHORT")