Chiến lược giao dịch rùa dải Bollinger đa cấp MACD

Tổng quan
Chiến lược này kết hợp các chỉ số MACD với các chỉ số BRI, hỗ trợ các quy tắc giao dịch hải cẩu để tạo ra một hệ thống phán đoán đa cấp nhằm tăng lợi nhuận của chiến lược và kiểm soát rủi ro.
Nguyên tắc chiến lược
-
Sử dụng chỉ số MACD để đánh giá xu hướng tiềm năng, kết hợp với việc đánh giá giá cao và thấp của kênh Boolean để phát ra tín hiệu giao dịch.
-
Kết hợp với N giá trị đột phá trong quy tắc giao dịch hải cẩu tạo ra cơ chế theo dõi dừng lỗ, tiếp tục khóa lợi nhuận, kiểm soát rủi ro.
-
Sử dụng tính năng Brin, điều chỉnh tỷ lệ mở vị trí lần đầu tiên, sau đó sử dụng nguyên tắc gia tăng vị trí của luật giao dịch biển, thực hiện mở vị trí và dừng lỗ, mở rộng không gian lợi nhuận.
Phân tích lợi thế
-
Chỉ số MACD có khả năng đánh giá xu hướng mạnh mẽ hơn, chỉ số kênh Boolean có hiệu quả trong việc đánh giá tình huống quá mua quá bán, cả hai kết hợp để tạo ra hệ thống đánh giá tăng độ chính xác.
-
Các cơ chế dừng lỗ theo dõi trong luật giao dịch biển có thể khóa lợi nhuận tốt hơn và tránh rút quá sâu.
-
Tỷ lệ chênh lệch gia tăng được kết hợp với việc theo dõi dừng lỗ, mở rộng phạm vi lợi nhuận với giả định kiểm soát rủi ro.
Phân tích rủi ro
-
Các tham số của kênh Brin được thiết lập không chính xác, có thể làm mất cơ hội hoặc tăng tín hiệu sai.
-
Cài đặt giá trị N trong quy tắc giao dịch biển cần thận trọng, quá lớn hoặc quá nhỏ có thể ảnh hưởng đến hiệu suất chiến lược.
-
Những người tham gia vào cuộc thi này sẽ phải cẩn thận và tránh theo đuổi những con số cao và thấp.
Hướng tối ưu hóa
-
Điều chỉnh các tham số của kênh Brin, tối ưu hóa chiều rộng kênh và tăng cơ hội kiếm tiền.
-
Kiểm tra các giá trị N khác nhau để tìm vị trí dừng tối ưu.
-
Tối ưu hóa mức độ và số lần đặt cược, giảm rủi ro trong khi đảm bảo lợi nhuận.
Tóm tắt
Chiến lược này kết hợp 3 công cụ định lượng chính của MACD, kênh Brin và quy tắc giao dịch biển để tìm kiếm sự phù hợp tốt nhất bằng cách điều chỉnh các tham số, tạo thành hệ thống chỉ số phán đoán. Do đó, tận dụng tối đa các lợi thế của các công cụ, bổ sung cho nhau và cùng nhau nâng cao hiệu suất của hệ thống.
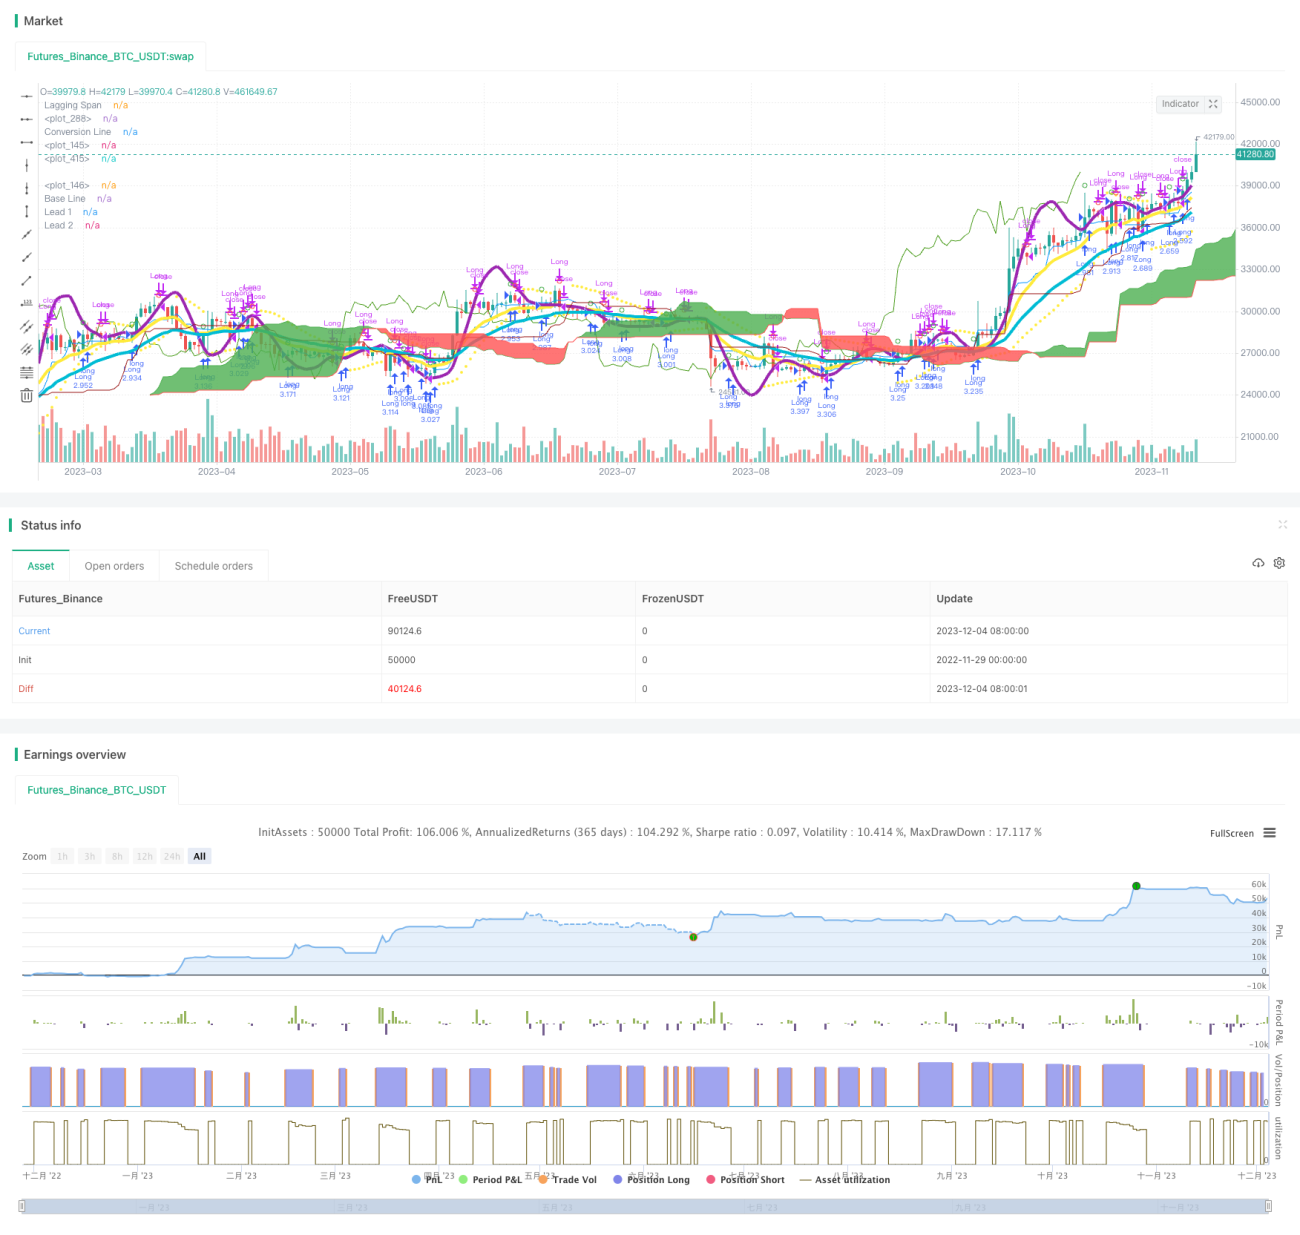
/*backtest
start: 2022-11-29 00:00:00
end: 2023-12-05 00:00:00
period: 1d
basePeriod: 1h
exchanges: [{"eid":"Futures_Binance","currency":"BTC_USDT"}]
*/

//@version=3
strategy("Tagmaniak MACD Algo", shorttitle="Tagmaniak MACD Algo", overlay=true, pyramiding = 0, default_qty_type = strategy.percent_of_equity, default_qty_value = 100, initial_capital=7000, calc_on_order_fills = true, commission_type=strategy.commission.percent, commission_value=0, currency = currency.USD)
//study("MFI Fresh", shorttitle="MFI Fresh", overlay=true)
- 1