Chiến lược bật lại trung bình động

Tổng quan về chiến lược
Chiến lược bouncing moving average là một chiến lược theo dõi giá phá vỡ đường trung bình di chuyển. Nó kiểm tra xem con dao có quay trở lại từ phía dưới đường trung bình di chuyển hay không, nếu vậy, đó là tín hiệu đa đầu; nếu con dao quay trở lại từ phía trên đường trung bình di chuyển, đó là tín hiệu đầu không.
Tên chiến lược
Exponential Moving Average Bounce Strategy
Nguyên tắc chiến lược
Chiến lược này dựa trên đường trung bình di chuyển theo cấp số nhân. Nó sẽ tính toán một đường EMA trong thời gian thực. Sau đó kiểm tra xem giá có bật lên hoặc xuống dưới đường EMA hay không:
- Nếu giá giảm xuống dưới đường EMA và sau đó tăng trở lại trên đường EMA, đó là tín hiệu đa đầu
- Nếu giá vượt qua đường EMA trước và sau đó giảm trở lại và đóng cửa bên dưới đường EMA, đó là tín hiệu không đầu
Một sự phản hồi như vậy là tín hiệu đầu tiên cho chiến lược.
Phân tích lợi thế chiến lược
Chạy trôi chảy, tránh bị mắc kẹt
Chiến lược phản hồi của EMA chỉ được đưa vào thị trường sau khi xác định giá đã đảo ngược, để tránh hoạt động ngược trở lại.
Tiền thu hồi nhỏ, lợi nhuận lịch sử tốt
Do sử dụng chỉ số di chuyển trung bình, có thể làm mịn dữ liệu giá một cách hiệu quả, lọc tiếng ồn thị trường, làm cho chiến lược này trở lại nhỏ và lợi nhuận lịch sử tốt hơn.
Dễ hiểu, linh hoạt điều chỉnh tham số
Chiến lược EMA rebound chỉ dựa vào moving average, rất đơn giản và dễ hiểu cho người mới; đồng thời các tham số EMA chu kỳ có thể được điều chỉnh linh hoạt để phù hợp với các giống khác nhau.
Phân tích rủi ro
Dễ bị sai tín hiệu
Gần các đường EMA thường có các đột phá giả dày đặc, có thể gây ra tín hiệu sai. Cần điều chỉnh tham số EMA để lọc những tiếng ồn này.
Hoạt động theo chiều hướng, không thể dự đoán được điểm biến
Chiến lược này về cơ bản là hoạt động theo chiều hướng. Không thể dự đoán được điểm biến động giá, chỉ có thể theo xu hướng. Đây có thể là thời điểm nhập cảnh tốt nhất để bỏ lỡ điều chỉnh chu kỳ.
Vị trí dừng lỗ dễ bị phá vỡ
Các mức dừng gần đường trung bình di chuyển đôi khi bị phá vỡ, gây ra sự mất mát lớn hơn. Điều này đòi hỏi phải sử dụng các phương pháp dừng linh hoạt hơn.
Hướng tối ưu hóa
Kết hợp các chỉ số khác để lọc tín hiệu
Các chỉ số khác như RSI, MACD và các chỉ số khác có thể được thêm vào để xác nhận sự đảo ngược giá, lọc các tín hiệu giả.
Tối ưu hóa phương thức dừng lỗ
Có thể sử dụng các phương pháp dừng lỗ linh hoạt hơn như dừng thời gian, dừng rung, để giảm nguy cơ bị đâm.
Tối ưu hóa tham số
Tối ưu hóa các tham số EMA chu kỳ để tìm ra sự kết hợp tham số tốt nhất. Bạn cũng có thể làm cho các tham số EMA thay đổi động, theo dõi chu kỳ thị trường.
Tóm tắt
Chiến lược phản hồi đường trung bình di chuyển là một chiến lược theo dõi xu hướng đơn giản và thực tế. Nó hoạt động theo chiều hướng, rút lui nhỏ, dễ hiểu. Ngoài ra, có một số rủi ro tín hiệu giả và rủi ro dừng. Chúng ta có thể tối ưu hóa chiến lược này bằng cách kết hợp các chỉ số tốt hơn, cách dừng và lựa chọn tham số, làm cho nó trở thành một chiến lược định lượng ổn định và đáng tin cậy.
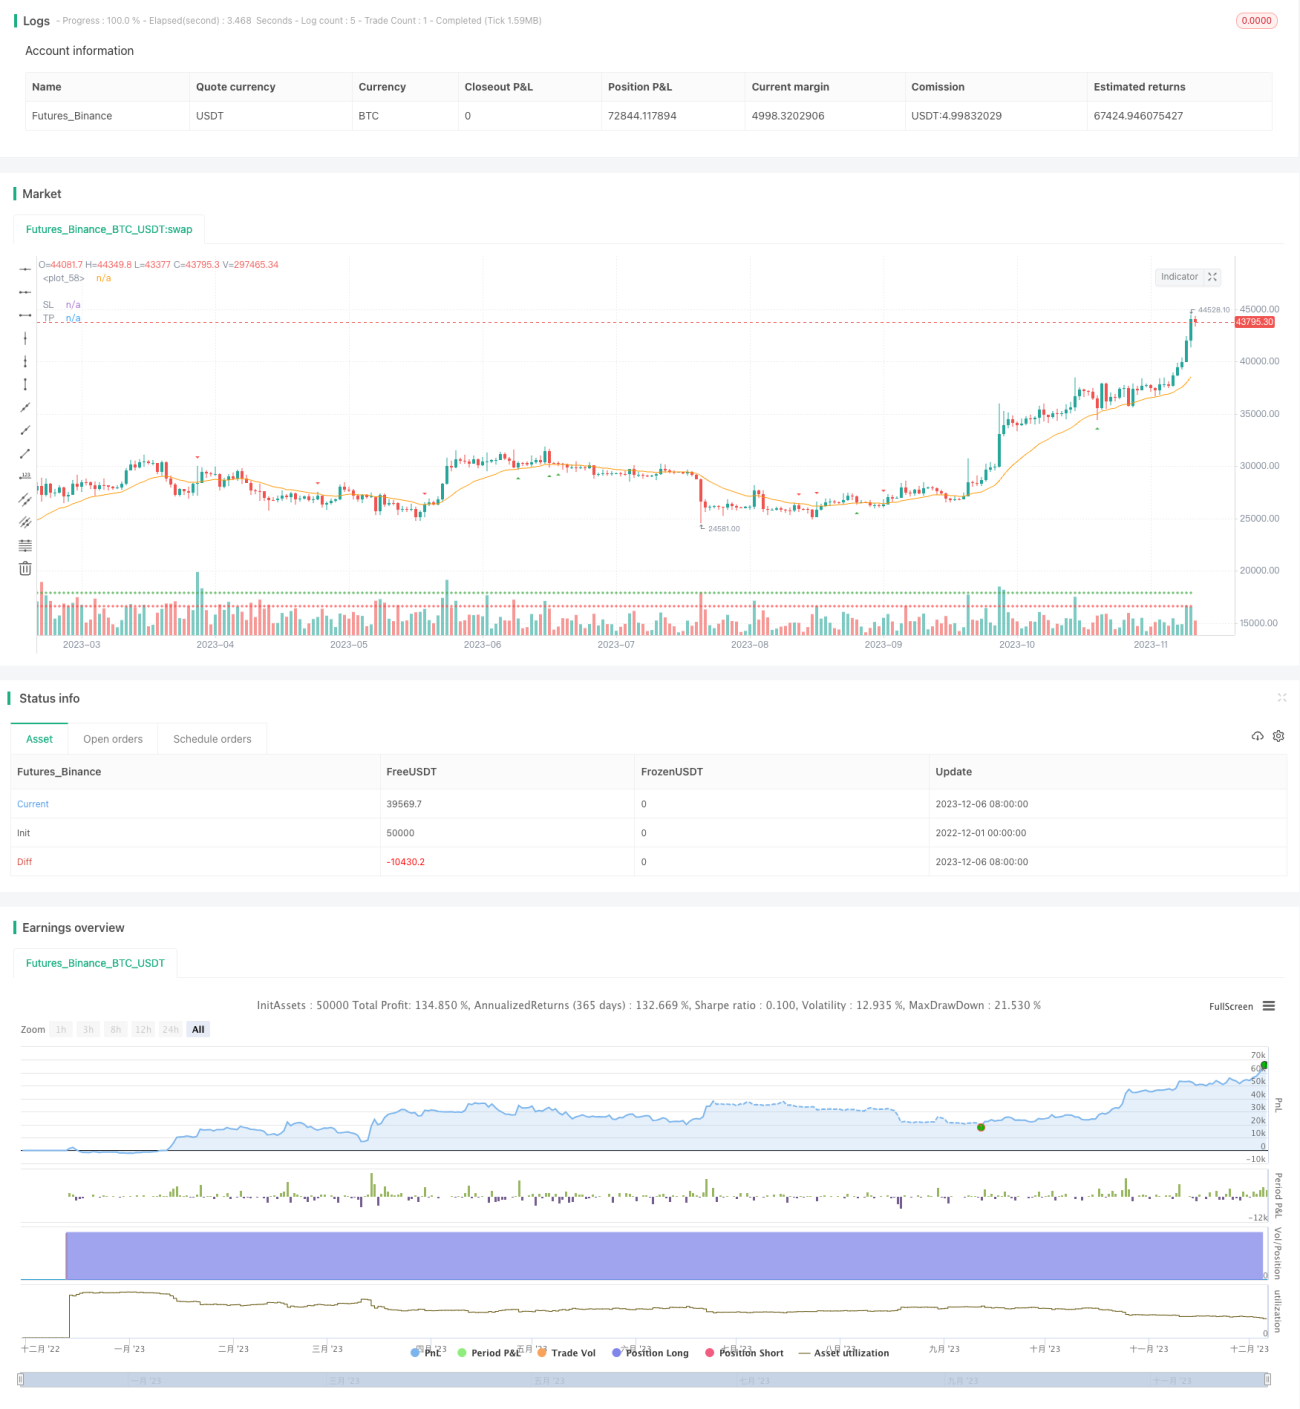
/*backtest
start: 2022-12-01 00:00:00
end: 2023-12-07 00:00:00
period: 1d
basePeriod: 1h
exchanges: [{"eid":"Futures_Binance","currency":"BTC_USDT"}]
*/

// This source code is subject to the terms of the Mozilla Public License 2.0 at https://mozilla.org/MPL/2.0/
// © tweakerID

// Simple strategy that checks for price bounces over an Exponential Moving Average. If the CLOSE of the candle bounces- 1