Chiến lược theo xu hướng đảo ngược kép


Ngày tạo: 2023-12-13 18:01:53 sửa đổi lần cuối: 2023-12-13 18:01:53
sao chép: 0 Số nhấp chuột: 575
1
tập trung vào
1621
Người theo dõi

Chiến lược theo xu hướng đảo ngược kép

Tổng quan

Đây là một chiến lược theo dõi xu hướng kết hợp với tín hiệu đảo ngược kép. Nó tích hợp 123 chiến lược đảo ngược và chiến lược chỉ số hiệu suất để theo dõi các điểm đảo ngược giá, cho phép đánh giá xu hướng đáng tin cậy hơn.

Nguyên tắc chiến lược

Chiến lược này bao gồm hai chiến lược con:

  1. 123 Chiến lược đảo ngược

Sử dụng đường K 14 ngày để đánh giá tín hiệu đảo ngược. Các quy tắc cụ thể là:

  • Tín hiệu đa đầu: Giá đóng cửa hai ngày trước giảm, giá đóng cửa đường K hiện tại cao hơn giá đóng cửa ngày trước, Stochastic Slow ngày 9 thấp hơn 50
  • Tín hiệu không đầu: Giá đóng cửa 2 ngày trước tăng, giá đóng cửa K hiện tại thấp hơn giá đóng cửa ngày trước, Stochastic Fast 9 ngày cao hơn 50
  1. Chiến lược chỉ số hiệu suất

Tính toán các đợt tăng/tăng trong 14 ngày qua như là một chỉ số. Quy tắc là:

  • Chỉ số hiệu suất> ((0)), tạo ra tín hiệu đa đầu
  • Chỉ số hiệu suất <(0), tạo ra tín hiệu không đầu

Tín hiệu cuối cùng là sự kết hợp của hai loại tín hiệu. Đó là tín hiệu đa không gian đồng hướng cần thiết để tạo ra hoạt động mua và bán thực tế.

Điều này có thể lọc một số tiếng ồn và làm cho tín hiệu trở nên đáng tin cậy hơn.

Lợi thế chiến lược

Hệ thống này có những ưu điểm sau:

  1. Kết hợp hai yếu tố đánh giá, tín hiệu đáng tin cậy hơn
  2. Có thể lọc hiệu quả tiếng ồn thị trường, tránh các tín hiệu sai
  3. 123 hình thức cổ điển và thực tế, dễ dàng đánh giá và tái tạo
  4. Chỉ số hiệu suất có thể đánh giá xu hướng trong tương lai
  5. Gói tham số linh hoạt, có thể được tối ưu hóa hơn nữa

Rủi ro chiến lược

Chiến lược này cũng có một số rủi ro:

  1. Có thể bỏ lỡ sự thay đổi đột ngột, không thể nắm bắt được xu hướng
  2. Sự kết hợp của hai điều kiện dẫn đến tín hiệu kém hơn, có thể ảnh hưởng đến lợi nhuận
  3. Cần có sự phán đoán đồng hành, dễ bị ảnh hưởng bởi biến động đặc biệt của cổ phiếu
  4. Các vấn đề về thiết lập tham số có thể gây ra sự lệch tín hiệu

Có thể xem xét tối ưu hóa các khía cạnh sau:

  1. Điều chỉnh các tham số, chẳng hạn như chiều dài K, chu kỳ Stochastic
  2. Tối ưu hóa logic phán đoán của tín hiệu kép
  3. Kết hợp nhiều yếu tố như số lượng giao dịch.
  4. Tăng hệ thống chống thiệt hại

Tóm tắt

Chiến lược này tích hợp phán đoán đảo ngược kép, có thể phát hiện hiệu quả các điểm biến giá. Mặc dù tín hiệu xảy ra với xác suất thấp hơn, nhưng độ tin cậy cao, phù hợp để bắt được xu hướng đường dài trung bình. Có thể tăng cường hiệu quả chiến lược hơn nữa bằng cách điều chỉnh tham số và tối ưu hóa đa yếu tố.
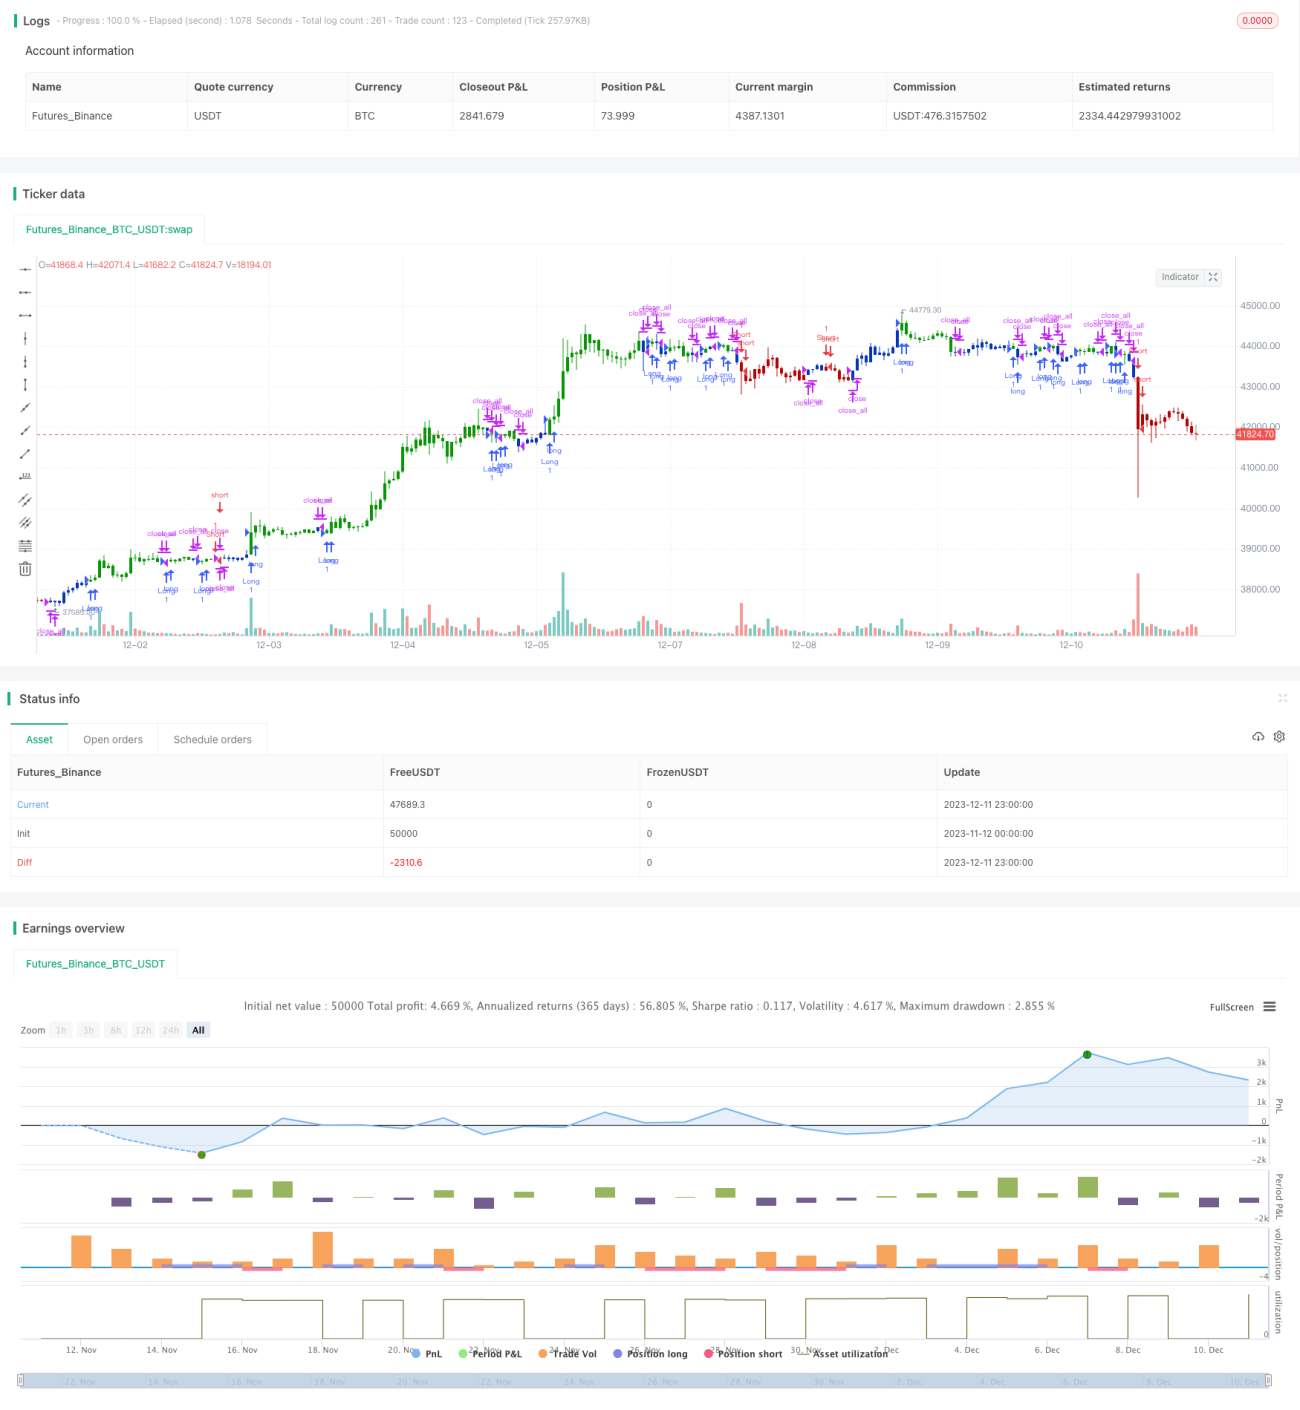
Mã nguồn chiến lược
/*backtest
start: 2023-11-12 00:00:00
end: 2023-12-12 00:00:00
period: 1h
basePeriod: 15m
exchanges: [{"eid":"Futures_Binance","currency":"BTC_USDT"}]
*/

//@version=4
////////////////////////////////////////////////////////////
//  Copyright by HPotter v1.0 15/04/2021
// This is combo strategies for get a cumulative signal. 
//
// First strategy
// This System was created from the Book "How I Tripled My Money In The 
// Futures Market" by Ulf Jensen, Page 183. This is reverse type of strategies.
// The strategy buys at market, if close price is higher than the previous close 
// during 2 days and the meaning of 9-days Stochastic Slow Oscillator is lower than 50. 
// The strategy sells at market, if close price is lower than the previous close price 
// during 2 days and the meaning of 9-days Stochastic Fast Oscillator is higher than 50.
//
// Second strategy
// The Performance indicator or a more familiar term, KPI (key performance indicator), 
// is an industry term that measures the performance. Generally used by organizations, 
// they determine whether the company is successful or not, and the degree of success. 
// It is used on a business’ different levels, to quantify the progress or regress of a 
// department, of an employee or even of a certain program or activity. For a manager 
// it’s extremely important to determine which KPIs are relevant for his activity, and 
// what is important almost always depends on which department he wants to measure the 
// performance for.  So the indicators set for the financial team will be different than 
// the ones for the marketing department and so on.
//
// Similar to the KPIs companies use to measure their performance on a monthly, quarterly 
// and yearly basis, the stock market makes use of a performance indicator as well, although 
// on the market, the performance index is calculated on a daily basis. The stock market 
// performance indicates the direction of the stock market as a whole, or of a specific stock 
// and gives traders an overall impression over the future security prices, helping them decide 
// the best move. A change in the indicator gives information about future trends a stock could 
// adopt, information about a sector or even on the whole economy. The financial sector is the 
// most relevant department of the economy and the indicators provide information on its overall 
// health, so when a stock price moves upwards, the indicators are a signal of good news. On the 
// other hand, if the price of a particular stock decreases, that is because bad news about its 
// performance are out and they generate negative signals to the market, causing the price to go 
// downwards. One could state that the movement of the security prices and consequently, the movement 
// of the indicators are an overall evaluation of a country’s economic trend.
//
// WARNING:
// - For purpose educate only
// - This script to change bars colors.
////////////////////////////////////////////////////////////
Reversal123(Length, KSmoothing, DLength, Level) =>
    vFast = sma(stoch(close, high, low, Length), KSmoothing) 
    vSlow = sma(vFast, DLength)
    pos = 0.0
    pos := iff(close[2] < close[1] and close > close[1] and vFast < vSlow and vFast > Level, 1,
	         iff(close[2] > close[1] and close < close[1] and vFast > vSlow and vFast < Level, -1, nz(pos[1], 0))) 
	pos


PI(Period) =>
    pos = 0.0
    xKPI = (close - close[Period]) * 100 / close[Period]
    pos := iff(xKPI > 0, 1,
              iff(xKPI < 0, -1, nz(pos[1], 0))) 
    pos

strategy(title="Combo Backtest 123 Reversal & Perfomance index", shorttitle="Combo", overlay = true)
line1 = input(true, "---- 123 Reversal ----")
Length = input(14, minval=1)
KSmoothing = input(1, minval=1)
DLength = input(3, minval=1)
Level = input(50, minval=1)
//-------------------------
line2 = input(true, "---- Perfomance index ----")
Period = input(14, minval=1)
reverse = input(false, title="Trade reverse")
posReversal123 = Reversal123(Length, KSmoothing, DLength, Level)
posPI = PI(Period)
pos = iff(posReversal123 == 1 and posPI == 1 , 1,
	   iff(posReversal123 == -1 and posPI == -1, -1, 0)) 
possig = iff(reverse and pos == 1, -1,
          iff(reverse and pos == -1 , 1, pos))	   
if (possig == 1 ) 
    strategy.entry("Long", strategy.long)
if (possig == -1 )
    strategy.entry("Short", strategy.short)	 
if (possig == 0) 
    strategy.close_all()
barcolor(possig == -1 ? #b50404: possig == 1 ? #079605 : #0536b3 )