Chiến lược đảo ngược điểm thấp

1
Follow
1779
Followers
Tổng quan
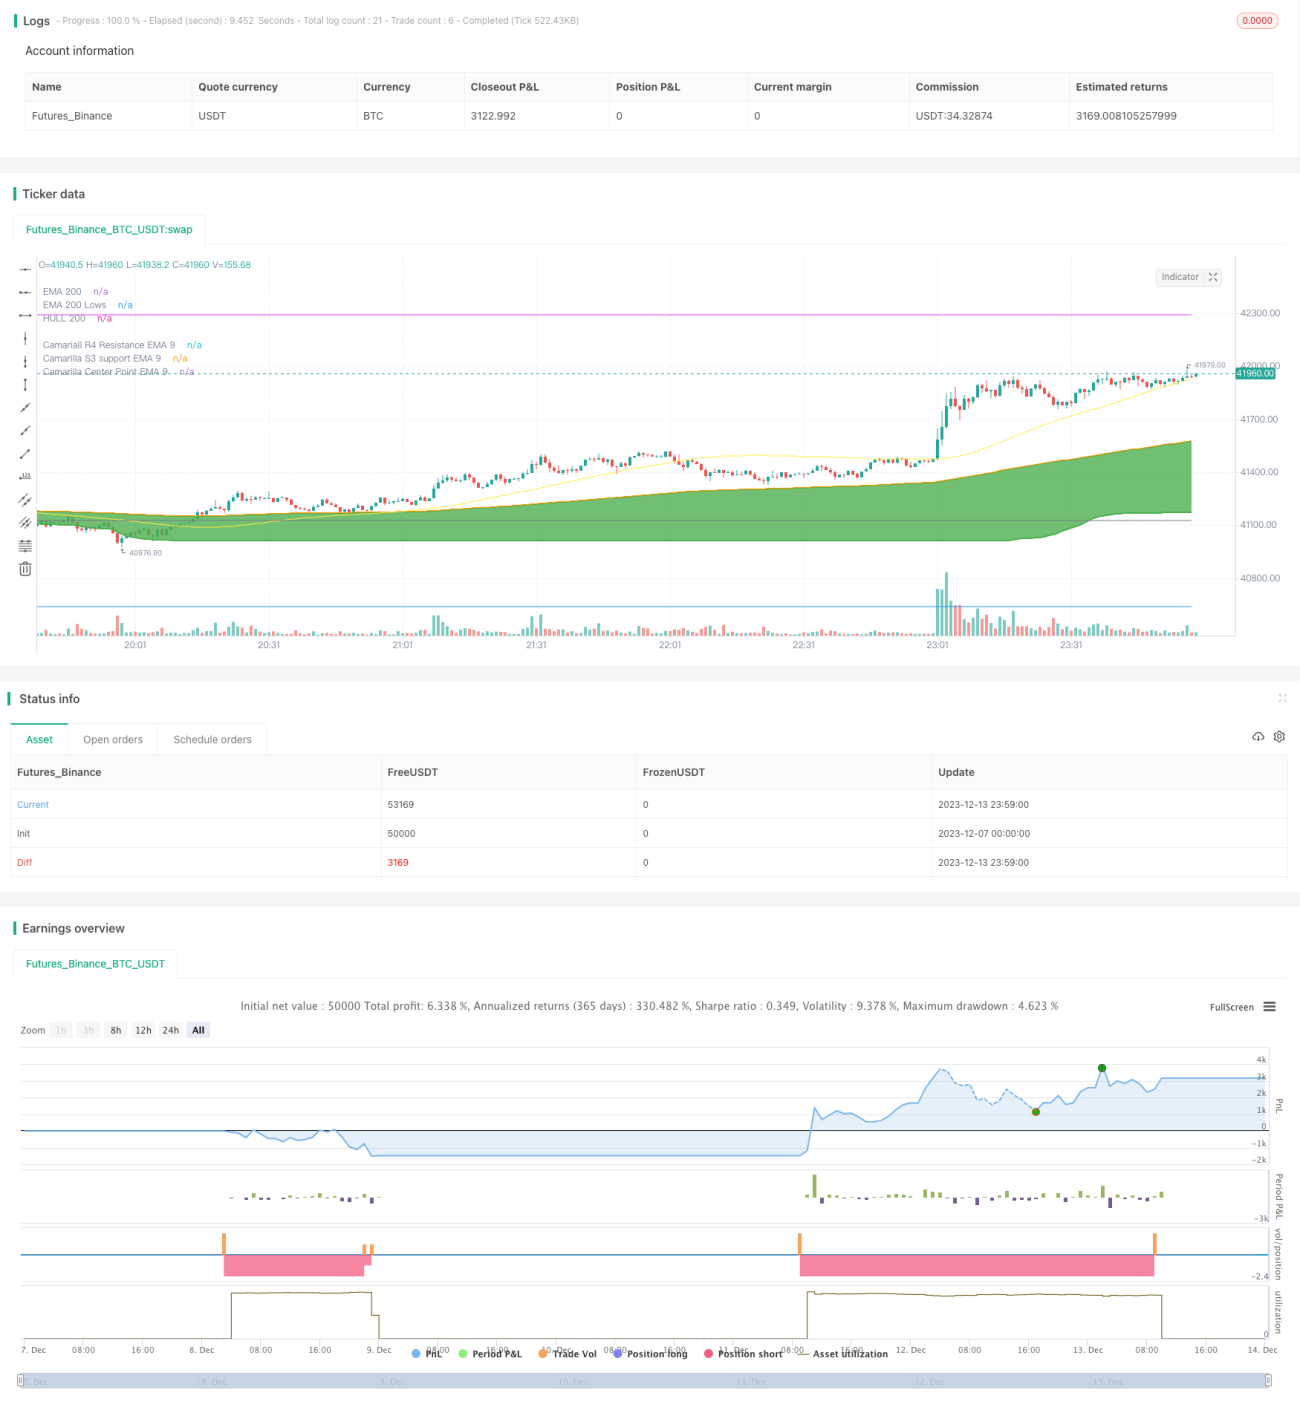
Chiến lược này dựa trên các điểm thấp nhất của thị trường để thực hiện các hoạt động đảo ngược. Nó sử dụng các điểm thấp nhất của EMA 200 ngày, kết hợp với điểm kháng cự hỗ trợ camarela để xác định các điểm thấp nhất của thị trường và thực hiện nhiều hoạt động khi giá tăng trở lại.
Nguyên tắc chiến lược
- Tính giá thấp nhất trong 200 ngày EMA là EMA200Lows, được coi là gần điểm thấp nhất của thị trường khi giá đóng cửa dưới mức EMA này.
- Tính toán EMA 9 ngày của hỗ trợ Camaleira 3 ((S3) là ema_s3_9, như là một mức hỗ trợ quan trọng.
- Sau đó tính EMA 9 ngày của trung tâm Camaleira là ema_center_9, để đánh giá tín hiệu đảo ngược.
- Khi ema_center_9 mặc ema200Lows, và 3 dòng K trước đều thấp hơn ema200Lows, thực hiện nhiều thao tác.
- Hạn chế là ATR, và theo dõi chuyển động giá thấp nhất.
- Lợi nhuận mục tiêu là ema_h4_9 ((Camarella Resistance 4) và ema_s3_9 ((Camarella Support 3) <unk>
Phân tích lợi thế
- Sử dụng điểm thấp nhất của EMA 200 ngày để xác định khu vực thấp nhất của thị trường, tránh các điểm thấp hơn ở giữa.
- Các vị trí hỗ trợ của Camaleira kết hợp với trung tâm, cho phép đánh giá chính xác hơn về điểm đảo ngược.
- ATR là một phương pháp để dừng lỗ một cách hợp lý hơn, theo dõi điểm thấp hơn có lợi cho việc khóa nhiều tiền hơn.
Phân tích rủi ro
- Cố gắng giữ vị trí dài hạn có rủi ro cao. Chiến lược này thích hợp hơn cho hoạt động ngắn hạn.
- Trong trường hợp thị trường lớn, lỗ dừng có thể lớn. Có thể điều chỉnh theo tham số ATR.
- Các nhà khoa học đã đưa ra những kết luận khác nhau về sự thay đổi này, trong đó có một số người cho rằng sự thay đổi này có thể là do sự thay đổi của các hệ thống phân tích.
Hướng tối ưu hóa
- Có thể xem xét kết hợp với các chỉ số khác, chẳng hạn như RSI để đánh giá tín hiệu đảo ngược.
- Bạn có thể nghiên cứu các tham số khác nhau để tìm các tham số tốt hơn.
- Bạn có thể thử các phương pháp học máy để điều chỉnh động ATR.
Tóm tắt
Chiến lược này sử dụng điểm thấp nhất của EMA và chỉ số Camelot để xác định các khu vực thấp nhất của thị trường và điểm đảo ngược. Nhận lợi nhuận thông qua ATR dừng lỗ. Nói chung, chiến lược là hoàn chỉnh và có một số giá trị chiến đấu.
Source
Pine
/*backtest
start: 2023-12-07 00:00:00
end: 2023-12-14 00:00:00
period: 1m
basePeriod: 1m
exchanges: [{"eid":"Futures_Binance","currency":"BTC_USDT"}]
*/

// This source code is subject to the terms of the Mozilla Public License 2.0 at https://mozilla.org/MPL/2.0/
// © mohanee

//Using the lowest of low of ema200, you can find the bottomStrategy parameters
Related strategies
Comment
All comments (0)
No data
- 1