Chiến lược theo xu hướng dựa trên RSI và đường trung bình động có trọng số
Tổng quan
Chiến lược này dựa trên hai chỉ số nổi tiếng: chỉ số tương đối yếu ((RSI) và trung bình di chuyển trọng lượng ((Weighted Moving Average, WMA), được sử dụng để xác định xu hướng thị trường và theo dõi hướng của nó. RSI được sử dụng để đánh giá quá mua quá bán, WMA được sử dụng để đánh giá xu hướng giá, kết hợp với nhau có thể lọc hiệu quả các tín hiệu không liên quan, tăng khả năng kiếm lợi nhuận. Đây là một chiến lược trung hạn dài hạn, kết hợp với phương pháp quản lý tài chính, có thể điều chỉnh vị trí tùy theo tình huống lỗ hổng.
Nguyên tắc chiến lược
Chỉ số RSI
RSI là một trong những chỉ số bán tháo nổi tiếng nhất.
\[RSI = 100 - \frac{100}{1+\frac{AvgGain}{AvgLoss}}\]
Trong đó, AvgGain là tổng giá đóng cửa cao hơn giá mở cửa trong một khoảng thời gian nhất định, chia cho số ngày, và AvgLoss là tổng giá đóng cửa tuyệt đối của giá đóng cửa thấp hơn giá mở cửa, chia cho số ngày.
Chiến lược này đặt chu kỳ RSI là 20 để đánh giá xu hướng. Khi RSI lớn hơn 60, nó sẽ tạo ra tín hiệu đa đầu và tín hiệu trống khi nó nhỏ hơn 40.
Đường trung bình di chuyển trọng WMA
WMA mạnh hơn SMA trong việc điều chỉnh giá gần đây. Công thức tính toán là:
\[WMA = \frac{\sum_{i=1}^n w_i x_i}{\sum_{i=1}^n w_i}\]
w là trọng lượng, tăng theo chỉ số w khi tăng i. Công thức trọng lượng của chiến lược này là:
\[w = \begin{cases} 100/(4+(n-4)*1.3), & i <= 3 \ 1.3*w, & i > 3 \end{cases}\]
Nghĩa là 3 ngày gần nhất có cùng trọng lượng, sau đó mỗi ngày trước có trọng lượng tăng 1,3 lần. Điều này có thể nhấn mạnh ảnh hưởng của giá gần đây.
Trong chiến lược này, thời gian của WMA là 20 ngày.
Tín hiệu chiến lược
Tín hiệu đa đầu: RSI > 60 và WMA 20 ngày ROC < -1
Tín hiệu đầu trống: RSI < 40 và WMA 20 ngày ROC > 1
Trong đó, công thức tính ROC 20 ngày của WMA là:
\[ROC = (WMA_{today}/WMA_{20days ago} - 1) \times 100\]
Lợi thế chiến lược
- Sử dụng RSI để xác định xu hướng và tránh bị mất tiền khi thị trường rung động
- WMA đánh giá các xu hướng chính trong việc giảm tiếng ồn
- RSI và WMA ROC được sử dụng để lọc hiệu quả các tín hiệu không liên quan
- Sử dụng nhiều ATR ngẫu nhiên dừng, theo dõi dừng có thể khóa lợi nhuận linh hoạt
- Phương pháp quản lý tiền có thể điều chỉnh quy mô vị trí tùy theo lợi nhuận và kiểm soát rủi ro
Rủi ro chiến lược
- Các tham số chiến lược không phù hợp có thể dẫn đến giao dịch thường xuyên, khuyến nghị tối ưu hóa tham số
- Đặt điểm dừng không đúng cách có thể làm tăng tổn thất
- Một chiến lược theo dõi xu hướng, không phù hợp với thị trường chứng khoán chấn động
- Cần chú ý đến sự thay đổi môi trường vĩ mô, cân bằng bằng tay nếu cần thiết
Hướng tối ưu hóa chiến lược
- Kiểm tra độ dài RSI, độ dài WMA, và ngưỡng ROC để tìm ra sự kết hợp tối ưu
- Kiểm tra các phương pháp quản lý tiền khác nhau để tìm ra giải pháp điều chỉnh vị trí tốt nhất
- Thêm các chỉ số khác để lọc tín hiệu hơn nữa
- Kết hợp chiến lược dừng lỗ để giảm rủi ro tổn thất đơn lẻ
- Tối ưu hóa chiến lược dừng lại để tăng lợi nhuận khi có xu hướng
Tóm tắt
Chiến lược này sử dụng hai chỉ số RSI và WMA để đánh giá xu hướng xu hướng, để lấy lợi nhuận từ xu hướng chính. Đồng thời sử dụng quản lý tài chính và chiến lược kiểm soát rủi ro dừng lại, có một số giá trị thực tế. Tuy nhiên, thiết lập tham số và cơ chế dừng lỗ cần được kiểm tra và tối ưu hóa liên tục để có được hiệu quả tốt hơn.
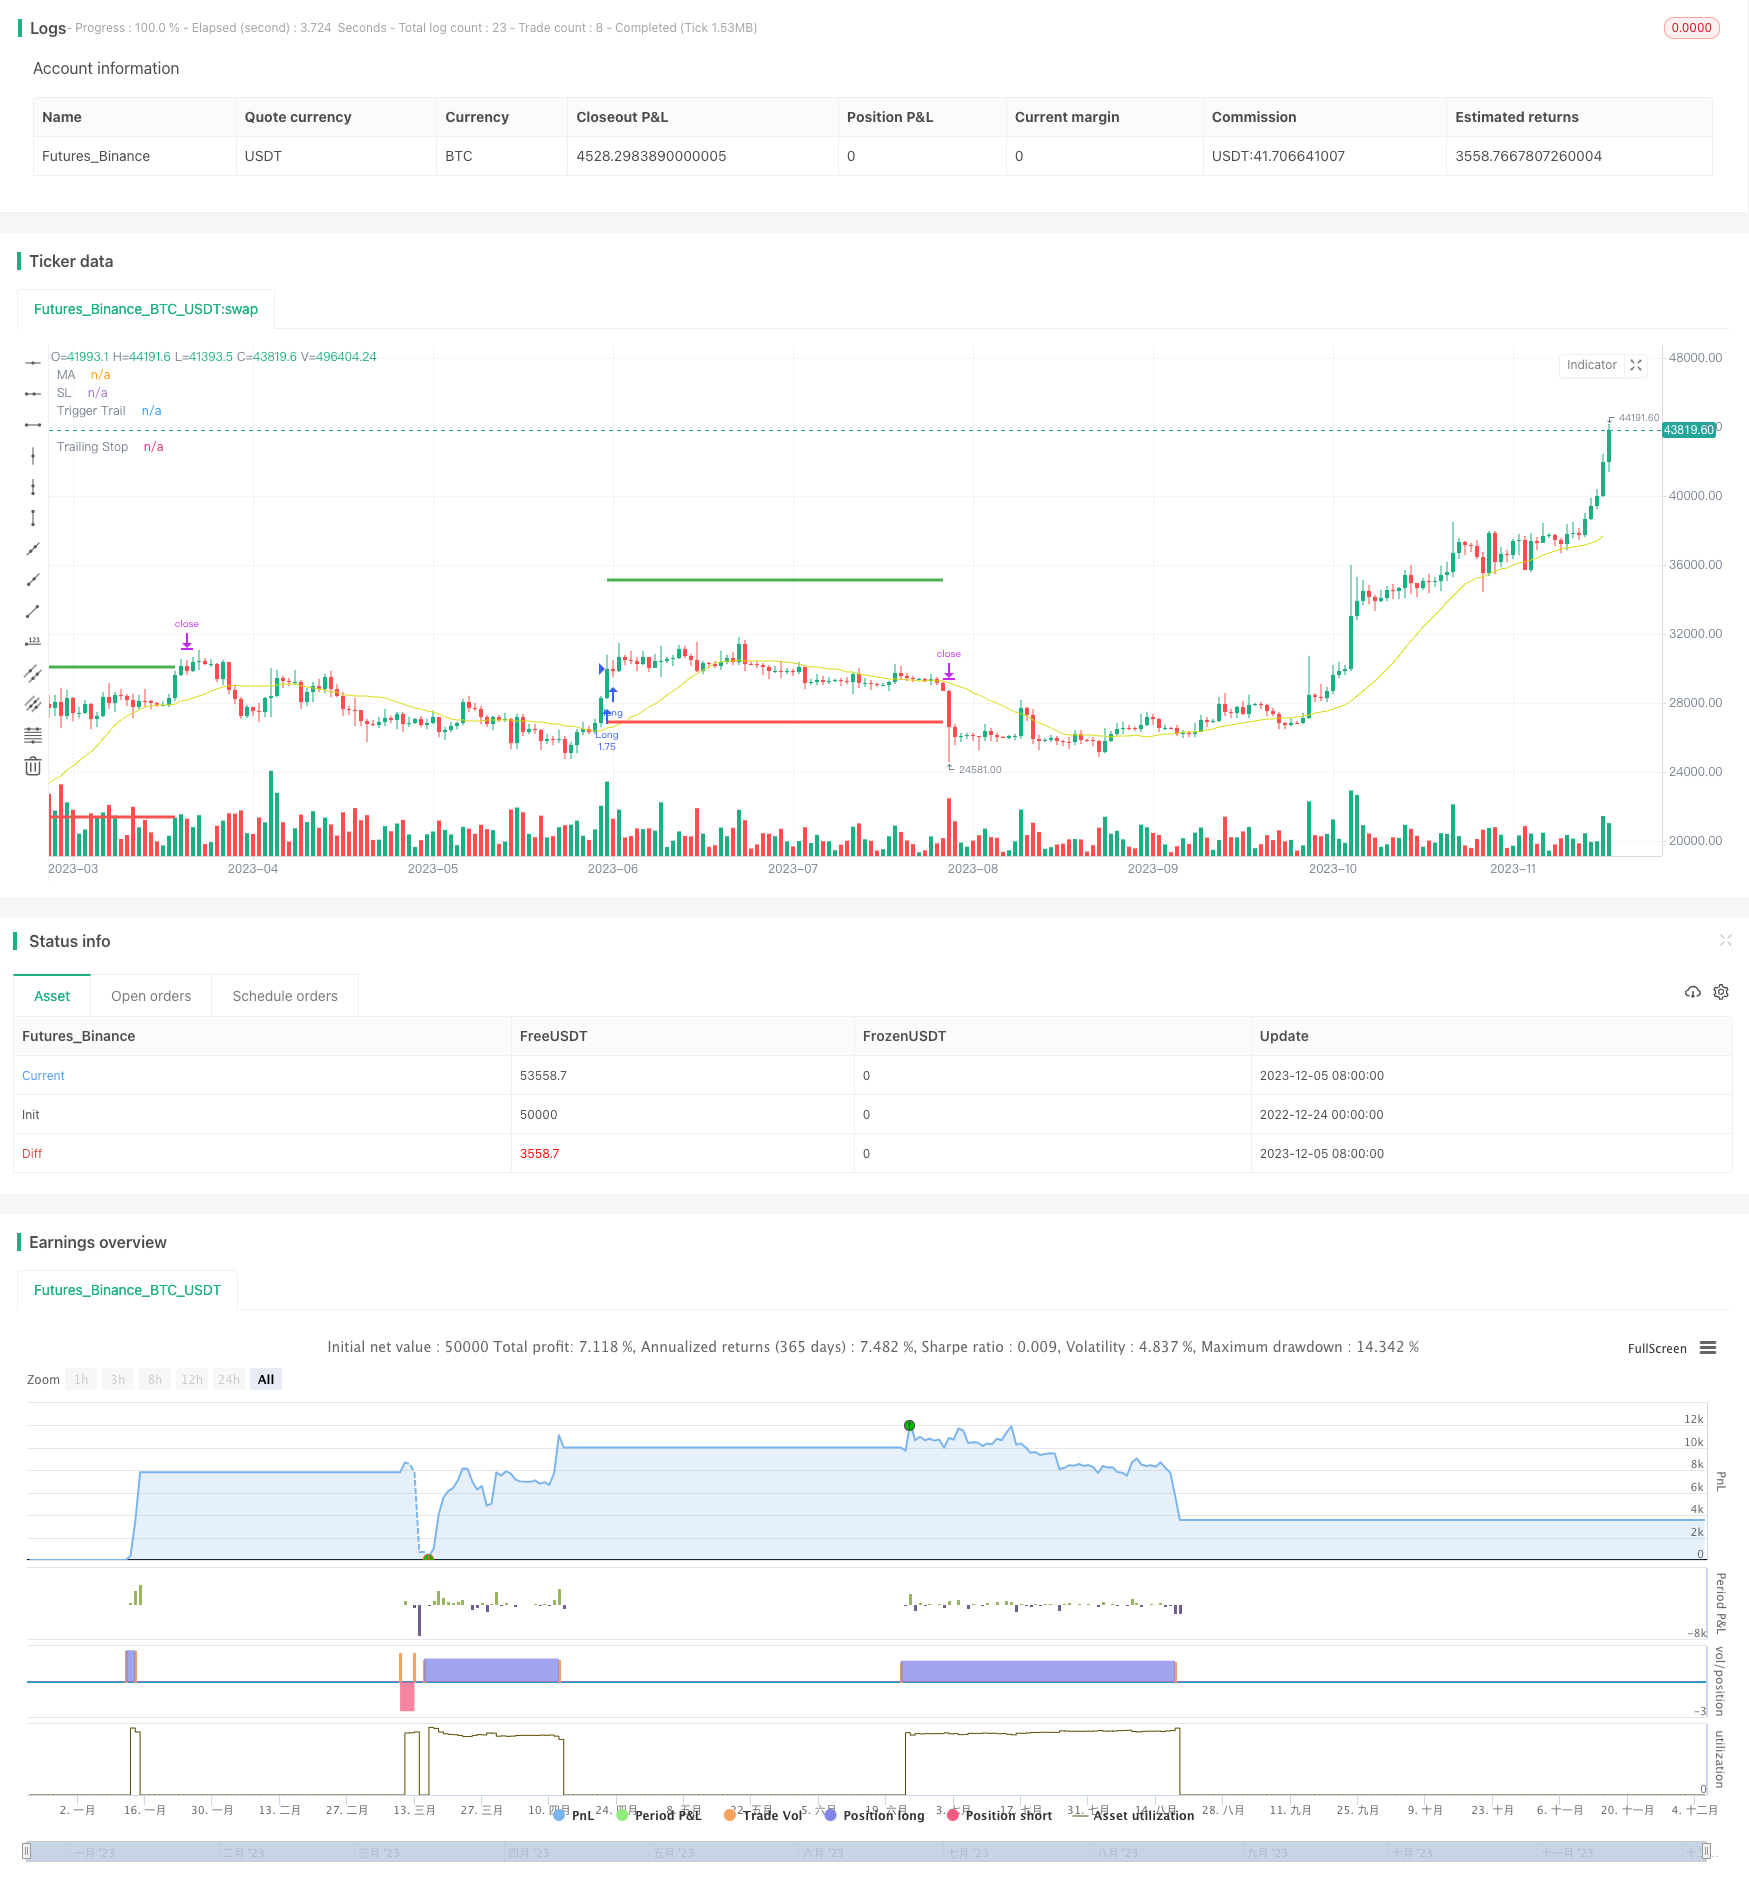
/*backtest
start: 2022-12-24 00:00:00
end: 2023-12-06 05:20:00
period: 1d
basePeriod: 1h
exchanges: [{"eid":"Futures_Binance","currency":"BTC_USDT"}]
*/

// This source code is subject to the terms of the Mozilla Public License 2.0 at https://mozilla.org/MPL/2.0/
// © gsanson66


//This code is based on RSI and a backed weighted MA
//@version=5
strategy("RSI + MA BACKTESTING", overlay=true, initial_capital=1000, default_qty_type=strategy.fixed, commission_type=strategy.commission.percent, commission_value=0.18, slippage=3)


//------------------------TOOL TIPS---------------------------//

t1 = "Choice between a Standard MA (SMA) or a backed-weighted MA (RWMA) which permits to minimize the impact of short term reversal. Default is RWMA."
t2 = "Value of RSI to send a LONG or a SHORT signal. RSI above 60 is a LONG signal and RSI below 40 is a SHORT signal."
t3 = "Rate of Change Value of selected MA to send a LONG or a SHORT signal. By default : ROC MA below -1 is a LONG signal and ROC MA above 1 is a SHORT signal"
t4 = "Threshold value to trigger trailing Take Profit. This threshold is calculated as a multiple of the ATR (Average True Range)."
t5 = "Percentage value of trailing Take Profit. This Trailing TP follows the profit if it increases, remaining selected percentage below it, but stops if the profit decreases."
t6 = "Each gain or losse (relative to the previous reference) in an amount equal to this fixed ratio will change quantity of orders."
t7 = "The amount of money to be added to or subtracted from orders once the fixed ratio has been reached."


//------------------------FUNCTIONS---------------------------//

//@function which calculate a retro weighted moving average to minimize the impact of short term reversal
rwma(source, length) =>
    sum = 0.0
    denominator = 0.0
    weight = 0.0
    weight_x = 100/(4+(length-4)*1.30)
    weight_y = 1.30*weight_x
    for i=0 to length - 1
        if i <= 3
            weight := weight_x
        else
            weight := weight_y
        sum := sum + source[i] * weight
        denominator := denominator + weight
    rwma = sum/denominator

//@function which permits the user to choose a moving average type
ma(source, length, type) =>
    switch type
        "SMA" => ta.sma(source, length)
        "RWMA" => rwma(source, length)

//@function Displays text passed to `txt` when called.
debugLabel(txt, color) =>
    label.new(bar_index, high, text = txt, color=color, style = label.style_label_lower_right, textcolor = color.black, size = size.small)

//@function which looks if the close date of the current bar falls inside the date range
inBacktestPeriod(start, end) => (time >= start) and (time <= end)


//--------------------------------USER INPUTS-------------------------------//

//Technical parameters
rsiLengthInput = input.int(20, minval=1, title="RSI Length", group="RSI Settings")
maTypeInput = input.string("RWMA", title="MA Type", options=["SMA", "RWMA"], group="MA Settings", inline="1", tooltip=t1)
maLenghtInput = input.int(20, minval=1, title="MA Length", group="MA Settings", inline="1")
rsiLongSignalValue = input.int(60, minval=1, maxval=99, title="RSI Long Signal", group="Strategy parameters", inline="3")
rsiShortSignalValue = input.int(40, minval=1, maxval=99, title="RSI Short Signal", group="Strategy parameters", inline="3", tooltip=t2)
rocMovAverLongSignalValue = input.float(-1, maxval=0, title="ROC MA Long Signal", group="Strategy parameters", inline="4")
rocMovAverShortSignalValue = input.float(1, minval=0, title="ROC MA Short Signal", group="Strategy parameters", inline="4", tooltip=t3)
//TP Activation and Trailing TP
takeProfitActivationInput = input.float(5, minval=1.0, title="TP activation in multiple of ATR", group="Strategy parameters", tooltip=t4)
trailingStopInput = input.float(3, minval=0, title="Trailing TP in percentage", group="Strategy parameters", tooltip=t5)
//Money Management
fixedRatio = input.int(defval=400, minval=1, title="Fixed Ratio Value ($)", group="Money Management", tooltip=t6)
increasingOrderAmount = input.int(defval=200, minval=1, title="Increasing Order Amount ($)", group="Money Management", tooltip=t7)
//Backtesting period
startDate = input(title="Start Date", defval=timestamp("1 Jan 2018 00:00:00"), group="Backtesting Period")
endDate = input(title="End Date", defval=timestamp("1 July 2024 00:00:00"), group="Backtesting Period")


//------------------------------VARIABLES INITIALISATION-----------------------------//

float rsi = ta.rsi(close, rsiLengthInput)
float ma = ma(close, maLenghtInput, maTypeInput)
float roc_ma = ((ma/ma[maLenghtInput]) - 1)*100
float atr = ta.atr(20)
var float trailingStopOffset = na
var float trailingStopActivation = na
var float trailingStop = na
var float stopLoss = na
var bool long = na
var bool short = na
var bool bufferTrailingStopDrawing = na
float theoreticalStopPrice = na
bool inRange = na
equity = math.abs(strategy.equity - strategy.openprofit)
strategy.initial_capital = 50000
var float capital_ref = strategy.initial_capital
var float cashOrder = strategy.initial_capital * 0.95


//------------------------------CHECKING SOME CONDITIONS ON EACH SCRIPT EXECUTION-------------------------------//

//Checking if the date belong to the range
inRange := true

//Checking performances of the strategy
if equity > capital_ref + fixedRatio
    spread = (equity - capital_ref)/fixedRatio
    nb_level = int(spread)
    increasingOrder = nb_level * increasingOrderAmount
    cashOrder := cashOrder + increasingOrder
    capital_ref := capital_ref + nb_level*fixedRatio
if equity < capital_ref - fixedRatio
    spread = (capital_ref - equity)/fixedRatio
    nb_level = int(spread)
    decreasingOrder = nb_level * increasingOrderAmount
    cashOrder := cashOrder - decreasingOrder
    capital_ref := capital_ref - nb_level*fixedRatio

//Checking if we close all trades in case where we exit the backtesting period
if strategy.position_size!=0 and not inRange
    debugLabel("END OF BACKTESTING PERIOD : we close the trade", color=color.rgb(116, 116, 116))
    strategy.close_all()
    bufferTrailingStopDrawing := false
    stopLoss := na
    trailingStopActivation := na
    trailingStop := na
    short := false
    long := false


//------------------------------STOP LOSS AND TRAILING STOP ACTIVATION----------------------------//

// We handle the stop loss and trailing stop activation
if (low <= stopLoss or high >= trailingStopActivation) and long
    if high >= trailingStopActivation
        bufferTrailingStopDrawing := true
    else if low <= stopLoss
        long := false
    stopLoss := na
    trailingStopActivation := na
if (low <= trailingStopActivation or high >= stopLoss) and short
    if low <= trailingStopActivation
        bufferTrailingStopDrawing := true
    else if high >= stopLoss
        short := false
    stopLoss := na
    trailingStopActivation := na


//-------------------------------------TRAILING STOP--------------------------------------//

// If the traling stop is activated, we manage its plotting with the bufferTrailingStopDrawing
if bufferTrailingStopDrawing and long
    theoreticalStopPrice := high - trailingStopOffset * syminfo.mintick
    if na(trailingStop)
        trailingStop := theoreticalStopPrice
    else if theoreticalStopPrice > trailingStop
        trailingStop := theoreticalStopPrice
    else if low <= trailingStop
        trailingStop := na
        bufferTrailingStopDrawing := false
        long := false
if bufferTrailingStopDrawing and short
    theoreticalStopPrice := low + trailingStopOffset * syminfo.mintick
    if na(trailingStop)
        trailingStop := theoreticalStopPrice
    else if theoreticalStopPrice < trailingStop
        trailingStop := theoreticalStopPrice
    else if high >= trailingStop
        trailingStop := na
        bufferTrailingStopDrawing := false
        short := false


//---------------------------------LONG CONDITION--------------------------//

if rsi >= 60 and roc_ma <= rocMovAverLongSignalValue and inRange and not long
    if short
        bufferTrailingStopDrawing := false
        stopLoss := na
        trailingStopActivation := na
        trailingStop := na
        short := false
    trailingStopActivation := close + takeProfitActivationInput*atr
    trailingStopOffset := (trailingStopActivation * trailingStopInput/100) / syminfo.mintick
    stopLoss := close - 3*atr
    long := true
    qty = cashOrder/close
    strategy.entry("Long", strategy.long, qty)
    strategy.exit("Exit Long", "Long", stop = stopLoss, trail_price = trailingStopActivation,
                 trail_offset = trailingStopOffset)


//--------------------------------SHORT CONDITION-------------------------------//

if rsi <= 40 and roc_ma >= rocMovAverShortSignalValue and inRange and not short
    if long
        bufferTrailingStopDrawing := false
        stopLoss := na
        trailingStopActivation := na
        trailingStop := na
        long := false
    trailingStopActivation := close - takeProfitActivationInput*atr
    trailingStopOffset := (trailingStopActivation * trailingStopInput/100) / syminfo.mintick
    stopLoss := close + 3*atr
    short := true
    qty = cashOrder/close
    strategy.entry("Short", strategy.short, qty)
    strategy.exit("Exit Short", "Short", stop = stopLoss, trail_price = trailingStopActivation,
                 trail_offset = trailingStopOffset)


//--------------------------------PLOTTING ELEMENT---------------------------------//

// Plotting of element in the graph
plotchar(rsi, "RSI", "", location.top, color.rgb(0, 214, 243))
plot(ma, "MA", color.rgb(219, 219, 18))
plotchar(roc_ma, "ROC MA", "", location.top, color=color.orange)
// Visualizer trailing stop and stop loss movement
plot(stopLoss, "SL", color.red, 3, plot.style_linebr)
plot(trailingStopActivation, "Trigger Trail", color.green, 3, plot.style_linebr)
plot(trailingStop, "Trailing Stop",  color.blue, 3, plot.style_linebr)