Chiến lược tích lũy đột phá dựa trên việc lọc thanh quan trọng
Tổng quan
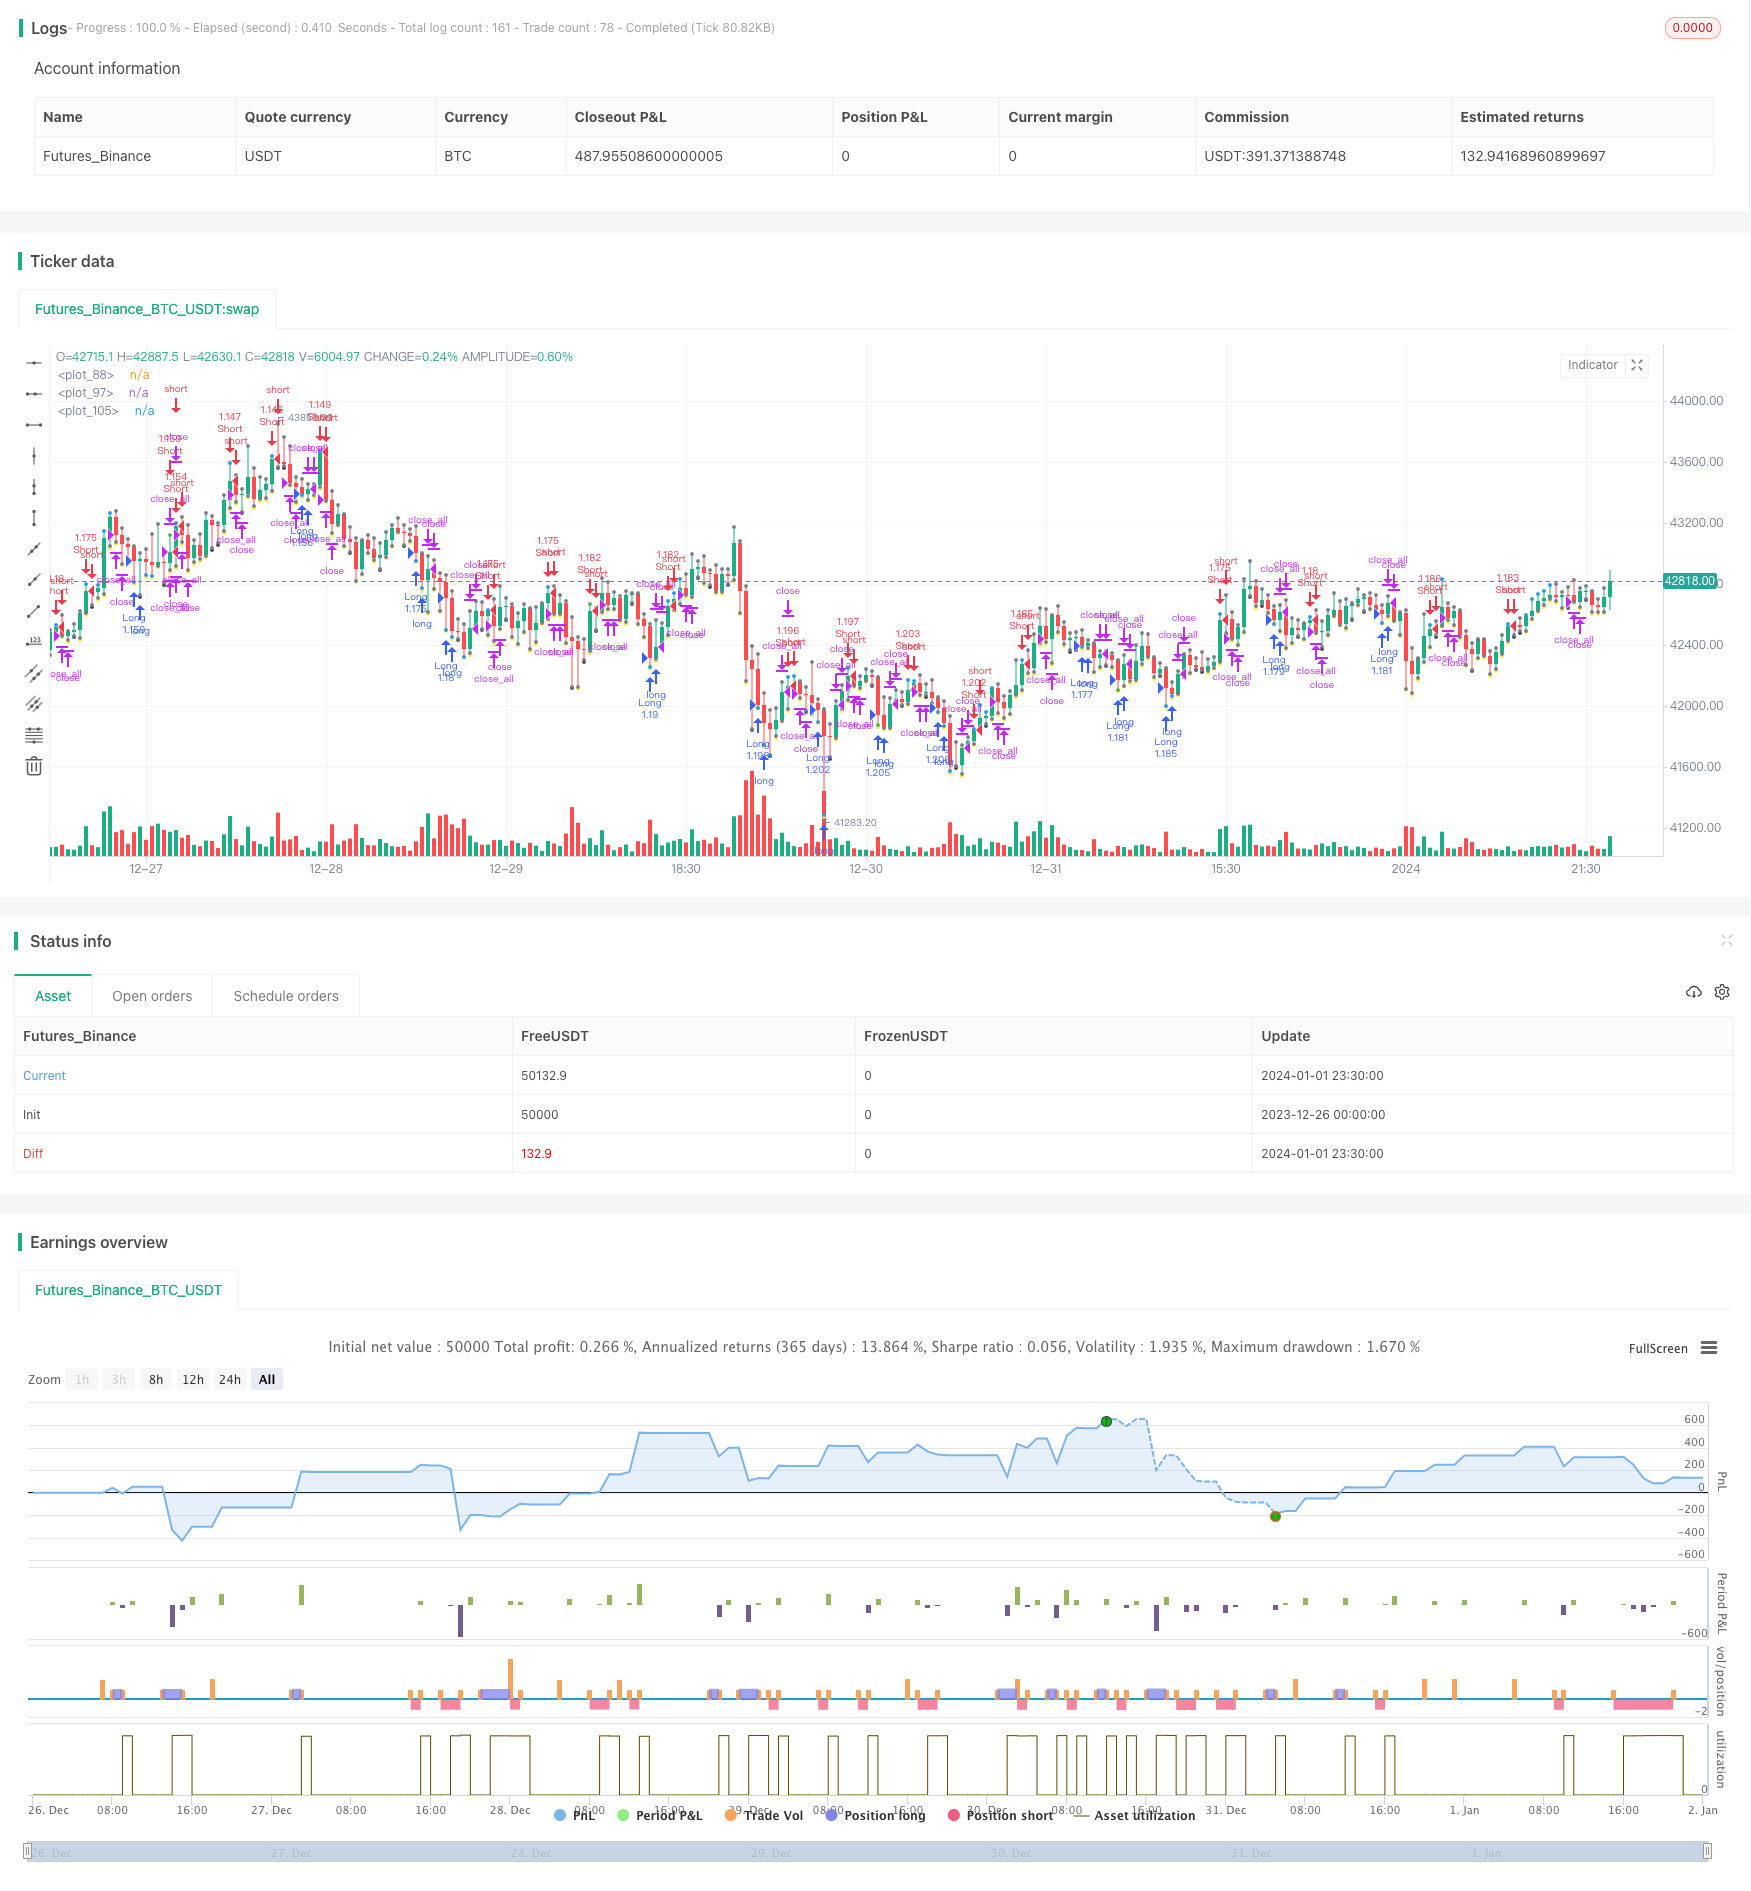
Chiến lược này dự đoán xu hướng bằng cách đánh giá các nốt cột quan trọng của đường K và kết hợp với tín hiệu đột phá để phát tín hiệu giao dịch. Chiến lược sẽ lọc các nốt K quá nhỏ, chỉ phân tích các nốt cột quan trọng, có thể tránh bị nhiễu bởi các nốt nhỏ quá thường xuyên, làm cho tín hiệu trở nên ổn định và đáng tin cậy hơn.
Nguyên tắc chiến lược
Xác định chiều dài thực thể của dòng K hiện tại, nếu lớn hơn 3 lần so với giá trị trung bình của 6 dòng K trước đó, thì nó được coi là trục trục có ý nghĩa.
Nếu 3 sợi dây liên tiếp có nghĩa là sợi dây cột là sợi dương, nó sẽ được coi là tín hiệu đa đầu; nếu 3 sợi dây liên tiếp có nghĩa là sợi dây cột là sợi âm, nó sẽ được coi là tín hiệu đầu trống.
Trong khi đánh giá tín hiệu, nếu giá vượt qua trước khi cao hoặc thấp, tín hiệu giao dịch bổ sung cũng sẽ được tạo ra.
Sử dụng đường SMA trung bình làm bộ lọc, chỉ mở lệnh khi giá vượt SMA.
Sau khi giữ vị trí, nếu giá lại phá vỡ điểm vào hoặc đường trung bình SMA, vị trí sẽ bị xóa.
Phân tích lợi thế
Sử dụng trục trục trục trục trục trục trục trục trục trục trục trục trục trục trục trục trục trục trục trục trục trục trục trục trục trục trục trục trục trục trục trục trục trục trục trục trục trục trục trục trục trục trục trục trục trục trục trục trục trục trục trục trục trục trục trục trục trục trục trục trục trục trục trục trục trục trục trục trục trục trục trục trục trục trục trục trục trục trục trục trục trục trục trục trục.
Kết hợp tín hiệu xu hướng và tín hiệu đột phá, có thể cải thiện chất lượng tín hiệu và giảm tín hiệu giả.
Hình thức lọc đường SMA trung bình có thể giúp bạn không bị theo đuổi giá cao và giá thấp. Mua dưới mức đóng cửa, bán trên mức đóng cửa, tăng độ tin cậy của tín hiệu.
Thiết lập các điều kiện dừng lỗ, có thể dừng lỗ kịp thời, có lợi cho việc bảo vệ tiền.
Phân tích rủi ro
Chiến lược này là cực đoan hơn, sử dụng tín hiệu phán đoán 3 đường K, có thể đánh giá sai lầm các biến động ngắn hạn là một xu hướng đảo ngược.
Dữ liệu thử nghiệm không đầy đủ, hiệu quả có thể khác nhau giữa các giống và chu kỳ khác nhau.
Không tham gia vào kiểm soát vị trí giao dịch qua đêm, có nguy cơ giao dịch qua đêm.
Hướng tối ưu hóa
Các tham số cho các trục trục cột có ý nghĩa có thể được tối ưu hóa hơn nữa, chẳng hạn như số lượng đường K được đánh giá, định nghĩa của các trục trục có ý nghĩa.
Có thể kiểm tra ảnh hưởng của các tham số chu kỳ khác nhau đến hiệu quả, tìm kiếm chu kỳ tối ưu.
Có thể thêm ATR để kiểm soát rủi ro.
Có thể xem xét thêm logic kiểm soát vị trí hàng đêm.
Tóm tắt
Chiến lược này sử dụng các bước lọc và định hướng của đường cột có ý nghĩa, kết hợp với tín hiệu giao dịch hình thành đột phá, có thể lọc hiệu quả các biến động nhỏ không cần thiết, tín hiệu rõ ràng và đáng tin cậy hơn. Tuy nhiên, do thời gian phán đoán ngắn, có thể có một số rủi ro sai lầm. Có thể được cải thiện hơn nữa thông qua các phương tiện tối ưu hóa tham số và kiểm soát gió.
/*backtest
start: 2023-12-26 00:00:00
end: 2024-01-02 00:00:00
period: 30m
basePeriod: 15m
exchanges: [{"eid":"Futures_Binance","currency":"BTC_USDT"}]
*/

//AlexInc
//2018

// закрытие - вычислить и в течение скольки-то баров его добиваться
// если нет, то по первому противоположному
// по стоп-лоссу в любом случае - стоп вычислить

//@version=2
strategy(title = "AlexInc's Bar v1.2", shorttitle = "AlexInc Bar 1.2", overlay = true, default_qty_type = strategy.percent_of_equity, default_qty_value = 100, pyramiding = 0)

//Settings
needlong = input(true, defval = true, title = "Long")
needshort = input(true, defval = true, title = "Short")
usemar = input(false, defval = false, title = "Use Martingale")
tryprofitbars = input(6, defval = 6, minval = 1, maxval = 100, title = "Number of candles to take profit anyway")
capital = input(100, defval = 100, minval = 1, maxval = 10000, title = "Capital, %")

useSMAfilter = input(false, defval = true, title = "Use SMA filter")
SMAlimit = input(10, defval = 10, minval = 1, maxval = 30, title = "SMA filter limit")
bodysizeMlt = input(3, defval = 3, minval = 1, maxval = 10, title = "Body Size Multiplier")
meanfulbardiv = input(3, title = "Meanful Bar size Divider")

showarr = input(false, defval = false, title = "Show Arrows")
fromyear = input(2018, defval = 2018, minval = 1900, maxval = 2100, title = "From Year")
toyear = input(2100, defval = 2100, minval = 1900, maxval = 2100, title = "To Year")
frommonth = input(01, defval = 01, minval = 01, maxval = 12, title = "From Month")
tomonth = input(12, defval = 12, minval = 01, maxval = 12, title = "To Month")
fromday = input(01, defval = 01, minval = 01, maxval = 31, title = "From day")
today = input(31, defval = 31, minval = 01, maxval = 31, title = "To day")

//SMA #
index = 0
index := barstate.isfirst ==true ? 0 : nz(index[1])+1

buyindex = 0
buyindex := barstate.isfirst ==true ? 0 : buyindex[1]

sellindex = 0
sellindex := barstate.isfirst ==true ? 0 : sellindex[1]

//predictprofit = barstate.isfirst ==true ? 0 : predictprofit[1]

smafilter = sma(close, SMAlimit)

//Body
body = abs(close - open)
range = abs(high - low)
abody = sma(body, 6)

max3 = 0
if body >= body[1] and body >= body[2]
    max3 := body
else
    if body[1] >= body and body[1] >= body[2]
        max3 := body[1]
    else
        if body[2] >= body and body[2] >= body[1]
            max3 := body[2]

prevmax3 = 0
prevmax3 := nz(max3[1])


bar = close > open ? 1 : close < open ? -1 : 0
firstbullishopen = 0
firstbullishopen := bar == 1 and bar[1] != 1 ? open : nz(firstbullishopen[1])
firstbearishopen = 0
firstbearishopen := bar == -1 and bar[1] != -1 ? open : nz(firstbearishopen[1])

meanfulbar = body > abody / meanfulbardiv

meanfulbearish = 0
meanfulbearish := nz(meanfulbearish[1])

meanfulbullish = 0
meanfulbullish := nz(meanfulbullish[1])

if meanfulbar
    if bar == 1
        meanfulbullish := 1 + meanfulbullish
        meanfulbearish := 0
    else
        if bar == -1
            meanfulbearish := 1 + meanfulbearish
            meanfulbullish := 0


plot(min(low, high)-10, style=circles, color = meanfulbar ? yellow:black, linewidth=3)

//Signals
up1 = (meanfulbearish >= 3) and (close < firstbullishopen or 1) and (strategy.position_size == 0 or close < strategy.position_avg_price) and body > abody / 5 and (useSMAfilter == false or close < smafilter)
if up1 == true
	predictprofit = sma(body, 3)
up2 = sma(bar, 1) == -1 and body > prevmax3 * bodysizeMlt and (strategy.position_size == 0 or close < strategy.position_avg_price) and body > abody / 5 and (useSMAfilter == false or close < smafilter)
if up2 == true
	predictprofit = body * 0.5
plot(min(low, high), style=circles, color = up1?blue:up2?green:gray, linewidth=3)

dn1 = (meanfulbullish >= 3) and (close > firstbearishopen or 1)  and (strategy.position_size == 0 or close > strategy.position_avg_price) and body > abody / 5 and (useSMAfilter==false or close > smafilter)
if dn1 ==true
	predictprofit = sma(body, 3)
dn2 = sma(bar, 1) == 1 and body > prevmax3 * bodysizeMlt and (strategy.position_size == 0 or close > strategy.position_avg_price) and body > abody / 5 and (useSMAfilter==false or close > smafilter)
if dn2 ==true
	predictprofit = body * 0.5
plot(max(low, high), style=circles, color = dn1?blue:dn2?green:gray, linewidth=3)


exit = (((strategy.position_size > 0 and bar == 1 ) or (strategy.position_size < 0 and bar == -1)) and body > abody / 2 )
// or index >= buyindex (or sellindex) + tryprofitbars


//Arrows
col = exit ? black : up1 or dn1 ? blue : up2 or dn2 ? red : na
needup = up1 or up2
needdn = dn1 or dn2
needexitup = exit and strategy.position_size < 0
needexitdn = exit and strategy.position_size > 0
plotarrow(showarr and needup ? 1 : na, colorup = blue, colordown = blue, transp = 0)
plotarrow(showarr and needdn ? -1 : na, colorup = blue, colordown = blue, transp = 0)
plotarrow(showarr and needexitup ? 1 : na, colorup = black, colordown = black, transp = 0)
plotarrow(showarr and needexitdn ? -1 : na, colorup = black, colordown = black, transp = 0)


//Trading
profit = exit ? ((strategy.position_size > 0 and close > strategy.position_avg_price) or (strategy.position_size < 0 and close < strategy.position_avg_price)) ? 1 : -1 : profit[1]
mult = usemar ? exit ? profit == -1 ? mult[1] * 2 : 1 : mult[1] : 1
lot = strategy.position_size == 0 ? strategy.equity / close * capital / 100 * mult : lot[1]

if up1 or up2
    if strategy.position_size < 0
        strategy.close_all()
		buyindex = index
		sellindex = index
	if strategy.position_size == 0
		buyindex = index


    strategy.entry("Long", strategy.long, needlong == false ? 0 : lot )

if dn1 or dn2
    if strategy.position_size > 0
        strategy.close_all()
		buyindex = index
		sellindex = index
	if strategy.position_size == 0
		sellindex = index

    strategy.entry("Short", strategy.short, needshort == false ? 0 : lot )

if  exit
    strategy.close_all()