Chiến lược kênh giá dải Bollinger Bands Breakout và Smart Reversal
Tổng quan
Chiến lược này là một chiến lược đột phá kết hợp nhiều phạm vi thời gian (khoảng 1 phút, 5 phút, 15 phút, 1 giờ và 4 giờ) để phát hiện vùng hỗ trợ và kháng cự trên biểu đồ.
Nguyên tắc chiến lược
Chiến lược này sử dụng dải Brin và cổng giá để xác định vùng hỗ trợ và kháng cự. Đầu tiên, nó tính toán đường trung bình di chuyển đơn giản (SMA) và chênh lệch tiêu chuẩn (STDEV) dựa trên giá đóng cửa cho mỗi khoảng thời gian để xác định đường đi lên xuống. Sau đó, nó phát hiện đường nét phá vỡ khối, được xác định dựa trên sự phá vỡ của giá từ mức hỗ trợ hoặc kháng cự và khối lượng giao dịch.
Một khi đã phát hiện ra một khối phá vỡ, nó sẽ tạo ra một tín hiệu mua nếu giá phá vỡ đường mòn; nếu phá vỡ đường mòn, nó sẽ tạo ra một tín hiệu bán. Chiến lược này cũng vẽ một kênh giá cho mỗi khoảng thời gian, cho thấy mức hỗ trợ và kháng cự.
Ngoài ra, chiến lược này đặt mức giới hạn dừng cho mỗi khoảng thời gian. Điều này có nghĩa là mức giá được chỉ định cho vị trí phải được thanh toán bằng cách kiếm lợi nhuận. Đồng thời, mức dừng lỗ cũng được đặt để hạn chế tổn thất.
Phân tích lợi thế
- Sử dụng phân tích đa khoảng thời gian để đánh giá toàn diện hơn về xu hướng thị trường
- Kết hợp các khối đột phá, các đường dẫn và khối lượng giao dịch, làm cho tín hiệu đáng tin cậy hơn
- Cài đặt Stop Loss để giúp kiểm soát rủi ro
Phân tích rủi ro
- Thiết lập tham số băng thông Brin không đúng có thể dẫn đến tín hiệu giả
- Sự phá vỡ có thể là tiếng ồn thị trường ngắn hạn, tạo ra rủi ro bị mắc kẹt
- Phân tích nhiều thời gian làm tăng sự phức tạp của chiến lược
Bạn có thể tránh rủi ro hơn nữa bằng cách tối ưu hóa tham số Brin, tăng thời gian nắm giữ hoặc thiết lập dừng lỗ.
Hướng tối ưu hóa
Chiến lược này có thể được tối ưu hóa theo các khía cạnh sau:
Tối ưu hóa các tham số Brin để đường ray lên xuống phản ánh tốt hơn hỗ trợ và kháng cự thực tế
Thêm các thuật toán học máy để đánh giá hướng và sức mạnh của đột phá
Tăng chỉ số biến động giá cổ phiếu để xác định thời điểm tốt nhất để mua và bán
Kết hợp các chỉ số khác như MACD, KD để đánh giá xu hướng và năng lượng
Tóm tắt
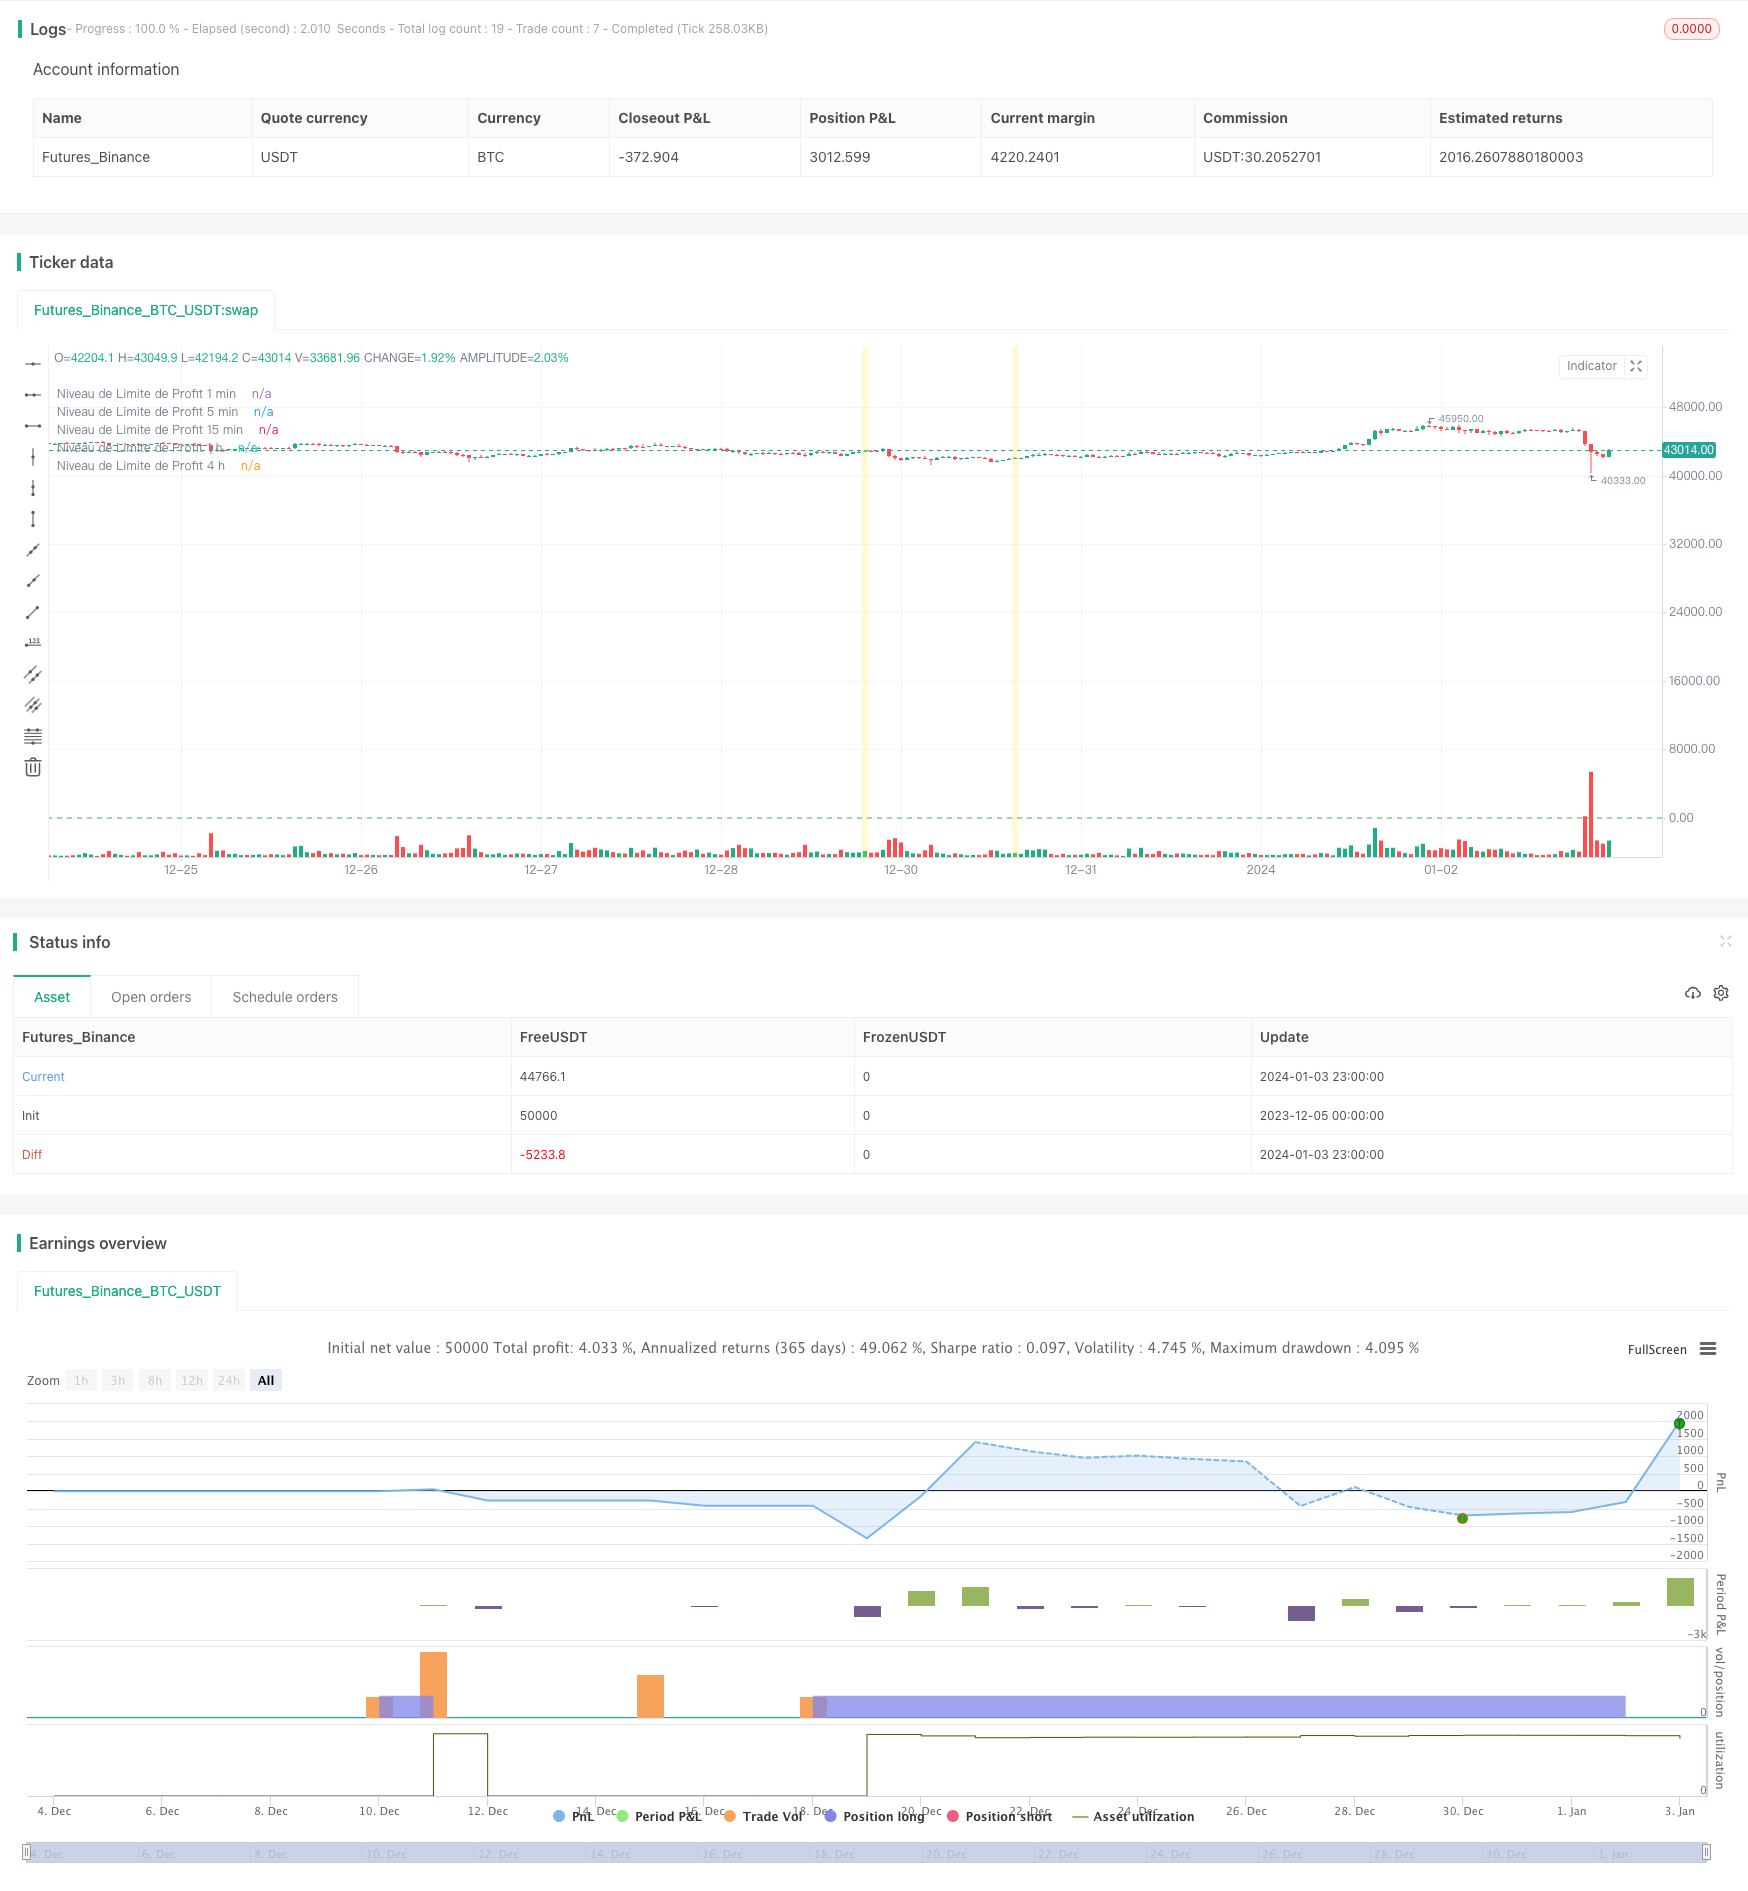
Chiến lược này tích hợp phân tích các chỉ số kỹ thuật trên nhiều phạm vi thời gian, quản lý rủi ro bằng cách phá vỡ giao dịch, dừng lỗ, là một chiến lược giao dịch hệ thống phá vỡ linh hoạt và đáng tin cậy. Tuy nhiên, thiết lập tham số và kiểm soát rủi ro vẫn cần được kiểm tra và tối ưu hóa liên tục dựa trên thị trường thực tế.
/*backtest
start: 2023-12-05 00:00:00
end: 2024-01-04 00:00:00
period: 1h
basePeriod: 15m
exchanges: [{"eid":"Futures_Binance","currency":"BTC_USDT"}]
*/

//@version=5
strategy("DZ Strategy ICT", overlay=true)

// Paramètres de l'indicateur
length1 = input.int(14, minval=1, title='Longueur 1 min')
deviations1 = input.float(2.0, title='Déviations 1 min')
multiplier1 = input.float(1.0, minval=0.1, maxval=10, title='Multiplicateur 1 min')
fibonacciLevel1 = input.float(0.618, title='Niveau de Fibonacci 1 min')
displacement1 = input.int(3, minval=1, title='Décalage de Displacement 1 min')
volumeThreshold1 = input.float(1.0, minval=0, title='Seuil de Volume 1 min')
fibLevelInput1 = input.float(0.0, "Niveau de Limite de Profit 1 min", minval=0.0)

length5 = input.int(14, minval=1, title='Longueur 5 min')
deviations5 = input.float(2.0, title='Déviations 5 min')
multiplier5 = input.float(1.0, minval=0.1, maxval=10, title='Multiplicateur 5 min')
fibonacciLevel5 = input.float(0.618, title='Niveau de Fibonacci 5 min')
displacement5 = input.int(3, minval=1, title='Décalage de Displacement 5 min')
volumeThreshold5 = input.float(1.0, minval=0, title='Seuil de Volume 5 min')
fibLevelInput5 = input.float(0.0, "Niveau de Limite de Profit 5 min", minval=0.0)

length15 = input.int(14, minval=1, title='Longueur 15 min')
deviations15 = input.float(2.0, title='Déviations 15 min')
multiplier15 = input.float(1.0, minval=0.1, maxval=10, title='Multiplicateur 15 min')
fibonacciLevel15 = input.float(0.618, title='Niveau de Fibonacci 15 min')
displacement15 = input.int(3, minval=1, title='Décalage de Displacement 15 min')
volumeThreshold15 = input.float(1.0, minval=0, title='Seuil de Volume 15 min')
fibLevelInput15 = input.float(0.0, "Niveau de Limite de Profit 15 min", minval=0.0)

length60 = input.int(14, minval=1, title='Longueur 1 h')
deviations60 = input.float(2.0, title='Déviations 1 h')
multiplier60 = input.float(1.0, minval=0.1, maxval=10, title='Multiplicateur 1 h')
fibonacciLevel60 = input.float(0.618, title='Niveau de Fibonacci 1 h')
displacement60 = input.int(3, minval=1, title='Décalage de Displacement 1 h')
volumeThreshold60 = input.float(1.0, minval=0, title='Seuil de Volume 1 h')
fibLevelInput60 = input.float(0.0, "Niveau de Limite de Profit 1 h", minval=0.0)

length240 = input.int(14, minval=1, title='Longueur 4 h')
deviations240 = input.float(2.0, title='Déviations 4 h')
multiplier240 = input.float(1.0, minval=0.1, maxval=10, title='Multiplicateur 4 h')
fibonacciLevel240 = input.float(0.618, title='Niveau de Fibonacci 4 h')
displacement240 = input.int(3, minval=1, title='Décalage de Displacement 4 h')
volumeThreshold240 = input.float(1.0, minval=0, title='Seuil de Volume 4 h')
fibLevelInput240 = input.float(0.0, "Niveau de Limite de Profit 4 h", minval=0.0)

// Calcul des supports et résistances pour chaque plage de temps
basis1 = ta.sma(close, length1)
range_1 = multiplier1 * ta.stdev(close, length1)
upper1 = basis1 + deviations1 * range_1
lower1 = basis1 - deviations1 * range_1

basis5 = ta.sma(close, length5)
range_5 = multiplier5 * ta.stdev(close, length5)
upper5 = basis5 + deviations5 * range_5
lower5 = basis5 - deviations5 * range_5

basis15 = ta.sma(close, length15)
range_15 = multiplier15 * ta.stdev(close, length15)
upper15 = basis15 + deviations15 * range_15
lower15 = basis15 - deviations15 * range_15

basis60 = ta.sma(close, length60)
range_60 = multiplier60 * ta.stdev(close, length60)
upper60 = basis60 + deviations60 * range_60
lower60 = basis60 - deviations60 * range_60

basis240 = ta.sma(close, length240)
range_240 = multiplier240 * ta.stdev(close, length240)
upper240 = basis240 + deviations240 * range_240
lower240 = basis240 - deviations240 * range_240

// Calcul du volume moyen sur chaque période donnée
averageVolume1 = ta.sma(volume, length1)
averageVolume5 = ta.sma(volume, length5)
averageVolume15 = ta.sma(volume, length15)
averageVolume60 = ta.sma(volume, length60)
averageVolume240 = ta.sma(volume, length240)

// Détection du Breaker Block en fonction du déplacement et du volume pour chaque plage de temps
breakerBlock1 = ta.crossover(close[displacement1], lower1) and volume > volumeThreshold1 * averageVolume1
breakerBlock1 := breakerBlock1 or (ta.crossunder(close[displacement1], upper1) and volume > volumeThreshold1 * averageVolume1)

breakerBlock5 = ta.crossover(close[displacement5], lower5) and volume > volumeThreshold5 * averageVolume5
breakerBlock5 := breakerBlock5 or (ta.crossunder(close[displacement5], upper5) and volume > volumeThreshold5 * averageVolume5)

breakerBlock15 = ta.crossover(close[displacement15], lower15) and volume > volumeThreshold15 * averageVolume15
breakerBlock15 := breakerBlock15 or (ta.crossunder(close[displacement15], upper15) and volume > volumeThreshold15 * averageVolume15)

breakerBlock60 = ta.crossover(close[displacement60], lower60) and volume > volumeThreshold60 * averageVolume60
breakerBlock60 := breakerBlock60 or (ta.crossunder(close[displacement60], upper60) and volume > volumeThreshold60 * averageVolume60)

breakerBlock240 = ta.crossover(close[displacement240], lower240) and volume > volumeThreshold240 * averageVolume240
breakerBlock240 := breakerBlock240 or (ta.crossunder(close[displacement240], upper240) and volume > volumeThreshold240 * averageVolume240)

// Affichage du Breaker Block sur le graphique
bgcolor(breakerBlock1 ? color.new(color.yellow, 70) : na)
bgcolor(breakerBlock5 ? color.new(color.yellow, 70) : na)
bgcolor(breakerBlock15 ? color.new(color.yellow, 70) : na)
bgcolor(breakerBlock60 ? color.new(color.yellow, 70) : na)
bgcolor(breakerBlock240 ? color.new(color.yellow, 70) : na)

// Définition de la zone limite de l'ordre de profit pour chaque plage de temps
fibLevel1 = basis1 * fibonacciLevel1
fibLevel5 = basis5 * fibonacciLevel5
fibLevel15 = basis15 * fibonacciLevel15
fibLevel60 = basis60 * fibonacciLevel60
fibLevel240 = basis240 * fibonacciLevel240

// Signal d'achat modifié en fonction du Breaker Block et du déplacement pour chaque plage de temps
buySignal1 = ta.crossover(close[displacement1], lower1) and volume > volumeThreshold1 * averageVolume1
buySignal5 = ta.crossover(close[displacement5], lower5) and volume > volumeThreshold5 * averageVolume5
buySignal15 = ta.crossover(close[displacement15], lower15) and volume > volumeThreshold15 * averageVolume15
buySignal60 = ta.crossover(close[displacement60], lower60) and volume > volumeThreshold60 * averageVolume60
buySignal240 = ta.crossover(close[displacement240], lower240) and volume > volumeThreshold240 * averageVolume240

// Signal de vente modifié en fonction du Breaker Block et du déplacement pour chaque plage de temps
sellSignal1 = ta.crossunder(close[displacement1], upper1) and volume > volumeThreshold1 * averageVolume1
sellSignal5 = ta.crossunder(close[displacement5], upper5) and volume > volumeThreshold5 * averageVolume5
sellSignal15 = ta.crossunder(close[displacement15], upper15) and volume > volumeThreshold15 * averageVolume15
sellSignal60 = ta.crossunder(close[displacement60], upper60) and volume > volumeThreshold60 * averageVolume60
sellSignal240 = ta.crossunder(close[displacement240], upper240) and volume > volumeThreshold240 * averageVolume240


// Tracé des niveaux de limite de profit pour chaque plage de temps
hline(fibLevelInput1, color=color.green, linestyle=hline.style_dashed, title="Niveau de Limite de Profit 1 min")
hline(fibLevelInput5, color=color.green, linestyle=hline.style_dashed, title="Niveau de Limite de Profit 5 min")
hline(fibLevelInput15, color=color.green, linestyle=hline.style_dashed, title="Niveau de Limite de Profit 15 min")
hline(fibLevelInput60, color=color.green, linestyle=hline.style_dashed, title="Niveau de Limite de Profit 1 h")
hline(fibLevelInput240, color=color.green, linestyle=hline.style_dashed, title="Niveau de Limite de Profit 4 h")

// Définition des ordres de vente et d'achat pour chaque plage de temps
if buySignal1
    strategy.entry("Achat 1 min", strategy.long)

if sellSignal1
    strategy.entry("Vente 1 min", strategy.short)

if buySignal5
    strategy.entry("Achat 5 min", strategy.long)

if sellSignal5
    strategy.entry("Vente 5 min", strategy.short)

if buySignal15
    strategy.entry("Achat 15 min", strategy.long)

if sellSignal15
    strategy.entry("Vente 15 min", strategy.short)

if buySignal60
    strategy.entry("Achat 1 h", strategy.long)

if sellSignal60
    strategy.entry("Vente 1 h", strategy.short)

if buySignal240
    strategy.entry("Achat 4 h", strategy.long)

if sellSignal240
    strategy.entry("Vente 4 h", strategy.short)

// Configuration des ordres de sortie (Take Profit) pour chaque plage de temps
profitRatio = 2
stopLossRatio = 1

stopLossLevel1 = strategy.position_avg_price * (1 - stopLossRatio / (stopLossRatio + profitRatio))
stopLossLevel5 = strategy.position_avg_price * (1 - stopLossRatio / (stopLossRatio + profitRatio))
stopLossLevel15 = strategy.position_avg_price * (1 - stopLossRatio / (stopLossRatio + profitRatio))
stopLossLevel60 = strategy.position_avg_price * (1 - stopLossRatio / (stopLossRatio + profitRatio))
stopLossLevel240 = strategy.position_avg_price * (1 - stopLossRatio / (stopLossRatio + profitRatio))

strategy.exit("Stop Loss 1 min", "Achat 1 min", stop=stopLossLevel1)
strategy.exit("Stop Loss 1 min", "Vente 1 min", stop=stopLossLevel1)

strategy.exit("Stop Loss 5 min", "Achat 5 min", stop=stopLossLevel5)
strategy.exit("Stop Loss 5 min", "Vente 5 min", stop=stopLossLevel5)

strategy.exit("Stop Loss 15 min", "Achat 15 min", stop=stopLossLevel15)
strategy.exit("Stop Loss 15 min", "Vente 15 min", stop=stopLossLevel15)

strategy.exit("Stop Loss 1 h", "Achat 1 h", stop=stopLossLevel60)
strategy.exit("Stop Loss 1 h", "Vente 1 h", stop=stopLossLevel60)