Chiến lược lợi nhuận ngắn hạn dựa trên mô hình RSI V
Ngày tạo:
2024-01-12 13:52:55
sửa đổi lần cuối:
2024-01-12 13:52:55
sao chép:
2
Số nhấp chuột:
869
1
tập trung vào
1750
Người theo dõi
Tổng quan
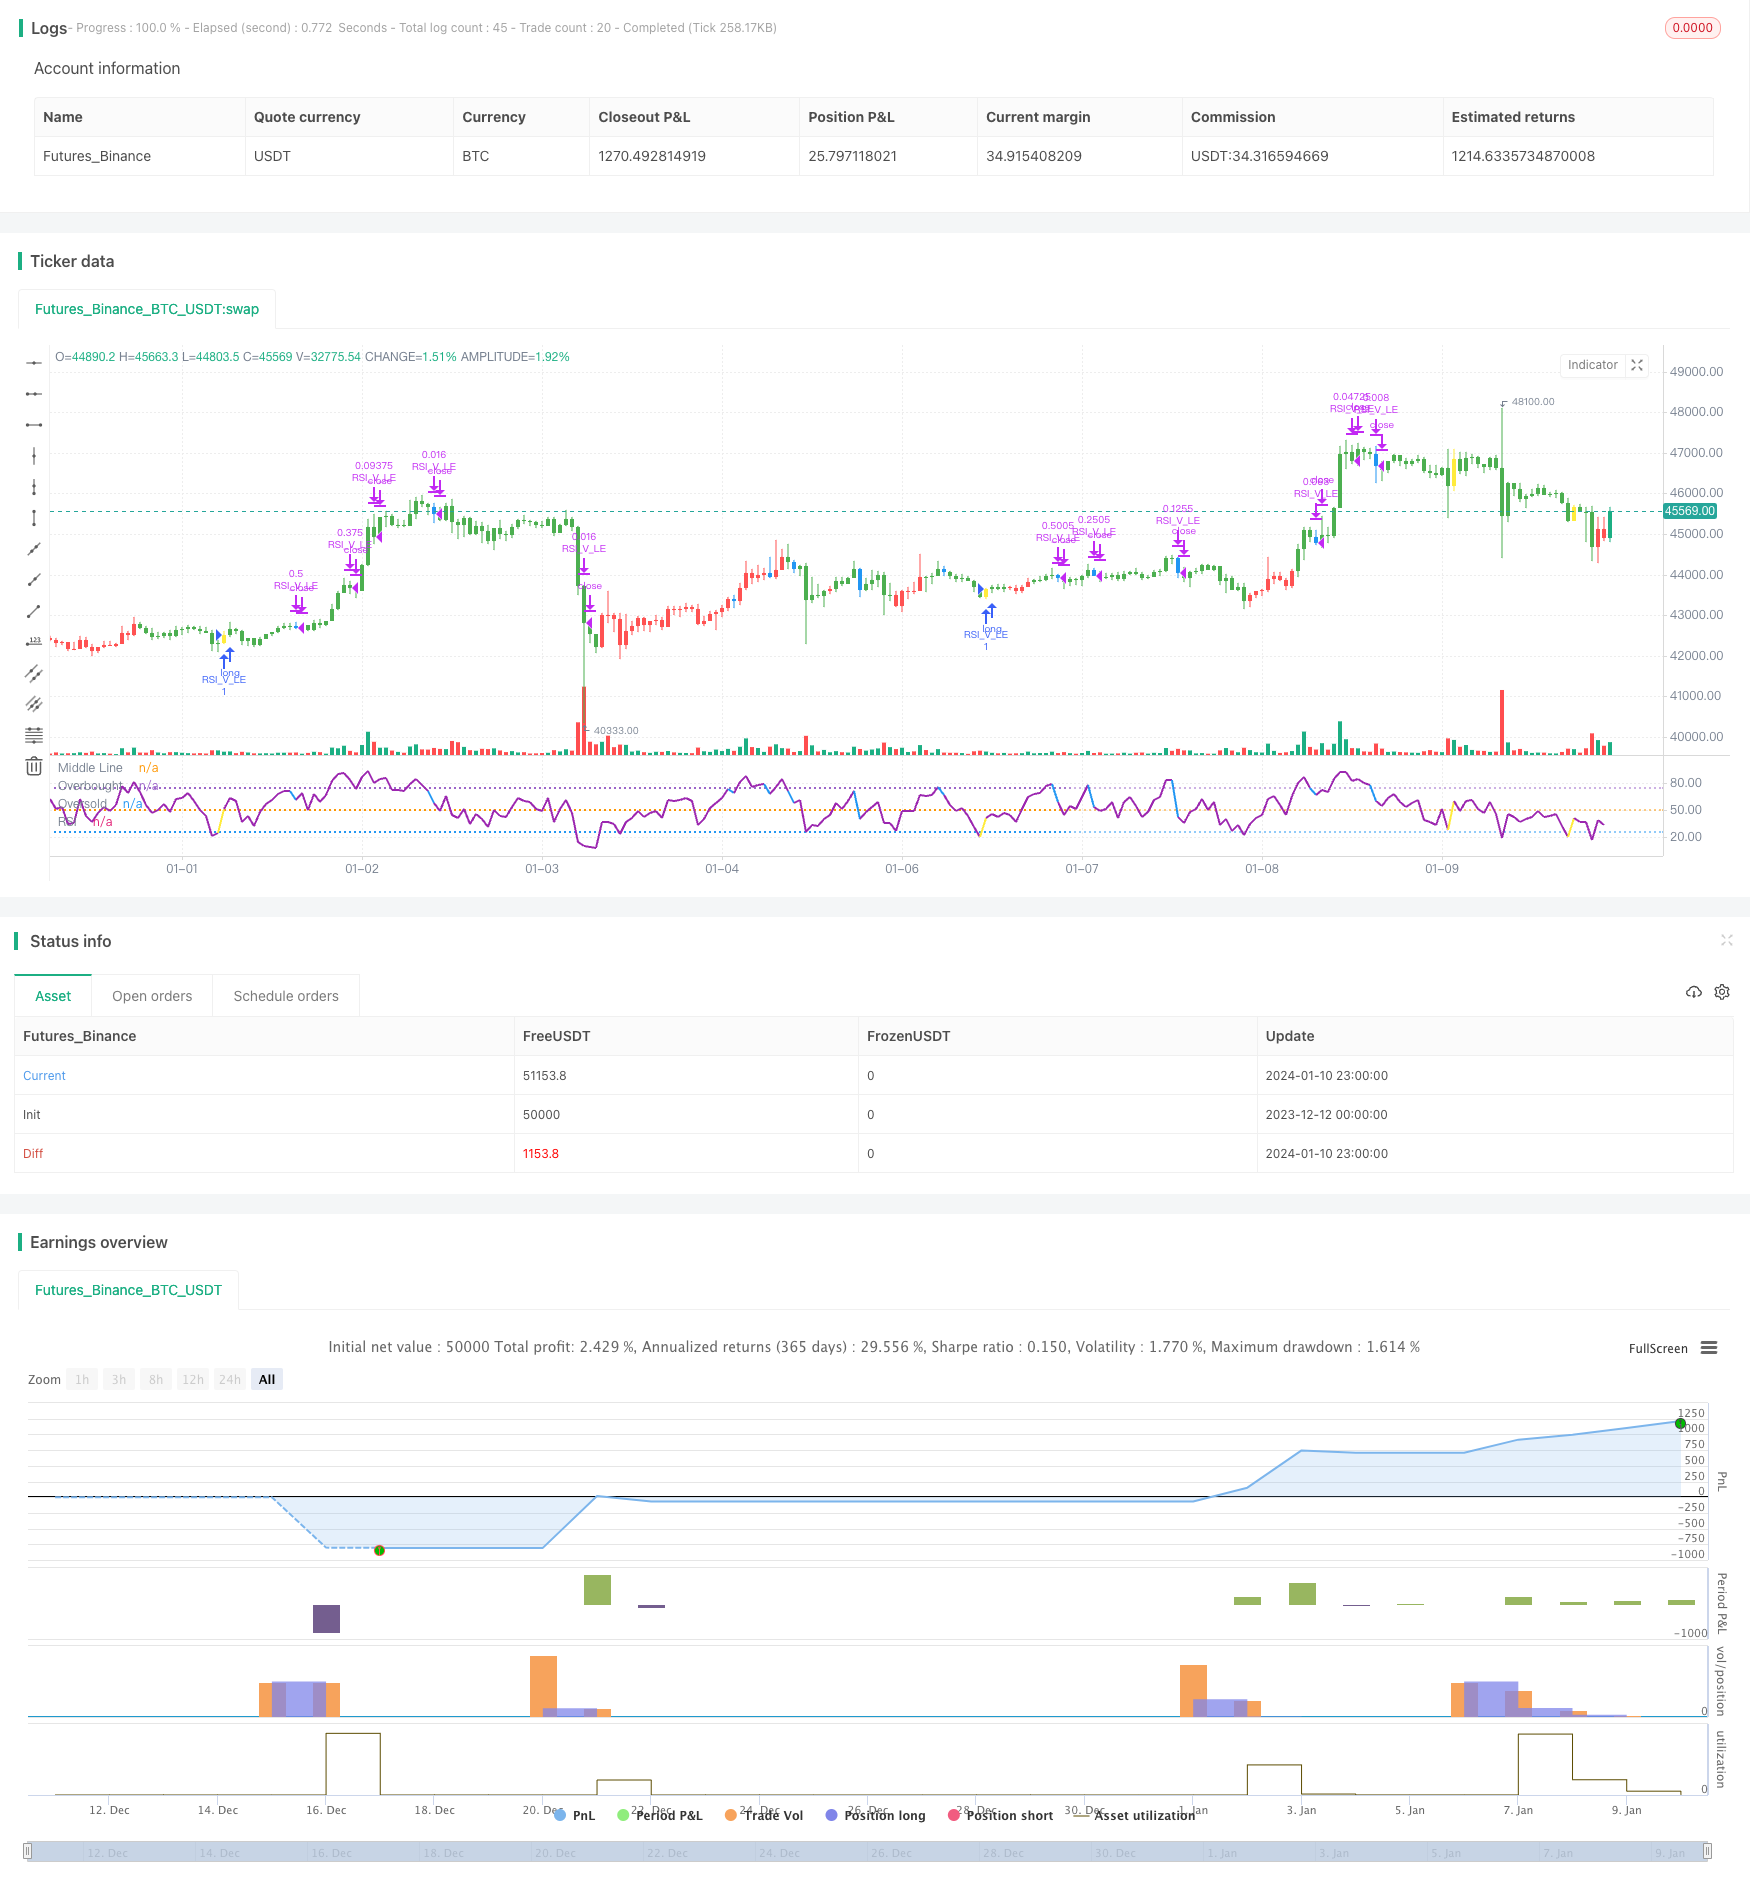
Chiến lược này dựa trên hình dạng V của chỉ số RSI, phối hợp với bộ lọc đường trung bình của EMA, tạo ra chiến lược lợi nhuận ngắn đáng tin cậy hơn. Nó có thể nắm bắt cơ hội hình thành giá trong khu vực bán tháo, thông qua tín hiệu hình dạng V của chỉ số RSI, làm nhiều hơn chính xác để đạt được lợi nhuận trên đường ngắn.
Nguyên tắc chiến lược
- Sử dụng đường 20 ngày trên đường 50 ngày để đánh giá đường dài
- RSI hình thành hình V, cho thấy cơ hội tăng giá
- Điểm thấp nhất của dòng K trước đó thấp hơn điểm thấp nhất của hai dòng K trước đó
- RSI đường K hiện tại cao hơn RSI của hai đường K trước
- RSI trên đeo 30 như là một dấu hiệu hoàn thành hình V, làm nhiều hơn
- Đặt mức dừng lỗ dưới 8% giá nhập cảnh
- RSI vượt qua 70 bắt đầu vị trí, dừng lỗ chuyển sang giá nhập
- RSI vượt qua 90 bắt đầu tzinfo 3⁄4 lệnh
- RSI vượt qua 10 / stop loss trigger, tất cả đều bằng phẳng
Phân tích lợi thế
- Sử dụng đường trung bình EMA để đánh giá xu hướng lớn, tránh hoạt động ngược
- RSI V hình thức đánh giá cơ hội phục hồi khu vực bán tháo, nắm bắt xu hướng đảo ngược
- Kiểm soát rủi ro của MLS
Phân tích rủi ro
- Thị trường chứng khoán có thể không dừng lại, gây ra tổn thất lớn
- Các tín hiệu hình dạng RSI V có thể bị lỗi, dẫn đến tổn thất không cần thiết
Hướng tối ưu hóa
- Tối ưu hóa các tham số RSI để tìm kiếm hình thức RSI V đáng tin cậy hơn
- Kết hợp với các chỉ số khác để đánh giá độ tin cậy của tín hiệu đảo ngược
- Tối ưu hóa chiến lược dừng lỗ, dừng lỗ kịp thời trong khi ngăn chặn quá mạnh mẽ
Tóm tắt
Chiến lược này tích hợp các bộ lọc EMA và RSI V hình thức phán đoán, tạo thành một bộ các chiến lược hoạt động ngắn hạn đáng tin cậy hơn. Nó có thể nắm bắt hiệu quả các cơ hội của khu vực bán tháo vượt mức, thu lợi nhuận trên đường ngắn.
Mã nguồn chiến lược
/*backtest
start: 2023-12-12 00:00:00
end: 2024-01-11 00:00:00
period: 1h
basePeriod: 15m
exchanges: [{"eid":"Futures_Binance","currency":"BTC_USDT"}]
*/

// This source code is subject to the terms of the Mozilla Public License 2.0 at https://mozilla.org/MPL/2.0/
// © mohanee

//@version=4
//strategy("RSI V Pattern", overlay=true)
strategy(title="RSI V Pattern", overlay=false )

//Strategy Rules
//ema20 is above ema50  --- candles are colored  green on the chart
//RSI value sharply coming up which makes a V shape ,  colored in yellow on the chart
//RSI V pattern should occur from below 30

len = input(title="RSI Period", minval=1, defval=5)
stopLoss = input(title="Stop Loss %", minval=1, defval=8)

myRsi = rsi(close,len)

longEmaVal=ema(close,50)
shortEmaVal=ema(close,20)

//plot emas
//plot(longEmaVal, title="Long EMA" ,linewidth=2, color=color.orange, trackprice=true)
//plot(shortEmaVal, title="Short EMA" ,linewidth=2, color=color.green, trackprice=true)


longCondition =  ema(close,20)>ema(close,50)   and (low[1]<low[2] and  low[1]<low[3]) and (myRsi>myRsi[1] and myRsi>myRsi[2] ) and crossover(myRsi,30) //  (   and myRsi<60)

//(myRsi<60 and myRsi>30)  and myRsi>myRsi[1] and (myRsi[1]<myRsi[2]  or  myRsi[1]<myRsi[3]) and (myRsi[2]<30)  and (myRsi[3]<30 and myRsi[4]>=30)


barcolor(shortEmaVal>longEmaVal?color.green:color.red)
//longCondition = crossover(sma(close, 14), sma(close, 28))
barcolor(longCondition?color.yellow:na)
strategy.entry("RSI_V_LE", strategy.long, when=longCondition )
//stoploss value at 10%
stopLossValue=strategy.position_avg_price -  (strategy.position_avg_price*stopLoss/100)
//stopLossValue=valuewhen(longCondition,low,3)


//takeprofit at RSI highest  reading
//at RSI75 move the stopLoss to entry price
moveStopLossUp=strategy.position_size>0 and crossunder(myRsi,70)
barcolor(moveStopLossUp?color.blue:na)
stopLossValue:=crossover(myRsi,70) ? strategy.position_avg_price:stopLossValue

//stopLossValue:=moveStopLossUp?strategy.position_avg_price:stopLossValue
rsiPlotColor=longCondition ?color.yellow:color.purple
rsiPlotColor:= moveStopLossUp ?color.blue:rsiPlotColor
plot(myRsi, title="RSI", linewidth=2, color=rsiPlotColor)
//longCondition?color.yellow:#8D1699)
hline(50, title="Middle Line", linestyle=hline.style_dotted)
obLevel = hline(75, title="Overbought", linestyle=hline.style_dotted)
osLevel = hline(25, title="Oversold", linestyle=hline.style_dotted)
fill(obLevel, osLevel, title="Background", color=#9915FF, transp=90)


//when RSI crossing down 70 , close 1/2 position and move stop loss to average entry price
strategy.close("RSI_V_LE",  qty=strategy.position_size*1/2, when=strategy.position_size>0 and crossunder(myRsi,70))

//when RSI reaches high reading 90 and crossing down close 3/4 position
strategy.close("RSI_V_LE",  qty=strategy.position_size*3/4, when=strategy.position_size>0 and crossunder(myRsi,90))


//close everything when Rsi goes down below to 10 or stoploss hit
//just keeping RSI cross below 10 , can work as stop loss , which also keeps you long in the trade ... however sharp declines could  make large loss
//so I combine RSI goes below 10 OR stoploss hit  , whichever comes first - whole posiition closed
longCloseCondition=crossunder(myRsi,10)  or close<stopLossValue
strategy.close("RSI_V_LE", qty=strategy.position_size,when=longCloseCondition )