Chiến lược kết hợp Bollinger Bands và K-line
Tổng quan
Đây là một chiến lược theo dõi xu hướng sử dụng Bollinger Bands và K-Line Simultaneously như một tín hiệu nhập. Nó được thiết kế để nắm bắt xu hướng trong một khoảng thời gian dài hơn và có thể được áp dụng cho giao dịch ngoại hối.
Nguyên tắc chiến lược
Chiến lược này được thiết lập bằng cách tính toán phạm vi chênh lệch tiêu chuẩn của giá, và băng thông đại diện cho sự biến động của thị trường. Nó được coi là tín hiệu mua quá mức khi giá gần đường lên hoặc đường xuống.
Cụ thể, làm nhiều tín hiệu là: điểm thấp lên phá vỡ đường ray xuống, và có nhiều đầu nuốt hoặc dài dòng K xuống. Tín hiệu làm không là: điểm cao xuống phá vỡ đường ray lên, và có đầu không nuốt hoặc dài dòng K lên.
Phương pháp dừng là giá dừng được đặt trước. Phương pháp dừng là giá dừng một phần khi vượt qua đường trung tâm của Brin.
Phân tích lợi thế
Chiến lược này kết hợp xu hướng và cơ hội quay trở lại. Bollinger Bands có thể nhận ra xu hướng và cơ hội mua bán quá mức. K-Line sẽ đánh giá thời gian quay trở lại và tránh phá vỡ giả.
Cài đặt dừng lỗ rõ ràng, rủi ro có thể kiểm soát được. Thích hợp cho hoạt động đường dài, giảm tần suất giao dịch.
Phân tích rủi ro
Rủi ro lớn nhất của chiến lược này là không nắm bắt được xu hướng hoặc có một cú sốc mạnh.
Ngoài ra, việc dừng chân ra khỏi sân phụ thuộc vào đường giữa, có thể xảy ra trường hợp dừng chân quá sớm hoặc quá muộn.
Có thể tối ưu hóa bằng cách điều chỉnh sự kết hợp các tham số, xác định hình dạng đường K đáng tin cậy hơn, hoặc sửa đổi tiêu chuẩn ngăn chặn theo tỷ lệ dao động.
Hướng tối ưu hóa
Có thể kết hợp với các chỉ số khác để xác định xu hướng chu kỳ lớn, tránh hoạt động ngược. Hoặc thêm thuật toán học máy để xác định sự kết hợp tham số tốt nhất.
Phương pháp dừng cũng có thể được thay đổi để di chuyển dừng hoặc xem xét dừng tỷ lệ dao động để tối đa hóa lợi nhuận.
Tóm tắt
Đây là một chiến lược xu hướng chu kỳ dài dựa trên các chỉ số kỹ thuật Bollinger Bands và K-Line. Nó phù hợp để sử dụng như một chiến lược cơ bản, có một số độ tin cậy và lợi nhuận, nhưng vẫn cần phải được kiểm tra và tối ưu hóa liên tục để tăng sự ổn định.
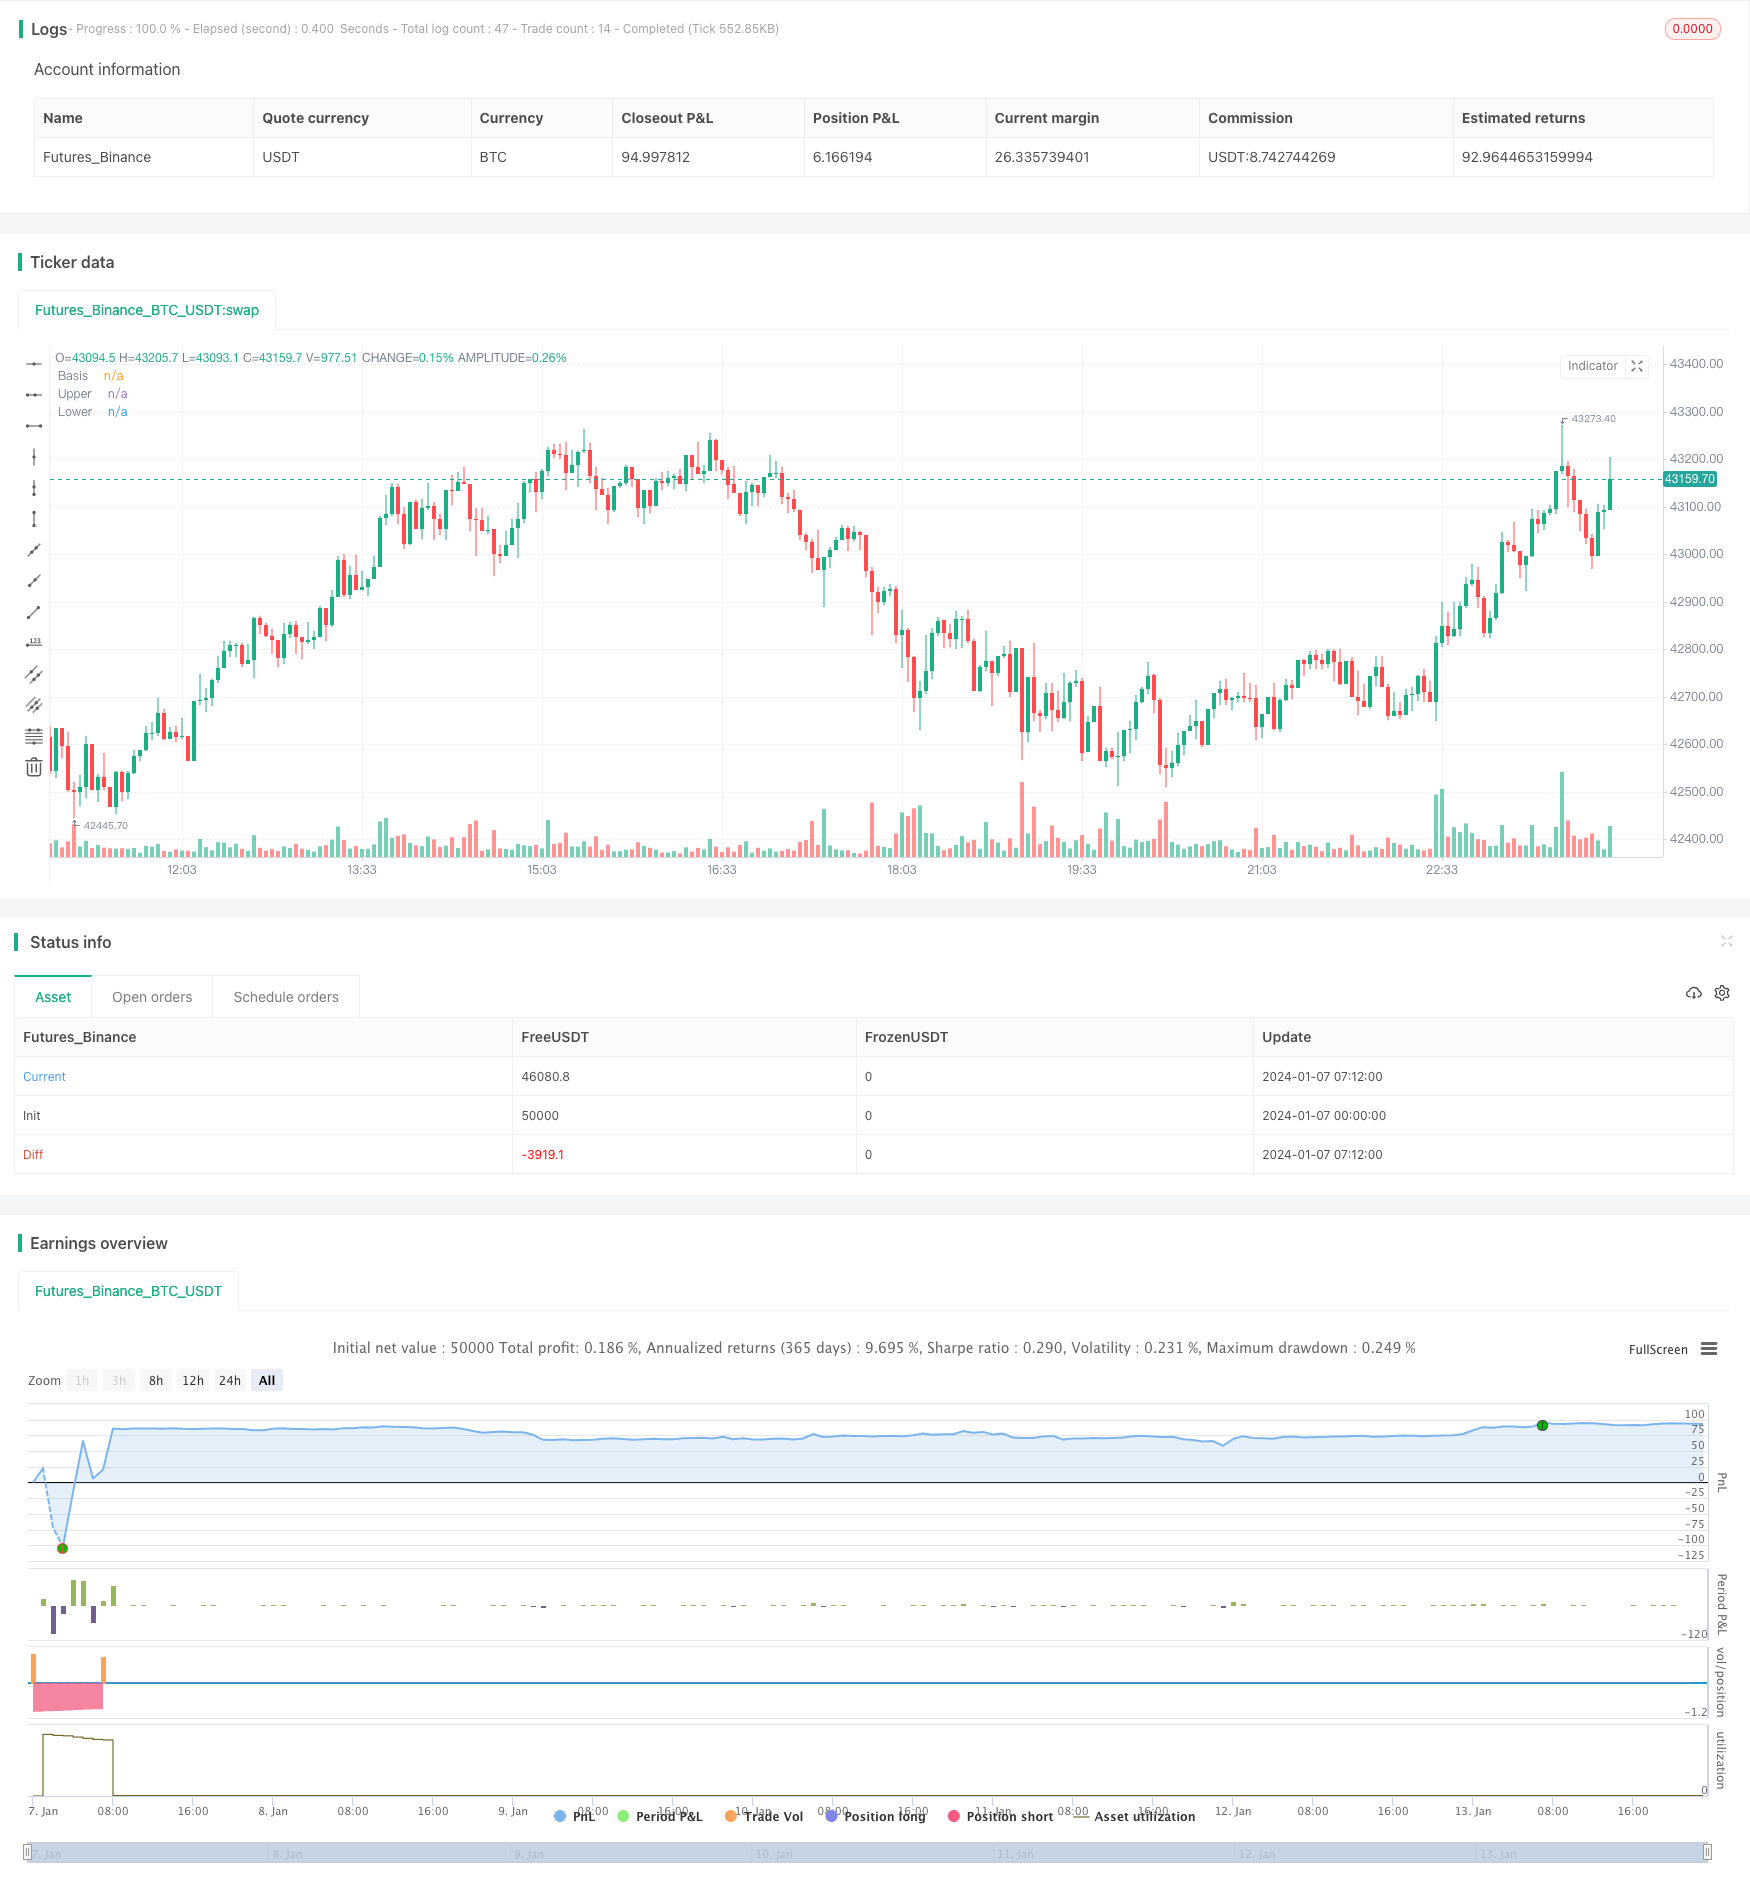
/*backtest
start: 2024-01-07 00:00:00
end: 2024-01-14 00:00:00
period: 3m
basePeriod: 1m
exchanges: [{"eid":"Futures_Binance","currency":"BTC_USDT"}]
*/

//@version=4
strategy("BB策略", overlay=true)
length = input(20, minval=1)
src = input(close, title="Source")
mult = input(2.0, minval=0.001, maxval=50, title="StdDev")
basis = sma(src, length)
dev = mult * stdev(src, length)
upper = basis + dev
lower = basis - dev
offset = input(0, "Offset", type = input.integer, minval = -500, maxval = 500)
plot(basis, "Basis", color=#872323, offset = offset)
p1 = plot(upper, "Upper", color=color.teal, offset = offset)
p2 = plot(lower, "Lower", color=color.teal, offset = offset)
fill(p1, p2, title = "Background", color=#198787, transp=95)
diff=upper-lower
//plot(upper*0.9985, "Upper", color=color.white, offset = offset)
//plot(lower*1.0015, "Lower", color=color.white, offset = offset)

//Engulfing Candles
openBarPrevious = open[1]
closeBarPrevious = close[1]
openBarCurrent = open
closeBarCurrent = close
//If current bar open is less than equal to the previous bar close AND current bar open is less than previous bar open AND current bar close is greater than previous bar open THEN True
bullishEngulfing = openBarCurrent <= closeBarPrevious and openBarCurrent < openBarPrevious and
   closeBarCurrent > openBarPrevious
//If current bar open is greater than equal to previous bar close AND current bar open is greater than previous bar open AND current bar close is less than previous bar open THEN True
bearishEngulfing = openBarCurrent >= closeBarPrevious and openBarCurrent > openBarPrevious and
   closeBarCurrent < openBarPrevious
//bullishEngulfing/bearishEngulfing return a value of 1 or 0; if 1 then plot on chart, if 0 then don't plot
//plotshape(bullishEngulfing, style=shape.triangleup, location=location.belowbar, color=color.green, size=size.tiny)
//plotshape(bearishEngulfing, style=shape.triangledown, location=location.abovebar, color=color.red, size=size.tiny)
//alertcondition(bullishEngulfing, title="Bullish Engulfing", message="[CurrencyPair] [TimeFrame], Bullish candle engulfing previous candle")
//alertcondition(bearishEngulfing, title="Bearish Engulfing", message="[CurrencyPair] [TimeFrame], Bearish candle engulfing previous candle")

//Long Upper Shadow - Bearish
C_Len = 14 // ema depth for bodyAvg
C_ShadowPercent = 5.0 // size of shadows
C_ShadowEqualsPercent = 100.0
C_DojiBodyPercent = 5.0
C_Factor = 2.0 // shows the number of times the shadow dominates the candlestick body
C_BodyHi = max(close, open)
C_BodyLo = min(close, open)
C_Body = C_BodyHi - C_BodyLo
C_BodyAvg = ema(C_Body, C_Len)
C_SmallBody = C_Body < C_BodyAvg
C_LongBody = C_Body > C_BodyAvg
C_UpShadow = high - C_BodyHi
C_DnShadow = C_BodyLo - low
C_HasUpShadow = C_UpShadow > C_ShadowPercent / 100 * C_Body
C_HasDnShadow = C_DnShadow > C_ShadowPercent / 100 * C_Body
C_WhiteBody = open < close
C_BlackBody = open > close
C_Range = high-low
C_IsInsideBar = C_BodyHi[1] > C_BodyHi and C_BodyLo[1] < C_BodyLo
C_BodyMiddle = C_Body / 2 + C_BodyLo
C_ShadowEquals = C_UpShadow == C_DnShadow or (abs(C_UpShadow - C_DnShadow) / C_DnShadow * 100) < C_ShadowEqualsPercent and (abs(C_DnShadow - C_UpShadow) / C_UpShadow * 100) < C_ShadowEqualsPercent
C_IsDojiBody = C_Range > 0 and C_Body <= C_Range * C_DojiBodyPercent / 100
C_Doji = C_IsDojiBody and C_ShadowEquals
patternLabelPosLow = low - (atr(30) * 0.6)
patternLabelPosHigh = high + (atr(30) * 0.6)
C_LongUpperShadowBearishNumberOfCandles = 1
C_LongShadowPercent = 75.0
C_LongUpperShadowBearish = C_UpShadow > C_Range/100*C_LongShadowPercent
//alertcondition(C_LongUpperShadowBearish, title = "Long Upper Shadow", message = "New Long Upper Shadow - Bearish pattern detected.")
//if C_LongUpperShadowBearish
//    var ttBearishLongUpperShadow = "Long Upper Shadow\nTo indicate buyer domination of the first part of a session, candlesticks will present with long upper shadows, as well as short lower shadows, consequently raising bidding prices."
//    label.new(bar_index, patternLabelPosHigh, text="LUS", style=label.style_label_down, color = color.red, textcolor=color.white, tooltip = ttBearishLongUpperShadow)
//gcolor(highest(C_LongUpperShadowBearish?1:0, C_LongUpperShadowBearishNumberOfCandles)!=0 ? color.red : na, offset=-(C_LongUpperShadowBearishNumberOfCandles-1))

C_Len1 = 14 // ema depth for bodyAvg
C_ShadowPercent1 = 5.0 // size of shadows
C_ShadowEqualsPercent1 = 100.0
C_DojiBodyPercent1 = 5.0
C_Factor1 = 2.0 // shows the number of times the shadow dominates the candlestick body

C_BodyHi1 = max(close, open)
C_BodyLo1 = min(close, open)
C_Body1 = C_BodyHi1 - C_BodyLo1
C_BodyAvg1 = ema(C_Body1, C_Len1)
C_SmallBody1 = C_Body1 < C_BodyAvg1
C_LongBody1 = C_Body1 > C_BodyAvg1
C_UpShadow1 = high - C_BodyHi1
C_DnShadow1 = C_BodyLo1 - low
C_HasUpShadow1 = C_UpShadow1 > C_ShadowPercent1 / 100 * C_Body1
C_HasDnShadow1 = C_DnShadow1 > C_ShadowPercent1 / 100 * C_Body1
C_WhiteBody1 = open < close
C_BlackBody1 = open > close
C_Range1 = high-low
C_IsInsideBar1 = C_BodyHi1[1] > C_BodyHi1 and C_BodyLo1[1] < C_BodyLo1
C_BodyMiddle1 = C_Body1 / 2 + C_BodyLo1
C_ShadowEquals1 = C_UpShadow1 == C_DnShadow1 or (abs(C_UpShadow1 - C_DnShadow1) / C_DnShadow1 * 100) < C_ShadowEqualsPercent1 and (abs(C_DnShadow1 - C_UpShadow1) / C_UpShadow1 * 100) < C_ShadowEqualsPercent1
C_IsDojiBody1 = C_Range1 > 0 and C_Body1 <= C_Range1 * C_DojiBodyPercent1 / 100
C_Doji1 = C_IsDojiBody1 and C_ShadowEquals1

patternLabelPosLow1 = low - (atr(30) * 0.6)
patternLabelPosHigh1 = high + (atr(30) * 0.6)

C_LongLowerShadowBullishNumberOfCandles1 = 1
C_LongLowerShadowPercent1 = 75.0
C_LongLowerShadowBullish1 = C_DnShadow1 > C_Range1/100*C_LongLowerShadowPercent1
//alertcondition1(C_LongLowerShadowBullish1, title = "Long Lower Shadow", message = "New Long Lower Shadow - Bullish pattern detected.")

// Make input options that configure backtest date range
startDate = input(title="Start Date", type=input.integer,
     defval=1, minval=1, maxval=31)
startMonth = input(title="Start Month", type=input.integer,
     defval=1, minval=1, maxval=12)
startYear = input(title="Start Year", type=input.integer,
     defval=2018, minval=1800, maxval=2100)
endDate = input(title="End Date", type=input.integer,
     defval=1, minval=1, maxval=31)
endMonth = input(title="End Month", type=input.integer,
     defval=11, minval=1, maxval=12)
endYear = input(title="End Year", type=input.integer,
     defval=2030, minval=1800, maxval=2100)
// Look if the close time of the current bar
// falls inside the date range
inDateRange = true

//多單
if ((bullishEngulfing or C_LongLowerShadowBullish1) and inDateRange and cross(low,lower))
    strategy.entry("L", strategy.long, qty=1,stop=(low[1]))
//strategy.close("L",comment = "L exit",when=cross(basis,close),qty_percent=50)
if crossunder(close,upper*0.9985)
    strategy.close("L",comment = "L exit",qty_percent=1)

//空單
if (((bullishEngulfing == 0) or C_LongUpperShadowBearish) and inDateRange and cross(close,upper))
    strategy.entry("S", strategy.short,qty= 1,stop=(high[1]))
//strategy.close("S",comment = "S exit",when=cross(basis,close),qty_percent=50)
if crossunder(lower*1.0015,close)
    strategy.close("S",comment = "S exit",qty_percent=1)