Chiến lược định lượng kết hợp đường trung bình động ba và MACD
Tổng quan
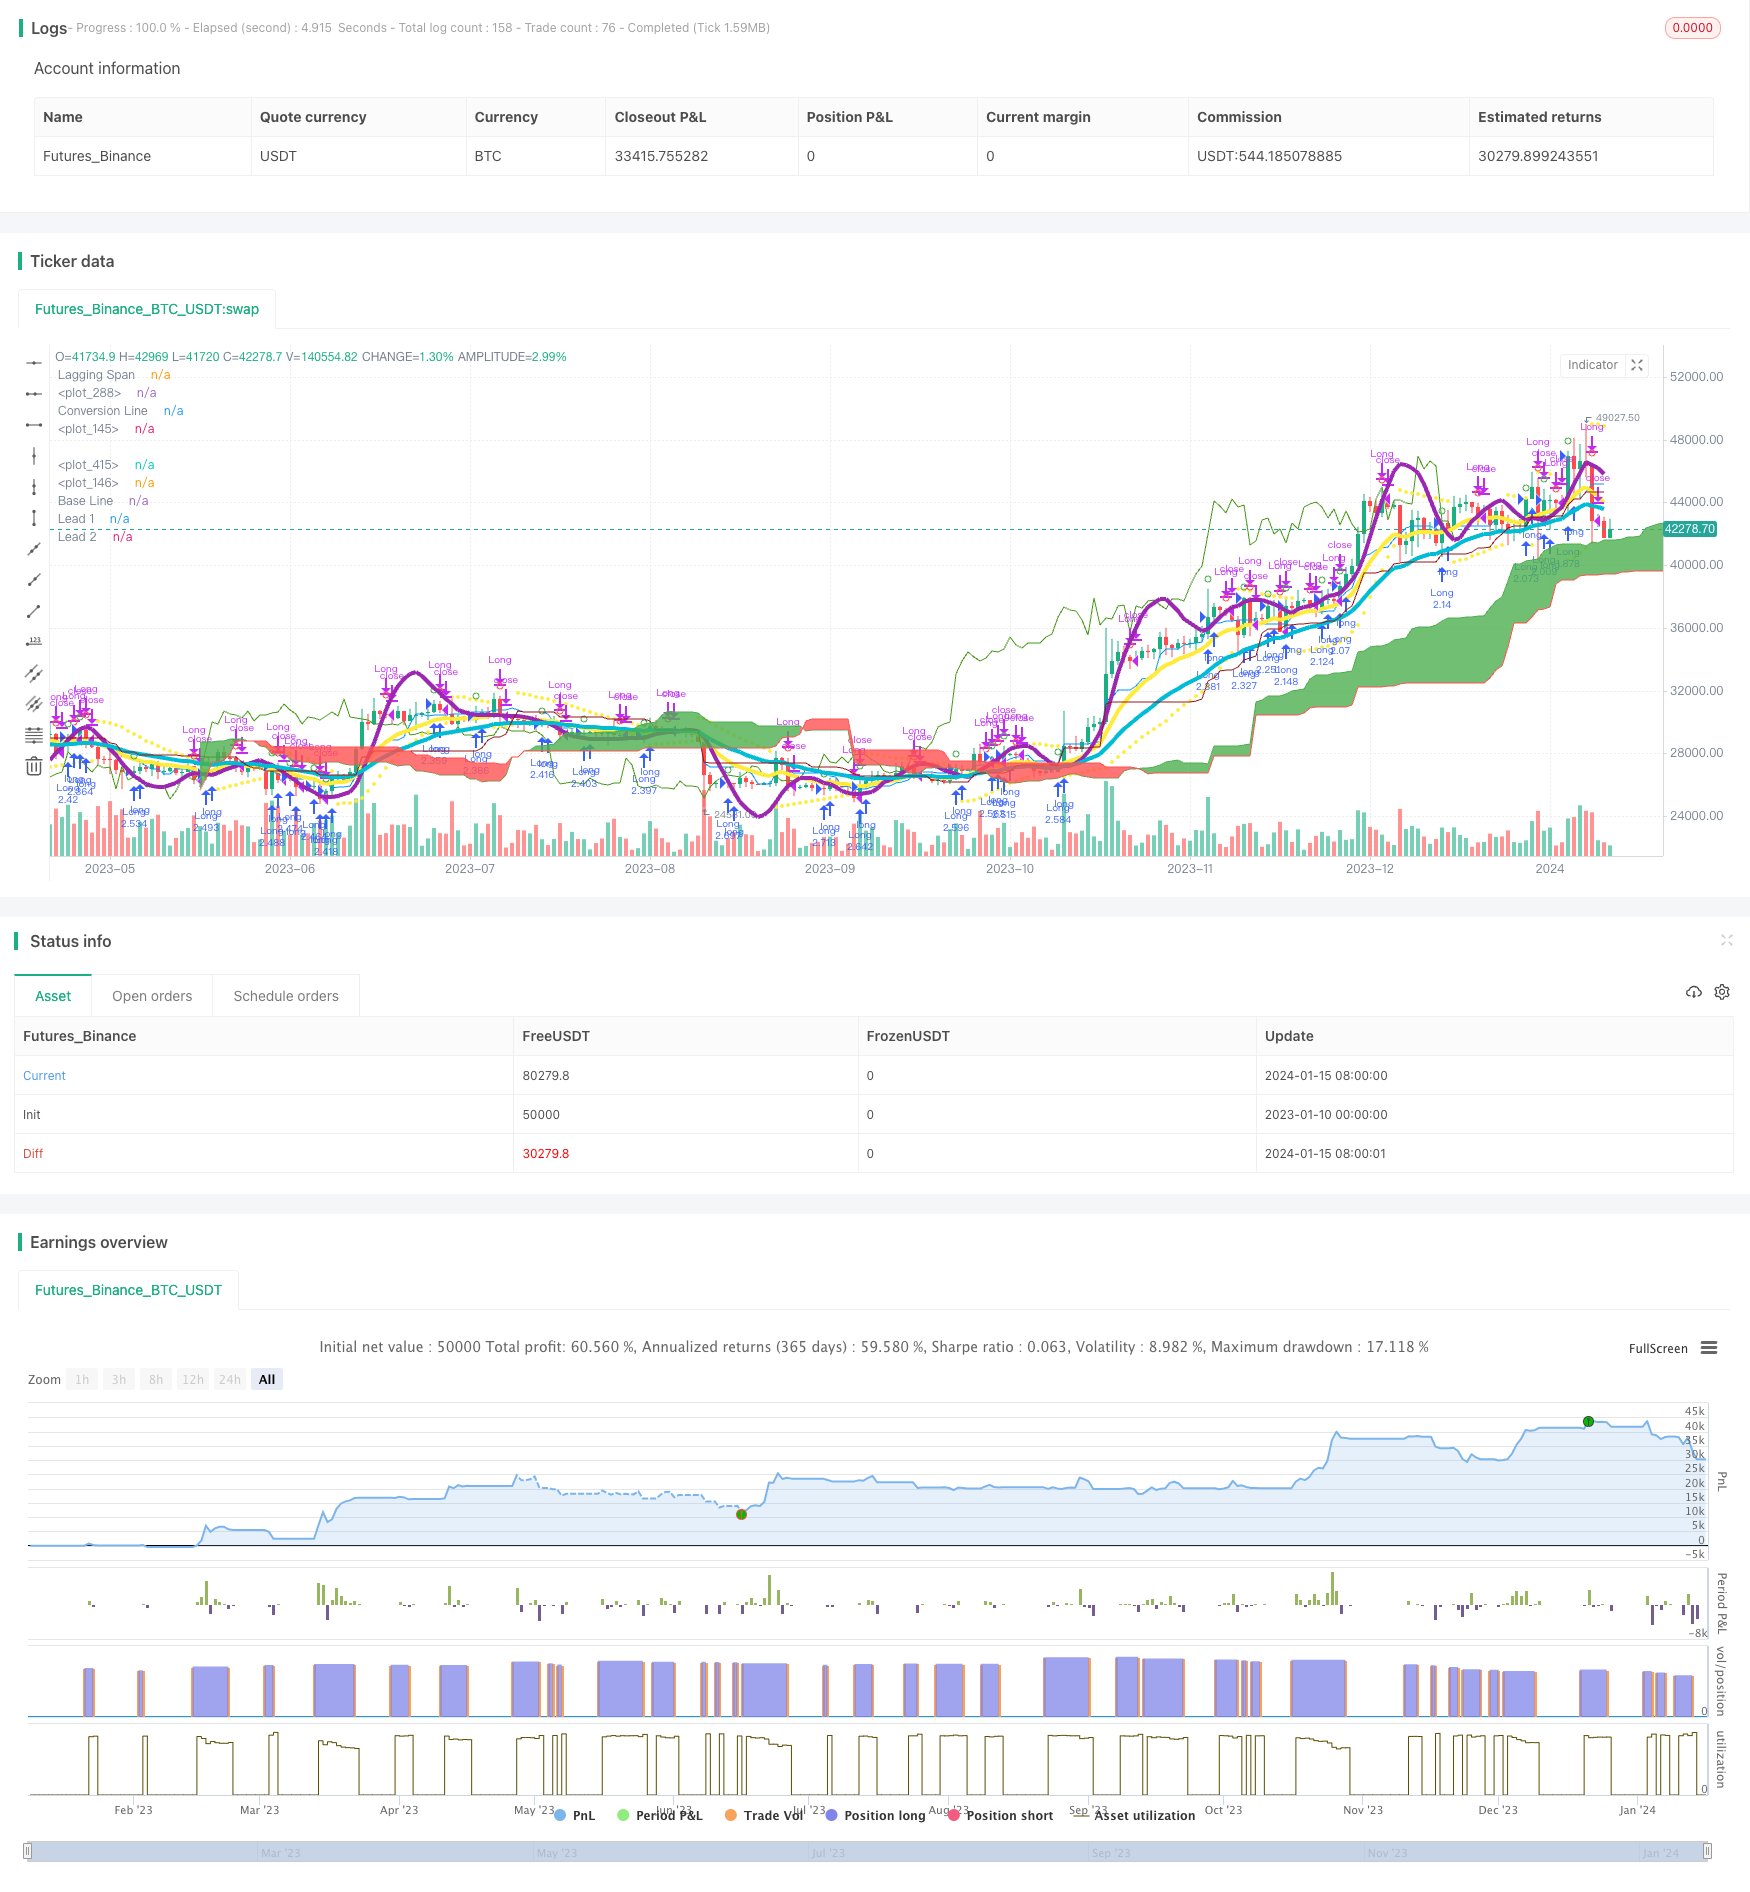
Chiến lược này đã phát triển một chiến lược giao dịch định lượng ổn định và đáng tin cậy hơn bằng cách kết hợp sử dụng chỉ số trung bình di chuyển ba lần và chỉ số MACD. Chiến lược này được thiết kế để nắm bắt các xu hướng có thể xuất hiện trong tương lai, đặc biệt phù hợp với các vị trí trung bình và dài.
Nguyên tắc chiến lược
Chiến lược này chủ yếu dựa trên việc sử dụng kết hợp của trung bình di chuyển ba lần và MACD.
Đầu tiên, chiến lược sử dụng ba trung bình di chuyển có chiều dài 3, 7 và 2. Ba trung bình di chuyển này xây dựng một hệ thống trung bình di chuyển nhanh và chậm để xác định hướng xu hướng trong tương lai. Khi đi qua trung bình di chuyển dài hơn trên trung bình di chuyển ngắn hơn, hãy làm nhiều tín hiệu; khi đi qua trung bình di chuyển dài hơn dưới trung bình di chuyển ngắn hơn, hãy làm tín hiệu trống.
Thứ hai, chiến lược này cũng sử dụng các chỉ số MACD với các tham số 3 và 7.
Bằng cách kết hợp sử dụng các chỉ số kép, bạn có thể tránh được nhiều tín hiệu sai do chỉ số đơn, do đó tăng sự ổn định của chiến lược.
Lợi thế chiến lược
- Sử dụng bộ lọc kép để cải thiện chất lượng tín hiệu
- Các tham số được tối ưu hóa sau nhiều lần thử nghiệm, ổn định và đáng tin cậy
- Sử dụng hệ thống trung bình di chuyển ba lần, có thể lọc hiệu quả tiếng ồn thị trường và đánh giá xu hướng trong tương lai
- Các tham số chỉ số MACD được thiết lập nhanh hơn, có thể nhanh chóng nắm bắt cơ hội ngắn hạn
Rủi ro chiến lược
- Có một số rủi ro rút lui và mất mát liên tục
- Chiến lược này có nhiều giao dịch sai khi thị trường không có xu hướng rõ ràng
- Chỉ số MACD dễ tạo ra tín hiệu sai và cần được sử dụng với chỉ số đường trung bình
Giải pháp:
- Sử dụng chiến lược dừng lỗ thích hợp để kiểm soát rút tối đa
- Giảm tần suất giao dịch khi Market State không có xu hướng rõ ràng
- Tối ưu hóa các tham số MACD và sử dụng với các chỉ số khác
Hướng tối ưu hóa chiến lược
- Kiểm tra và tối ưu hóa các tham số của moving average và MACD để tìm ra sự kết hợp tốt nhất
- Thêm các chỉ số phụ trợ như KDJ, VRSI để tránh tín hiệu sai
- Tham gia mô hình học máy để đánh giá tình trạng thị trường, thực hiện điều chỉnh động
- Thiết lập điểm dừng tối ưu kết hợp với chiến lược dừng lỗ
Tóm tắt
Chiến lược này thực hiện việc nắm bắt xu hướng ổn định thông qua sự kết hợp của đường trung bình di chuyển và MACD. Ưu điểm của chiến lược là sử dụng các chỉ số kết hợp, có thể giảm hiệu quả tín hiệu sai, do đó có hiệu quả chiến lược tốt hơn. Tiếp theo, tiếp tục hoàn thiện chiến lược bằng các phương tiện tối ưu hóa tham số, giới thiệu chiến lược dừng lỗ và điều chỉnh động, làm cho nó trở thành một công cụ hiệu quả để tìm cơ hội đường dài trung bình.
/*backtest
start: 2023-01-10 00:00:00
end: 2024-01-16 00:00:00
period: 1d
basePeriod: 1h
exchanges: [{"eid":"Futures_Binance","currency":"BTC_USDT"}]
*/

//@version=3
strategy("Matt's MACD Algo v1", shorttitle="Matt's MACD Algo v1", overlay=true, pyramiding = 0, default_qty_type = strategy.percent_of_equity, default_qty_value = 100, initial_capital=7000, calc_on_order_fills = true, commission_type=strategy.commission.percent, commission_value=0, currency = currency.USD)
//study("MFI Fresh", shorttitle="MFI Fresh", overlay=true)

//Risk Management Settings
//trategy.risk.max_drawdown(20, strategy.percent_of_equity)
//strategy.risk.max_intraday_loss(10, strategy.percent_of_equity)
//strategy.risk.max_cons_loss_days(3)

/////////////////
ts = input(title="Trailing Stop in cents", defval=50)/100

//Time Inputs
FromMonth = input(defval = 6, title = "From Month", minval = 1)
FromDay   = input(defval = 1, title = "From Day", minval = 1)
FromYear  = input(defval = 2017, title = "From Year", minval = 1)
ToMonth   = input(defval = 1, title = "To Month", minval = 1)
ToDay     = input(defval = 1, title = "To Day", minval = 1)
ToYear    = input(defval = 9999, title = "To Year", minval = 1)

//Time Variable
testPeriod() =>
    (time > timestamp(FromYear, FromMonth, FromDay, 09, 30)) and (time < timestamp(ToYear, ToMonth, ToDay, 09, 29))

//MA On and MA Colors On? Inputs
switch1=input(false, title="Enable Bar Color?")
switch2=input(true, title="Enable Moving Averages?")
switch3=input(false, title="Enable Background Color?")
switch4=input(false, title="Enable Bolinger Bands?")
switch5=input(false, title="Enable Keltner Channel?")

////////////////////////////////Williams %R
R_length = input(14, minval=1)
R_overBought = input(title="%R Overbought", defval=80)
R_overSold = input(title="%R Oversold", defval=20)
R_upper = highest(R_length)
R_lower = lowest(R_length)
R_out = 100 * (close - R_upper) / (R_upper - R_lower)

WilliamsR_longEntry = crossover(R_out, R_overSold)
WilliamsR_shortEntry = crossunder(R_out, R_overBought)

//plot(R_out)
//R_band1 = hline(R_overSold)
//R_band0 = hline(R_overBought)
//fill(R_band1, R_band0)

////////////////////////////////RSI Variables
rsi_source = close
RSI_Length = input(title="RSI Length", defval=3)
RSI_overBought = input(title="RSI Overbought", defval=80)
RSI_overSold = input(title="RSI Oversold", defval=20)

up = rma(max(change(rsi_source), 0), RSI_Length)
down = rma(-min(change(rsi_source), 0), RSI_Length)
rsi = down == 0 ? 100 : up == 0 ? 0 : 100 - (100 / (1 + up / down))

RSI_longEntry = rsi > 50
//crossover(rsi, RSI_overSold)
RSI_shortEntry = rsi < 50
//crossunder(rsi, RSI_overBought)

//plot(rsi, color=purple)
//band1 = hline(RSI_overBought)
//band0 = hline(RSI_overSold)
//fill(band1, band0, color=purple, transp=90)


//////////////////////Commodity Channel Index
cci_length = input(20, minval=1)
cci_src = input(close, title="Source")
cci_ma = sma(cci_src, cci_length)
cci = (cci_src - cci_ma) / (0.015 * dev(cci_src, cci_length))


cci_longEntry = crossover(cci, -100)
cci_shortEntry = crossunder(cci, 100)

//plot(cci, color=olive)
//cci_band1 = hline(100, color=gray, linestyle=dashed)
//cci_band0 = hline(-100, color=gray, linestyle=dashed)
//fill(cci_band1, cci_band0, color=olive)


//MFI Inputs
MFI_length = input(title="MFI Length", defval=3)
MFI_overBought = input(title="MFI Overbought", defval=80)
MFI_overSold = input(title="MFI Oversold", defval=20)

//MFI Variables
rawMoneyFlow = hlc3 * volume
positiveMoneyFlow = 0.0
positiveMoneyFlow := hlc3 > hlc3[1] ? positiveMoneyFlow + rawMoneyFlow : positiveMoneyFlow
negativeMoneyFlow = 0.0
negativeMoneyFlow :=  hlc3 < hlc3[1] ? negativeMoneyFlow + rawMoneyFlow : negativeMoneyFlow
moneyFlowRatio = sma(positiveMoneyFlow, MFI_length) / sma(negativeMoneyFlow, MFI_length)
moneyFlowIndex = 100 - 100 / (1 + moneyFlowRatio)

MFI_longEntry = (crossover(moneyFlowIndex, MFI_overSold))
MFI_shortEntry = (crossunder(moneyFlowIndex, MFI_overBought))


///// MFI Plot for STUDY
//plot(moneyFlowIndex, color=#459915)
//MFI_OB=hline(MFI_overBought, title="Overbought", color=#c0c0c0)
//MFI_OS=hline(MFI_overSold, title="Oversold", color=#c0c0c0)
//fill(MFI_overBought, MFI_overSold, color=#9915ff, transp=90)


////VERY SLOW SMA
veryslowLength=input(50,minval=1, title="Very slow SMA")
veryslowSMA = sma(close, veryslowLength)


//MACD Inputs
source = input(close, title="MACD source")
fastLength = input(title="MACD Fast Length", defval=12)
fastLength2 = input(title="MACD Fast Length #2", defval=3)
slowLength = input(title="MACD Slow Length", defval=26)
slowLength2 = input(title="MACD Slow Length #2", defval=7)
MACD_fastsignalSmoothing = input(title="Signal Smoothing", defval=7)
MACD_slowsignalSmoothing = input(title="Signal Smoothing", defval=12)
MACD_fastsignalSmoothing2 = input(title="Signal Smoothing #2", defval=5)
MACD_slowsignalSmoothing2 = input(title="Signal Smoothing #2", defval=9)
MACD_percentthreshold = input(title="MACD % Threshold", defval=-0.0030, step=0.0001)

//MACD variables
fastEMA = ema(source, fastLength)
fastEMA2 = ema(source, fastLength2)
slowEMA = ema(source, slowLength)
slowEMA2 = ema(source, slowLength2)
MACD_Line = fastEMA - slowEMA
MACD_Line2 = fastEMA2 - slowEMA2
MACD_fastsignalLine = ema(MACD_Line, MACD_fastsignalSmoothing)
MACD_slowsignalLine = ema(MACD_Line, MACD_slowsignalSmoothing)
MACD_fastsignalLine2 = ema(MACD_Line2, MACD_fastsignalSmoothing2)
MACD_slowsignalLine2 = ema(MACD_Line2, MACD_slowsignalSmoothing2)
fasthist = MACD_Line - MACD_slowsignalLine
MACD_Histogram2 = MACD_Line2 - MACD_fastsignalLine2
minimum = close * MACD_percentthreshold
SMA = sma(MACD_Line, 10)

// MACD and veryslowSMA Plot for STRATEGY
Fast=plot(switch2?fastEMA:na,color=yellow, linewidth=4)
Slow=plot(switch2?slowEMA:na,color=aqua, linewidth=4)
//VerySlow=plot(switch2?veryslowSMA:na,color=purple,linewidth=4)
//fill(Fast,VerySlow,color=gray)

/////// MACD Plots for STUDY
//plot(fasthist, color=fasthist>0 and fasthist[0]>fasthist[1]?#00ff00:fasthist<=0 and fasthist[0]<fasthist[1]?#f72e2e:fasthist>0 and fasthist[0]<fasthist[1]?#008000:fasthist<0 and fasthist[0]>fasthist[1]?#7f0000:white, style=histogram)
//plot(slowhist, color=slowhist>0 and slowhist[0]>slowhist[1]?#00ff00:slowhist<=0 and slowhist[0]<slowhist[1]?#f72e2e:slowhist>0 and slowhist[0]<slowhist[1]?#008000:slowhist<0 and slowhist[0]>slowhist[1]?#7f0000:white, style=histogram)
//plot(MACD_Line, color=yellow, title="MACD Line")
//plot(MACD_fastsignalSmoothing, color=green, title="Fast Signal Line")
//plot(MACD_slowsignalSmoothing, color=red, title="Slow Signal Line")
//plot(MACD_Line2, color=aqua, title="MACD Line 2")
//plot(MACD_fastsignalSmoothing2, color=orange, title="Fast Signal Line 2")
//plot(MACD_slowsignalSmoothing2, color=white, title="Slow Signal Line 2")
//plot(minimum, color=white, title="% Threshold")
//plot(fasthist, color=fasthist>0 and fasthist[0]>fasthist[1]?#00ff00:fasthist<=0 and fasthist[0]<fasthist[1]?#f72e2e:fasthist>0 and fasthist[0]<fasthist[1]?#008000:fasthist<0 and fasthist[0]>fasthist[1]?#7f0000:white, style=histogram)
//plot(MACD_Histogram2, color=MACD_Histogram2>0?blue:MACD_Histogram2<0?orange:white, style=histogram)
//plot(SMA, color=white, title="SMA")

//MACD Entry Conditions
MACD_longEntry2 = (crossover(MACD_Histogram2, 0))
MACD_shortEntry2 = (crossunder(MACD_Histogram2, 0))
MACD_longEntry = (crossover(fasthist, 0))
MACD_shortEntry = (crossunder(fasthist, 0))


// Colors
//MAtrendcolor = change(veryslowSMA) > 0 ? green : red
//trendcolor = fastEMA > slowEMA and change(veryslowSMA) > 0 and close > slowEMA ? green : fastEMA < slowEMA and change(veryslowSMA) < 0 and close < slowEMA ? red : yellow
//bartrendcolor = close > fastEMA and close > slowEMA and close > veryslowSMA and change(slowEMA) > 0 ? green : close < fastEMA and close < slowEMA and close < veryslowSMA and change(slowEMA) < 0 ? red : yellow
//backgroundcolor = slowEMA > veryslowSMA and MACD_longEntry and MACD_Line > 0 and fastEMA > slowEMA and close[slowLength] > veryslowSMA ? green : slowEMA < veryslowSMA and MACD_shortEntry and MACD_Line < 0 and fastEMA < slowEMA and close[slowLength] < veryslowSMA ? red : na
//barcolor(switch1?bartrendcolor:na)

// Conditional Bar Colors
//backgroundcolor = (MACD_longEntry ? green : MACD_shortEntry ? red : na)
//bgcolor(switch3?backgroundcolor:na,transp=80)


////BOLLINGER BAND Conditions
bb_source = close
bb_length = input(20, minval=1)
bb_mult = input(1.86, minval=0.001, maxval=50)

bb_basis = ema(bb_source, bb_length)
bb_dev = bb_mult * stdev(bb_source, bb_length)

bb_upper = bb_basis + bb_dev
bb_lower = bb_basis - bb_dev

bb_longEntry = crossover(bb_source, bb_lower)
bb_shortEntry = crossunder(bb_source, bb_upper)

plot(switch4?bb_basis:na, color=red, linewidth=4)
p1=plot(switch4?bb_upper:na)
p2=plot(switch4?bb_lower:na)
fill(p1,p2, color=aqua, transp=95)

////KELTNER CHANNEL Inputs/Variables/Plots
KC_useTrueRange = input(true)
KC_length = input(20, minval=1)
KC_mult = input(3.0)
KC_source = input(close, title="Source")

KC_ma = ema(KC_source, KC_length)
KC_range = KC_useTrueRange ? tr : high - low
KC_rangema = ema(KC_range, KC_length)
KC_upper = KC_ma + KC_rangema * KC_mult
KC_lower = KC_ma - KC_rangema * KC_mult

KC_longEntry = crossover(KC_source, KC_lower)
KC_shortEntry = crossunder(KC_source, KC_upper)

plot(switch5?KC_ma:na, color=red, title="Basis")
KC_u = plot(switch5?KC_upper:na, color=red, title="Upper")
KC_l = plot(switch5?KC_lower:na, color=red, title="Lower")
fill(KC_u, KC_l, color=red)

///////////////////ADX
//len = input(title="ADX Length", type=integer, defval=14)
//th = input(title="ADX threshold", type=integer, defval=20)

//TrueRange = max(max(high-low, abs(high-nz(close[1]))), abs(low-nz(close[1])))
//DirectionalMovementPlus = high-nz(high[1]) > nz(low[1])-low ? max(high-nz(high[1]), 0): 0
//DirectionalMovementMinus = nz(low[1])-low > high-nz(high[1]) ? max(nz(low[1])-low, 0): 0


//SmoothedTrueRange = nz(SmoothedTrueRange[1]) - (nz(SmoothedTrueRange[1])/len) + TrueRange
//SmoothedDirectionalMovementPlus = nz(SmoothedDirectionalMovementPlus[1]) - (nz(SmoothedDirectionalMovementPlus[1])/len) + DirectionalMovementPlus
//SmoothedDirectionalMovementMinus = nz(SmoothedDirectionalMovementMinus[1]) - (nz(SmoothedDirectionalMovementMinus[1])/len) + DirectionalMovementMinus

//DIPlus = sma(SmoothedDirectionalMovementPlus / SmoothedTrueRange * 100, len)
//DIMinus = sma(SmoothedDirectionalMovementMinus / SmoothedTrueRange * 100, len)
//DX = abs(DIPlus-DIMinus) / (DIPlus+DIMinus)*100
//ADX = sma(DX, len)


///
//ADX_longEntry = crossover(DIPlus, DIMinus) //or (DIPlus > DIMinus and DIPlus > th and ADX > th)
//ADX_shortEntry = crossover(DIMinus, DIPlus) //or (DIMinus > DIPlus and DIMinus > th and ADX > th)


//DI_long = if DIPlus > DIMinus and ADX > 20 and DIPlus > 20


//plot(DIPlus, color=green, title="DI+")
//plot(DIMinus, color=red, title="DI-")
//plot(ADX, color=black, title="ADX")
//hline(th, color=black, linestyle=dashed)


//////////////////////////////////Playing with RES


r1 = input("5", "Resolution")
r2 = input("15", "Resolution")
r3 = input("30", "Resolution")
r4 = input("60", "Resolution")

o1 = request.security(heikinashi(syminfo.tickerid), r1, MACD_Line[1])
c1 = request.security(heikinashi(syminfo.tickerid), r1, MACD_slowsignalLine[1])
o2 = request.security(heikinashi(syminfo.tickerid), r2, MACD_Line[1])
c2 = request.security(heikinashi(syminfo.tickerid), r2, MACD_slowsignalLine[1])
o3 = request.security(heikinashi(syminfo.tickerid), r3, MACD_Line[1])
c3 = request.security(heikinashi(syminfo.tickerid), r3, MACD_slowsignalLine[1])
o4 = request.security(heikinashi(syminfo.tickerid), r4, MACD_Line[1])
c4 = request.security(heikinashi(syminfo.tickerid), r4, MACD_slowsignalLine[1])

res_long = (o4 > c4 and o3 > c3 and o2 > c2 and o1 > c1)
res_short = (o4 < c4 and o3 < c3 and o2 < c2 and o1 < c1)

///////////////////// Parabolic SAR (stop and reverse)
start = input(0.02)
increment = input(0.02)
maximum = input(0.2)

psar = sar(start, increment, maximum)
plot(psar, style=circles, color=yellow)

psar_longEntry = close > psar
psar_longExit = crossunder(close, psar)
psar_shortEntry = close < psar//crossunder(close, psar)
psar_shortExit = crossover(close, psar)

mix = (moneyFlowIndex + rsi)/2
RSI_MFI = ema(mix, input(3))
//color = RSI_MFI > 80 ? red :RSI_MFI < 20  ? green : silver
vrsi = RSI_MFI

rsiBuySell = vrsi[1] < 95 and crossover(vrsi, 95) or vrsi[1] < 90 and crossover(vrsi, 90) or vrsi[1] < 85 and crossover(vrsi, 85) or vrsi[1] < 80 and crossover(vrsi, 80)  or vrsi[1] < 75 and crossover(vrsi, 75) or vrsi[1] < 70 and  crossover(vrsi, 70)  or vrsi[1] < 65 and crossover(vrsi, 65) or vrsi[1] < 60 and  crossover(vrsi, 60)  or vrsi[1] < 55 and crossover(vrsi, 55) or vrsi[1] < 50 and crossover(vrsi, 50) or vrsi[1] < 45 and crossover(vrsi, 45) or vrsi[1] < 40 and  crossover(vrsi, 40) or vrsi[1] < 35 and crossover(vrsi, 35) or vrsi[1] < 30 and crossover(vrsi, 30) or vrsi[1] < 25 and crossover(vrsi, 25) or vrsi[1] < 20 and  crossover(vrsi, 20) or vrsi[1] < 15 and crossover(vrsi, 15) or  vrsi[1] < 10 and crossover(vrsi, 10) or  vrsi[1] < 5 and crossover(vrsi, 5)  ? 1 :  vrsi[1] > 95 and  crossunder(vrsi, 95) or vrsi[1] > 90 and  crossunder(vrsi, 90) or  vrsi[1] > 85 and  crossunder(vrsi, 85) or vrsi[1] > 80 and crossunder(vrsi, 80) or  vrsi[1] > 75 and  crossunder(vrsi, 75) or vrsi[1] > 70 and  crossunder(vrsi, 70) or  vrsi[1] > 65 and  crossunder(vrsi, 65) or vrsi[1] > 60 and crossunder(vrsi, 60) or  vrsi[1] > 55 and  crossunder(vrsi, 55) or vrsi[1] > 50 and crossunder(vrsi, 50) or  vrsi[1] > 45 and  crossunder(vrsi, 45) or vrsi[1] > 40 and crossunder(vrsi, 40) or  vrsi[1] > 35 and  crossunder(vrsi, 35) or vrsi[1] > 30 and crossunder(vrsi, 30) or  vrsi[1] > 25 and  crossunder(vrsi, 25) or vrsi[1] > 20 and  crossunder(vrsi, 20) or vrsi[1] > 15 and crossunder(vrsi, 15) or vrsi[1] > 10 and crossunder(vrsi, 10) or  vrsi[1] > 5 and  crossunder(vrsi, 5) ?-1:na

//////////////////////////////////Entry Conditions
//
MA1 = ema(hlc3, input(3))
MA2 = wma(MA1, input(7))
MA3 = ema(MA2, input(2))
MA4 = wma(MA3, input(1))

buy =  close > MA4 or hlc3[1] < MA4 and hlc3 > MA4 and rsiBuySell == 1
sell = close < MA4 or hlc3[1] > MA4 and hlc3 < MA4 and rsiBuySell == -1

p=14

CO=close-open
HL=high-low

value1 = (CO + 2*CO[1] + 2*CO[2] + CO[3])/6
value2 = (HL + 2*HL[1] + 2*HL[2] + HL[3])/6

num=sum(value1,p)
denom=sum(value2,p)

RVI=denom!=0?num/denom:0

RVIsig=(RVI+ 2*RVI[1] + 2*RVI[2] + RVI[3])/6

//plot(RVI,color=white,style=line,linewidth=1)
//plot(RVIsig,color=orange,style=line,linewidth=1)

Tenkan_periods = input(9, minval=1, title="Conversion Line Periods"),
Kijun_periods = input(26, minval=1, title="Base Line Periods")
Senkou_Span_B_Length = input(50, minval=1, title="Lagging Span 2 Periods"),
Chikou_Span_Length = input(25, minval=1, title="Displacement")

donchian(len) => avg(lowest(len), highest(len))

Tenkan_sen = donchian(Tenkan_periods)
Kijun_sen = donchian(Kijun_periods)
Senkou_Span_A = avg(Tenkan_sen, Kijun_sen)
Senkou_Span_B = donchian(Senkou_Span_B_Length)

plot(Tenkan_sen, color=#0496ff, title="Conversion Line")
plot(Kijun_sen, color=#991515, title="Base Line")
plot(close, offset = -Chikou_Span_Length, color=#459915, title="Lagging Span")

p3 = plot(Senkou_Span_A, offset = Chikou_Span_Length, color=green,
 title="Lead 1")
p4 = plot(Senkou_Span_B, offset = Chikou_Span_Length, color=red,
 title="Lead 2")
fill(p3, p4, color = Senkou_Span_A > Senkou_Span_B ? green : red, transp=50)

Ichimoku_longEntry = Senkou_Span_B < Senkou_Span_A
Ichimoku_shortEntry = Senkou_Span_A < Senkou_Span_B

len9 = input(9, minval=1, title="Length")
srce = input(hlc3, title="Source")
ema9 = ema(srce, len9)
sma50 = sma(ema9, 80)
sma30 = vwma(sma50, 26)
ema930 = ema(sma30, 9)
//plot(ema930, color=blue, title="MA", linewidth=5, transp=0)

SMA100 = sma(input(ohlc4), input(10))
Lookback = SMA100[input(7)]
sma300 = SMA100 + (SMA100 - Lookback)


//if Ichimoku_longEntry
longEntry = (MACD_longEntry2) //or Stoch_longEntry// or buy //or cci_longEntry  or bb_longEntry or psar_shortExit //or  //// // KC_longEntry// or WilliamsR_longEntry//  // // or RSI_longEntry// // or  or MFI_longEntry// or crossover(close,psar) //(o4 < c4 and o3 < c3 and o2 < c2 and o1 < c1)

//if Ichimoku_shortEntry
shortEntry = (MACD_shortEntry2) //or Stoch_shortEntry// or sell//or cci_shortEntry or bb_shortEntry or psar_longExit//   // //or KC_shortEntry// or WilliamsR_shortEntry//  //or cci_shortEntry //  // or  or MFI_shortEntry// or crossunder(close,psar)// (o4 < c4 and o3 < c3 and o2 < c2 and o1 < c1)


//longExit = shortEntry or psar_longExit // if not (ADX > th and )
//shortExit = longEntry or psar_shortExit // if not (ADX > th and )

////psar for trailing stops or some other measure? we must have a good trailing stop.

///////////////////////////////Strategy Execution

if testPeriod()
    strategy.entry("Long", strategy.long, when=longEntry)
    strategy.close("Long", when=shortEntry)

//if testPeriod()
//    strategy.entry("Long", strategy.long, when=longEntry)
//    strategy.exit("Exit Long", "Long", when=shortEntry)
//else
//    strategy.cancel("Long")
//if testPeriod()
//    strategy.entry("Short", strategy.short, when=shortEntry)
//    strategy.exit("Exit Short", "Short", when=longEntry)
//else
//    strategy.cancel("Long")

//Other Plots and Alerts
plotshape(MACD_longEntry2,  title= "3,7 Long Open", color=green, style=shape.circle)
plotshape(MACD_shortEntry2,  title= "3,7 Short Open", color=red, style=shape.circle)
//plotshape(Stoch_longEntry,  title= "Stoch Long Open", color=aqua, style=shape.circle)
//plotshape(Stoch_shortEntry,  title= "Stoch Short Open", color=orange, style=shape.circle)
//plotshape(buy,  title= "RES Long Open", color=green, location=location.belowbar, style=shape.circle)
///plotshape(sell,  title= "RES Short Open", color=red, location=location.belowbar, style=shape.circle)
//plotshape(MACD_longEntry, title= "12,26 Long Open", color=green, style=shape.arrowup, size=size.normal, location=location.belowbar)
//plotshape(MACD_shortEntry, title= "12,26 Short Open", color=red, style=shape.arrowdown, size=size.normal, location=location.abovebar)
//plotshape(MACD_longEntry, title= "12,26 Long Open", color=green, style=shape.diamond, size=size.tiny, location=location.belowbar)
//plotshape(MACD_shortEntry, title= "12,26 Short Open", color=red, style=shape.diamond, size=size.tiny, location=location.abovebar)

//plotchar(longCondition, location=bottom char="L", color=green)
//plotchar(shortCondition, char="S", color=red)
//alertcondition(longCondition, title="MFI+MACD Long", message="(MFI crossOver 30) or MACD+")
//alertcondition(shortCondition, title="MFI+MACD Short", message="(MFI crossUnder 70) or MACD-")
plot(sma300, color=purple, linewidth=4)