Chiến lược giao dịch hỗn hợp
Tổng quan
Chiến lược giao dịch theo mùa hỗn hợp của S&P 500 là một chiến lược định lượng để giao dịch cổ phiếu sử dụng quy luật theo mùa. Chiến lược này kết hợp các điều kiện chỉ số kỹ thuật và chỉ số dòng tiền với hệ thống mua và nắm giữ tăng cường, cho phép luân chuyển giữa các tháng giao dịch tốt hơn và kém hơn trong năm.
Nguyên tắc chiến lược
Các tín hiệu và quy tắc giao dịch của chiến lược này bao gồm:
- Mỗi năm vào ngày giao dịch đầu tiên của tháng Mười.
- Khi VIX cao hơn 60% hoặc ATR 15 ngày cao hơn 90%, tạm dừng giao dịch theo mùa và chờ đợi thị trường biến động lắng xuống.
- Mỗi năm, vào ngày giao dịch đầu tiên của tháng Tám, cổ phiếu được đóng cửa.
- Một tín hiệu ngang cũng sẽ được phát ra khi VIX vượt quá 120% hoặc chỉ số dòng tiền VFI giảm xuống 20 và đường trung bình 10 ngày giảm xuống.
- Có thể tham gia giao dịch quyền chọn nhị phân
Chiến lược này sử dụng các quy luật của thị trường chứng khoán trong một năm không đồng đều, làm nhiều hơn trong 10-4 tháng tốt nhất về mặt thống kê lịch sử, dừng hoặc tháo lỗ trong 5-9 tháng kém nhất trong lịch sử, để mua bán ngược. Đồng thời, chiến lược đã thêm một số điều kiện chỉ số kỹ thuật, tạm dừng giao dịch khi thị trường biến động mạnh, giúp tránh rủi ro.
Phân tích lợi thế
Chiến lược giao dịch theo mùa hỗn hợp của S&P 500 có những lợi thế sau:
- Sử dụng quy luật mùa trưởng thành và ổn định. Chiến lược này dựa trên thực tế là chỉ số S&P500 có những tháng có hiệu suất khác nhau trong một năm.
- Kết hợp nhiều điều kiện lọc. Các chiến lược đã thêm nhiều điều kiện như VIX, ATR, VFI để lọc hiệu quả tiếng ồn và phát ra tín hiệu giao dịch đáng tin cậy hơn.
- Các quy tắc giao dịch có thể cấu hình. Chiến lược có thể được thêm vào để tăng hoặc giảm, tháng giao dịch cũng có thể được điều chỉnh theo nhu cầu, dễ dàng kiểm tra và tối ưu hóa.
- Các cơ chế tránh rủi ro được xây dựng sẵn, chẳng hạn như phát hiện biến động của VIX và ATR, có thể tránh được tác động của biến động mạnh mẽ của thị trường.
- Chỉ số dòng tiền hỗ trợ phán đoán. VFI có thể phản ánh dòng tiền của người tham gia thị trường, cung cấp cơ sở bổ sung cho các quyết định chiến lược.
Phân tích rủi ro
Một số rủi ro tiềm ẩn có thể xảy ra với chiến lược giao dịch theo mùa hỗn hợp của S&P500:
- Rủi ro của việc luật lịch sử không hiệu quả. Thị trường chứng khoán hoạt động với sự không chắc chắn mạnh mẽ, luật lịch sử không nhất thiết phải luôn luôn hiệu quả.
- Rủi ro của chỉ số kỹ thuật phát ra tín hiệu sai. Các chỉ số như VIX, ATR và VFI cũng có thể bị hiểu sai.
- Các tham số tối ưu hóa có nguy cơ không hoàn hảo. Các tham số chiến lược có thể được thử nghiệm và tối ưu hóa hơn nữa, các tham số hiện có có thể không phải là tối ưu nhất.
- Rủi ro bổ sung của shorting. Các giao dịch shorting có thể mang lại rủi ro mất mát không giới hạn.
Các chiến lược có thể được tăng cường hơn nữa để giải quyết các rủi ro trên bằng cách quản lý rủi ro, kết hợp các chỉ số, điều chỉnh tham số và giới thiệu học máy.
Hướng tối ưu hóa
Chiến lược giao dịch theo mùa hỗn hợp của S&P 500 có thể được tối ưu hóa thêm từ:
- Kiểm tra lịch sử dữ liệu dài hơn. Có thể sử dụng nhiều dữ liệu lịch sử để kiểm tra lại và tối ưu hóa các tham số chiến lược.
- Tăng cơ chế dừng lỗ. Có thể thiết lập dừng động hoặc dừng thời gian, kiểm soát hiệu quả lỗ đơn.
- Tối ưu hóa các tham số chỉ số kỹ thuật. Bạn có thể điều chỉnh các tham số của VIX, ATR và VFI để tìm các tham số kết hợp tối ưu nhất.
- Giới thiệu mô hình học máy. Sử dụng mạng thần kinh hoặc cây quyết định để tự điều chỉnh tham số.
- Gói chiến lược. Có thể thử nghiệm và kết hợp với các chiến lược khác để giảm rủi ro hệ thống thị trường bằng cách sử dụng không liên quan.
Tóm tắt
Chiến lược giao dịch theo mùa hỗn hợp của S&P 500 sử dụng các quy tắc mùa, các điều kiện chỉ số kỹ thuật và các chỉ số dòng tiền. Chiến lược này tránh những tháng thị trường chứng khoán hoạt động kém nhất, được cấu hình trong những tháng giao dịch tốt nhất trong năm, và có một cơ chế lọc biến động thị trường hiệu quả được xây dựng, có thể tạo ra lợi nhuận vượt trội ổn định.
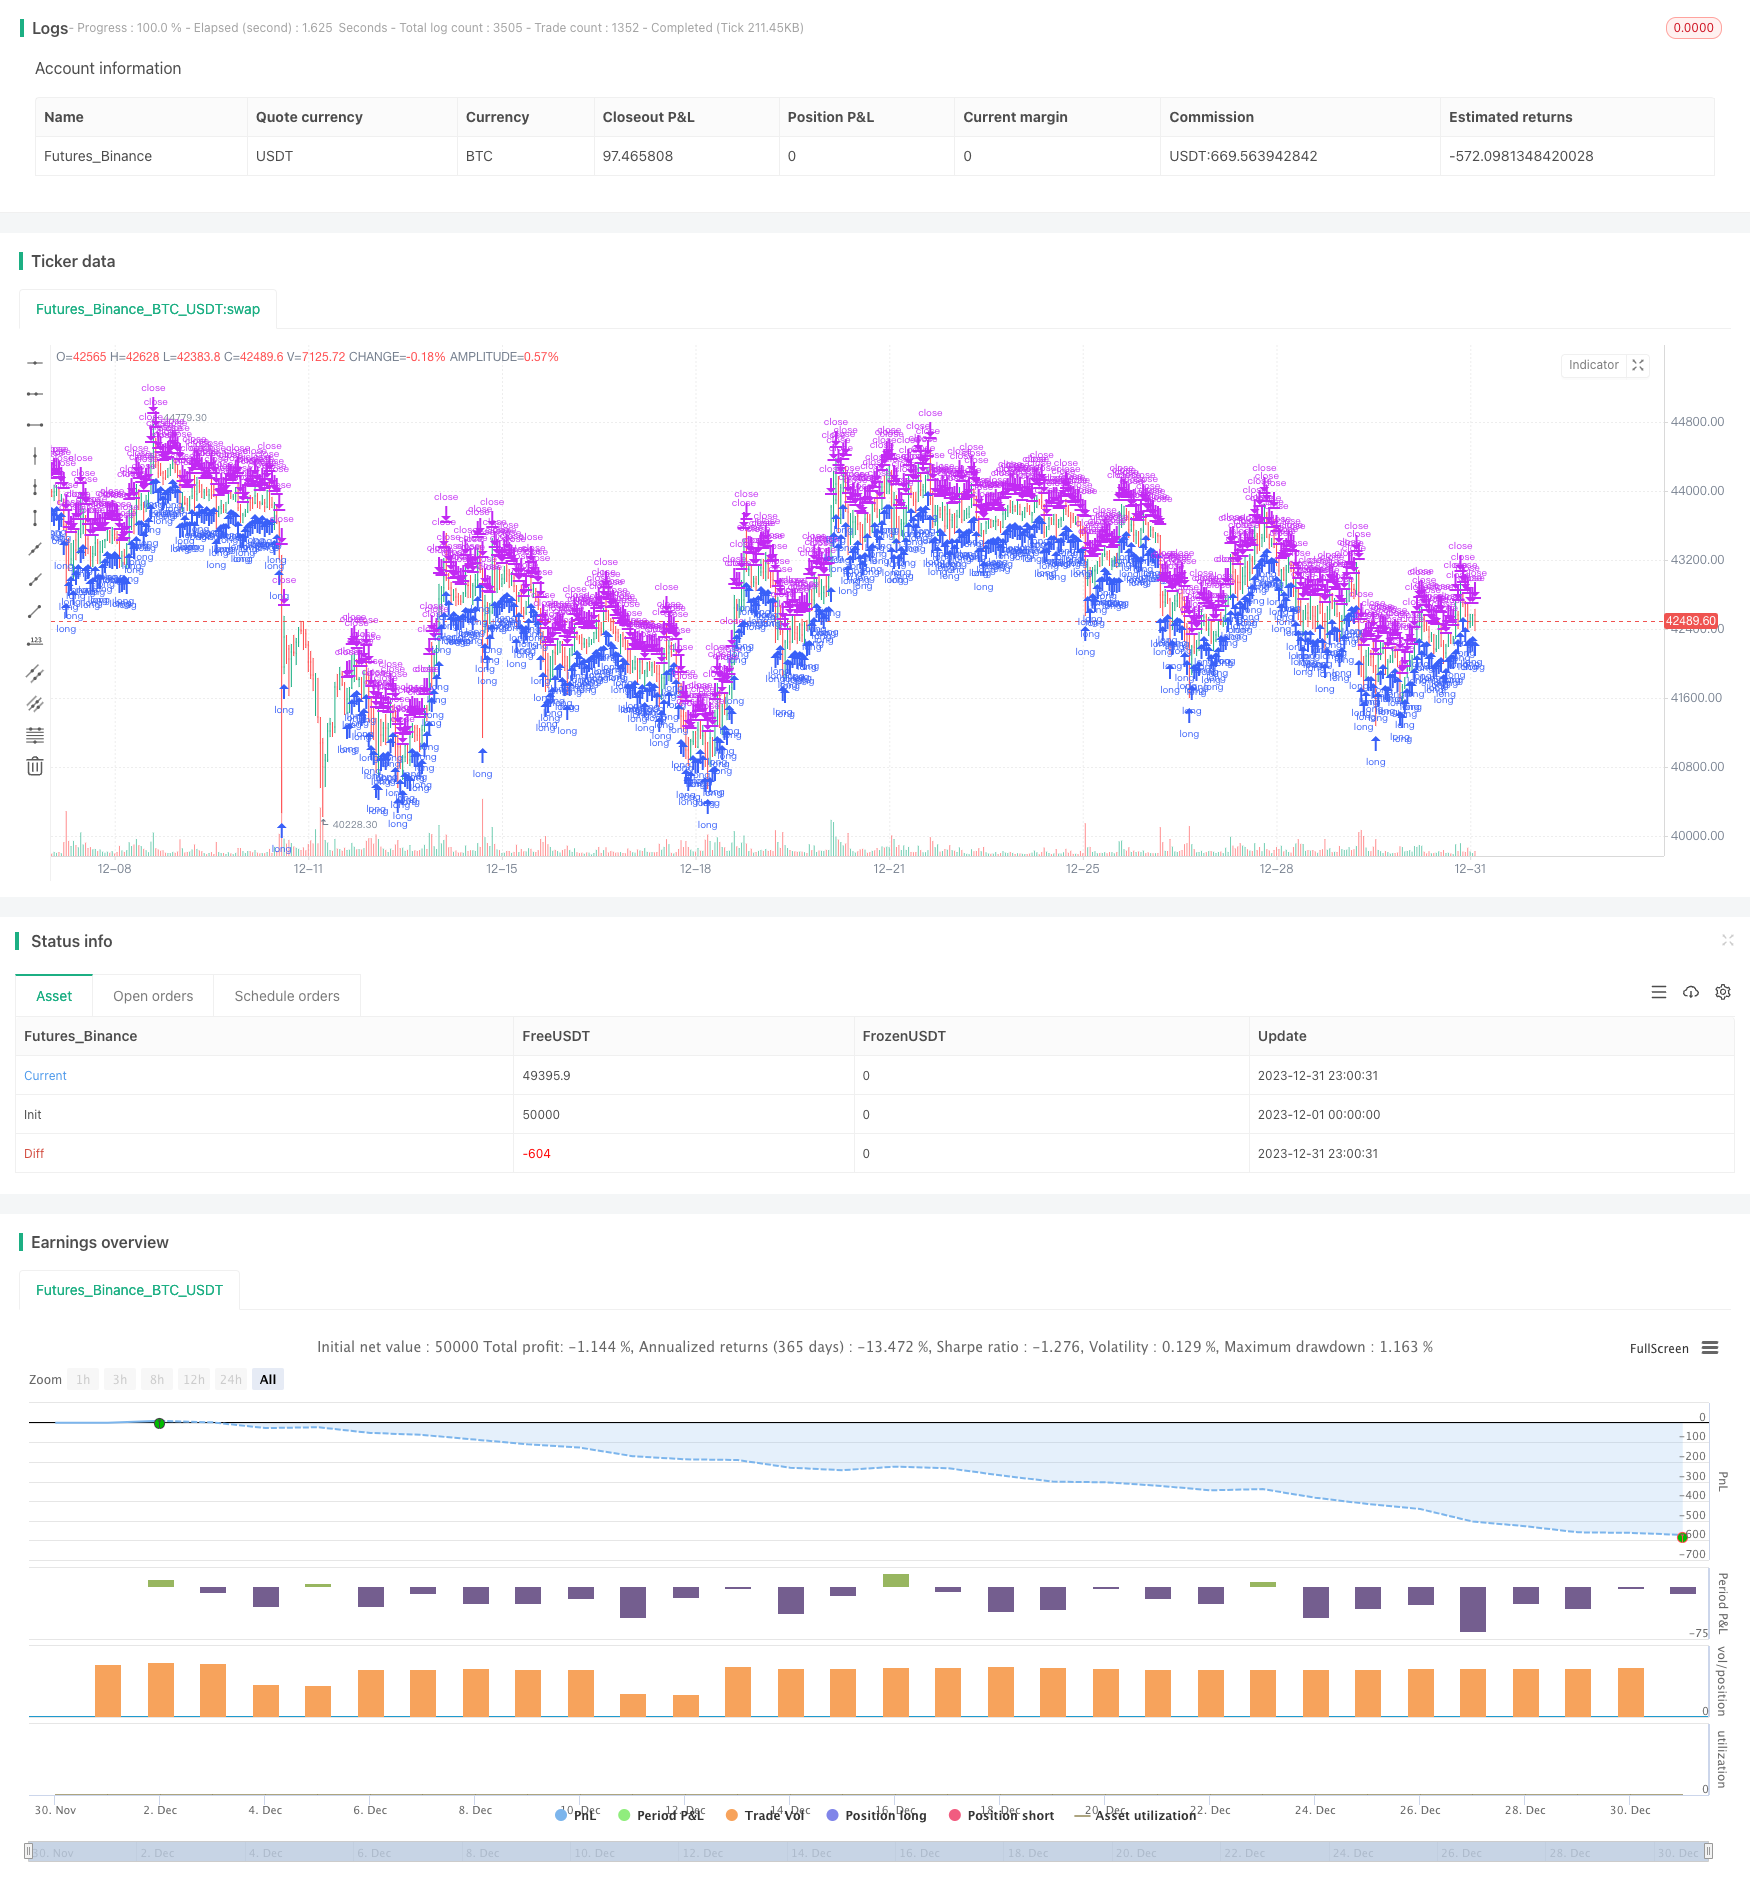
/*backtest
start: 2023-12-01 00:00:00
end: 2023-12-31 23:59:59
period: 1h
basePeriod: 15m
exchanges: [{"eid":"Futures_Binance","currency":"BTC_USDT"}]
*/
// TASC Issue: April 2022 - Vol. 40, Issue 4
// Article: Sell In May? Stock Market Seasonality
// Article By: Markos Katsanos
// Language: TradingView's Pine Script v5
// Provided By: PineCoders, for tradingview.com
//@version=5
strategy(title = "TASC 2022.04 S&P500 Hybrid Seasonal System",
shorttitle = "HSS v2.0",
overlay = true,
default_qty_type = strategy.percent_of_equity,
default_qty_value = 10,
initial_capital = 100000,
currency = currency.USD,
commission_type = strategy.commission.percent,
commission_value = 0.01
)
// Helper Functions:
// @function Returns the ratio to max/min of a sample period
// @param src float, data source.
// @param length int, period of the sample.
// @returns [float, float] tuple.
volatility (float src, int length) =>
[(src / ta.highest(src, length)[1] - 1.0) * 100.0,
(src / ta.lowest (src, length)[1] - 1.0) * 100.0]
// @function Volume Flow Indicator.
// @param Period int, period of the data sample.
// @param VCoef float, Volume Volatility Coefficient.
// @param Coef float, Cutoff Coefficient.
// @returns float.
// ref: https://mkatsanos.com/volume-flow-vfi-indicator/
vfi (int Period = 130, float VCoef = 2.5, float Coef = 0.2) =>
lastHLC3 = nz(hlc3[1], hlc3)
MF = hlc3 - lastHLC3
Vinter = ta.stdev(math.log(hlc3) - math.log(lastHLC3), 30)
Vave = ta.sma(volume, Period)[1]
Cutoff = Coef * close * Vinter
VC = math.min(volume, Vave * VCoef)
VCP = MF > Cutoff ? VC :
MF < -Cutoff ? -VC : 0.0
VFI1 = nz(math.sum(VCP, Period) / Vave)
VFI = ta.ema(VFI1, 3)
// inputs:
// optional strategy obserservation window parameters:
string ig_ow = 'Observation Window:'
bool i_Sdate = input( title = 'Start date:',
defval = timestamp('2021-01-01'),
inline = 'Sdate',
group = ig_ow
) < time //
bool i_useSdate = input.bool( title = '',
defval = false,
group = ig_ow,
inline = 'Sdate',
tooltip = 'Optional start date to clamp strategy observation window.'
) //
bool i_Edate = input( title = 'End date:',
defval = timestamp('2022-01-01'),
inline = 'Edate',
group = ig_ow
) > time //
bool i_useEdate = input.bool( title = '',
defval = false,
group = ig_ow,
inline = 'Edate',
tooltip = 'Optional end date to clamp strategy observation window.'
) //
//
string ig_ro = 'Lookback Options:'
int i_lback = input.int( title = 'Lookback Shift:',
defval = 0, minval = 0,
group = ig_ro,
tooltip = 'Optional, inspect previous signal values.'
) //
//
string ig_so = 'Signal Options:'
bool i_onlyL = input.bool( title = 'Long Only:',
defval = true,
group = ig_so,
tooltip = 'If switched off, short entries are initiated by sell signals.'
) //
int i_sMonth = input.int( title = 'Sell Month:',
defval = 8, minval = 1, maxval = 12, step = 1,
group = ig_so,
tooltip = 'The worst performing month, originally clamped between months 5 and 8.'
) //
int i_maxVI = input.int( title = 'Max VIX up:',
defval = 60, minval = 50, maxval = 60, step = 5,
group = ig_so,
tooltip = 'Volatility maximum threshold.'
) //
int i_critVFI = input.int( title = 'Critical VFI Sell:',
defval = -20, minval = -20, maxval = -15, step = 5,
group = ig_so,
tooltip = 'Critical money float (VFI) threshold for sell signal.'
) //
float i_K = input.float( title = 'ATR/VIX Ratio:',
defval = 1.5, minval = 1.3, maxval = 1.7, step = 0.2,
group = ig_so,
tooltip = 'ATR to VIX ratio for sell signal.'
) //
//
string i_VIticker = input( title = 'Volatility Index:',
defval = 'VIX',
group = ig_so,
tooltip = 'Volatility Index Ticker.'
) //
string i_VItf = input.timeframe( title = '',
defval = 'D',
group = ig_so,
tooltip = 'Volatility Index Timeframe.'
) //
int i_VIiperiod = input.int( title = 'Implied Volatility period:',
defval = 25,
group = ig_so
) //
int i_VIhperiod = input.int( title = 'Historical Volatility period:',
defval = 15,
group = ig_so
) //
//
int i_VFIperiod = input.int( title = 'VFI period:',
defval = 130,
group = ig_so, inline = 'VFI1'
) //
int i_VFIMperiod = input.int( title = 'MA:',
defval = 10,
group = ig_so, inline = 'VFI1',
tooltip = 'VFI and Moving Average sampling period.'
) //
float i_VFIcoef = input.float( title = 'VFI Coef Cuttoff:',
defval = 0.2,
group = ig_so, inline = 'VFI2'
) //
float i_VFIvcoef = input.float( title = 'Volat.:',
defval = 2.5,
group = ig_so, inline = 'VFI2',
tooltip = 'VFI Cutoff and Volatility coefficient.'
) //
int i_ATRperiod = input.int( title = 'ATR length:',
defval = 15,
group = ig_so, inline = 'ATR',
tooltip = 'ATR length.'
) //
//
string ig_to = 'Table Options:'
bool i_showT = input.bool( title = 'Show Table:',
defval = false,
group = ig_to,
tooltip = 'Optional toggle.'
) //
string i_Tpos = input.string(title = 'Position:',
defval = position.middle_right,
options = [ position.top_left, position.top_center, position.top_right,
position.middle_left, position.middle_center, position.middle_right,
position.bottom_left, position.bottom_center, position.bottom_right ],
group = ig_to) //
int i_Ttransp = input.int( title = 'Transparency:',
defval = 0, minval = 1, maxval = 99,
group = ig_to
) //
//
color i_Tcframe = input.color( title = 'Table Colors:',
defval = #000000,
group = ig_to, inline = 'table color'
) //
color i_Tcrowe = input.color( title = '',
defval = #d6dae3,
group = ig_to, inline = 'table color'
) //
color i_Tcrowo = input.color( title = '',
defval = #cccccc,
group = ig_to, inline = 'table color',
tooltip = 'Table background colors, in order: frame, even row, odd row.'
) //
string i_Ttsize = input.string(title = 'Table Text:',
defval = size.small,
options = [size.auto, size.huge, size.large, size.normal, size.small, size.tiny],
group = ig_to, inline = 'table text'
) //
color i_Tcdeft = input.color( title = 'Text Colors:',
defval = #000000,
group = ig_to, inline = 'table text'
) //
color i_Tcsigt = input.color( title = '',
defval = color.red,
group = ig_to, inline = 'table text'
) //
color i_Tctitt = input.color( title = '',
defval = color.navy,
group = ig_to, inline = 'table text',
tooltip = 'Table text size and colors, in order: default, short signal, title.'
) //
// Comparison Index
float VIX = request.security(i_VIticker, i_VItf, close)
[VIdn, VIup] = volatility(VIX, i_VIiperiod) // Implied
[ATRdn, ATRup] = volatility(ta.atr(i_VIhperiod), i_VIiperiod) // Historical
float VFI = vfi(i_VFIperiod, i_VFIvcoef, i_VFIcoef)
float VFI10 = ta.sma(VFI, i_VFIMperiod)
//
bool VFIatCrit = VFI > i_critVFI
bool lowVolat = (VIup < i_maxVI) or (ATRup < (i_K * i_maxVI))
bool VolatC = VFIatCrit ? lowVolat : false
bool Long = ((month >= 10) or (month < i_sMonth)) and VolatC[1]
bool Sseasonal = month == i_sMonth // SEASONAL EXIT/SHORT
bool Svol = VIup > (2.0 * i_maxVI) // VOLATILITY EXIT/SHORT
bool Scrit = ta.cross(i_critVFI, VFI) and (VFI10 < VFI10[1]) // VFI EXIT/SHORT
bool Short = Sseasonal or Svol[1] or Scrit[1]
bool withinObsWindow = true
//
if withinObsWindow and strategy.equity > 0
_L = strategy.long
_S = strategy.short
strategy.entry('L' , direction = _L, when = Long )
if i_onlyL
strategy.close('L', comment = 'EXIT SEASONAL' , when = Sseasonal )
strategy.close('L', comment = 'EXIT VOLATILITY', when = Svol[1] )
strategy.close('L', comment = 'EXIT MF' , when = Scrit[1] )
else
strategy.entry('S Seasonal' , direction = _S, when = Sseasonal )
strategy.entry('S Volatility', direction = _S, when = Svol[1] )
strategy.entry('S MF Crit.' , direction = _S, when = Scrit[1] )
else
strategy.close_all()
string SIGNAL = switch
(Long) => 'Long Seasonal'
(Sseasonal and i_onlyL) => 'Exit Seasonal'
(Svol[1] and i_onlyL) => 'Exit Volatility'
(Scrit[1] and i_onlyL) => 'Exit Money Flow'
(Sseasonal and not i_onlyL) => 'Short Seasonal'
(Svol[1] and not i_onlyL) => 'Short Volatility'
(Scrit[1] and not i_onlyL) => 'Short Money Flow Bearish'
=> 'none'
string date = str.format(
'{0,number,0000}-{1,number,00}-{2,number,00}',
year, month, dayofmonth
)
var table dTable = table.new(position = i_Tpos,
columns = 2,
rows = 17,
frame_color = color.new(#000000, i_Ttransp),
frame_width = 4
) //
// @function Helper to populate the table rows.
tRow(tableId, idx, left, right, tcol=0) =>
color _bg = color.new(idx % 2 ? i_Tcrowo : i_Tcrowe, i_Ttransp)
color _tx = switch (tcol)
(1) => color.new(i_Tcsigt, i_Ttransp)
(2) => color.new(i_Tctitt, i_Ttransp)
=> color.new(i_Tcdeft, i_Ttransp)
// table.cell( table_id=tableId,
// column=0, row=idx,
// text=left, text_color=_tx, text_halign=text.align_right, text_size=i_Ttsize,
// bgcolor=_bg) //
// table.cell( table_id=tableId,
// column=1, row=idx,
// text=str.tostring(right), text_color=_tx, text_halign=text.align_left, text_size=i_Ttsize,
// bgcolor=_bg) //
if i_showT
float _atr10 = ta.atr(10)[i_lback]
string _nf = '0.00'
string _aru = '🔼 ', string _ard = '🔽 '
// id | idx | left label | right label | conditional color |
tRow(dTable, 00, 'S&P500 Hybrid Seasonal ' , '' , 2 )
tRow(dTable, 01, 'Created By: Markos Katsanos' , '' , 2 )
tRow(dTable, 02, 'Date:' , date[i_lback] )
tRow(dTable, 03, 'Signal:' , SIGNAL[i_lback] )
tRow(dTable, 04, 'Price:' , open[i_lback] )
tRow(dTable, 05, 'VIX:' , str.tostring( VIX[i_lback], _nf) )
tRow(dTable, 06, 'VFI:' , str.tostring( VFI[i_lback], _nf) , VFIatCrit ? 1 : 0 )
tRow(dTable, 07, 'ATR:' , str.tostring( _atr10, _nf) )
tRow(dTable, 08, 'VIup%:' , str.tostring( VIup[i_lback], _nf) , VIup > i_maxVI ? 1 : 0 )
tRow(dTable, 09, 'ATRup%:' , str.tostring(ATRup[i_lback], _nf) , ATRup > i_K * i_maxVI ? 1 : 0 )
tRow(dTable, 10, 'VIdn%:' , str.tostring( VIdn[i_lback], _nf) )
tRow(dTable, 11, 'ATRdn%:' , str.tostring(ATRdn[i_lback], _nf) )
tRow(dTable, 12, _aru + 'Long Seasonal:' , Long[i_lback] )
tmp = 12
if not i_onlyL
tmp := 13
tRow(dTable, 13, _ard + 'Short:' , Short[i_lback] , Short[i_lback] ? 1 : 0 )
tRow(dTable, tmp+1, _ard + 'Seasonal:' , Sseasonal[i_lback] , Sseasonal[i_lback] ? 1 : 0 )
tRow(dTable, tmp+2, _ard + 'Volatility:' , Svol[1+i_lback] , Svol[1 + i_lback] ? 1 : 0 )
tRow(dTable, tmp+3, _ard + 'Money Flow:' , Scrit[i_lback] , Scrit[i_lback] ? 1 : 0 )