Chiến lược xu hướng BB KC tiến bộ
Tổng quan
Chiến lược này sử dụng sự kết hợp của các tín hiệu Brin và Kate để xác định xu hướng thị trường. Brin là một công cụ phân tích kỹ thuật để xác định các kênh dựa trên phạm vi biến động giá; Kate là một chỉ số kỹ thuật kết hợp biến động giá và xu hướng để đánh giá hỗ trợ hoặc áp lực. Chiến lược này tích hợp lợi thế của hai chỉ số để tìm kiếm cơ hội làm nhiều việc bằng cách đánh giá xem có sự giao thoa vàng giữa Brin và Kate xảy ra hay không, đồng thời kiểm tra tình huống giao dịch tổng hợp để xác nhận tín hiệu, có thể xác định hiệu quả sự bắt đầu của xu hướng và nén tối đa các tín hiệu không hiệu quả.
Nguyên tắc chiến lược
- Tính toán đường ray trung tâm, đường ray trên và đường ray dưới của Brin trong 20 chu kỳ, băng thông được quy định bằng 2 lần chênh lệch tiêu chuẩn.
- Tính toán 20 chu kỳ của Kate giữa đường ray, đường ray trên và đường ray dưới, băng thông được quy định bằng 2.2 lần phạm vi dao động thực tế.
- Khi Kate trên đường ray trực tuyến đi qua dây chuyền Brin trên đường ray và số lượng giao dịch lớn hơn trung bình 10 chu kỳ, hãy làm nhiều hơn.
- Khi Kate vượt qua đường ray dưới đường dây dưới đường ray và số lượng giao dịch lớn hơn trung bình 10 chu kỳ, hãy làm trống.
- Nếu 20 đường K không rút ra sau khi mở vị trí, hãy buộc dừng lỗ rút ra.
- Cài đặt dừng lỗ 1.5% sau khi mua, dừng lỗ 1.5% sau khi mua; Cài đặt dừng theo dõi 2% sau khi mua, dừng theo dõi -2% sau khi mua.
Chiến lược này dựa chủ yếu vào phạm vi và cường độ dao động của băng tần Brin, sử dụng xác minh hỗ trợ Kate Line, sử dụng hai chỉ số có các tham số khác nhau nhưng có tính chất tương tự để tăng độ chính xác của tín hiệu và đưa vào số lượng giao dịch cũng có thể giảm hiệu quả tín hiệu không hiệu quả.
Phân tích lợi thế
- Sử dụng lợi thế của cả hai chỉ số Brin và Kate để tăng độ chính xác của tín hiệu giao dịch.
- Kết hợp các chỉ số giao dịch, có thể giảm hiệu quả các tín hiệu vô hiệu của thị trường.
- Thiết lập và theo dõi các cơ chế dừng lỗ để kiểm soát rủi ro hiệu quả.
- Cài đặt dừng dừng bắt buộc sau tín hiệu vô hiệu, có thể dừng dừng dừng nhanh chóng.
Phân tích rủi ro
- Các đường Brin và Kate đều dựa trên đường trung bình di chuyển và kết hợp với tính toán biến động, dễ gây ra tín hiệu sai trong tình huống chấn động.
- Các cơ chế không có lợi nhuận có thể gây ra tổn thất quá lớn khi bị đặt nhiều lần.
- Tín hiệu đảo ngược là phổ biến hơn, dễ bị mất cơ hội xu hướng sau khi điều chỉnh tham số. Có thể nới lỏng mức dừng lỗ thích hợp hoặc thêm các tín hiệu lọc chỉ số phụ trợ như MACD để giảm nguy cơ tín hiệu sai.
Hướng tối ưu hóa
- Các tham số khác nhau có thể được kiểm tra ảnh hưởng đến tỷ lệ lợi nhuận của chiến lược, chẳng hạn như độ dài đường trung bình điều chỉnh, nhân của chênh lệch chuẩn.
- Các chỉ số khác có thể được kết hợp để xác định tín hiệu, chẳng hạn như chỉ số KDJ hoặc MACD.
- Các tham số có thể được tự động tối ưu hóa thông qua các phương pháp học máy.
Tóm tắt
Chiến lược này sử dụng tổng hợp các chỉ số Brin và Kate để xác định xu hướng thị trường và được hỗ trợ bởi các chỉ số khối lượng giao dịch để xác minh tín hiệu. Chiến lược này có thể được tăng cường hơn nữa bằng cách tối ưu hóa tham số, thêm các chỉ số kỹ thuật khác để có thể thích ứng với các tình huống thị trường rộng hơn. Chiến lược này có khả năng hoạt động mạnh mẽ tổng thể và là một trong những chiến lược giao dịch định lượng dễ nắm bắt và điều chỉnh.
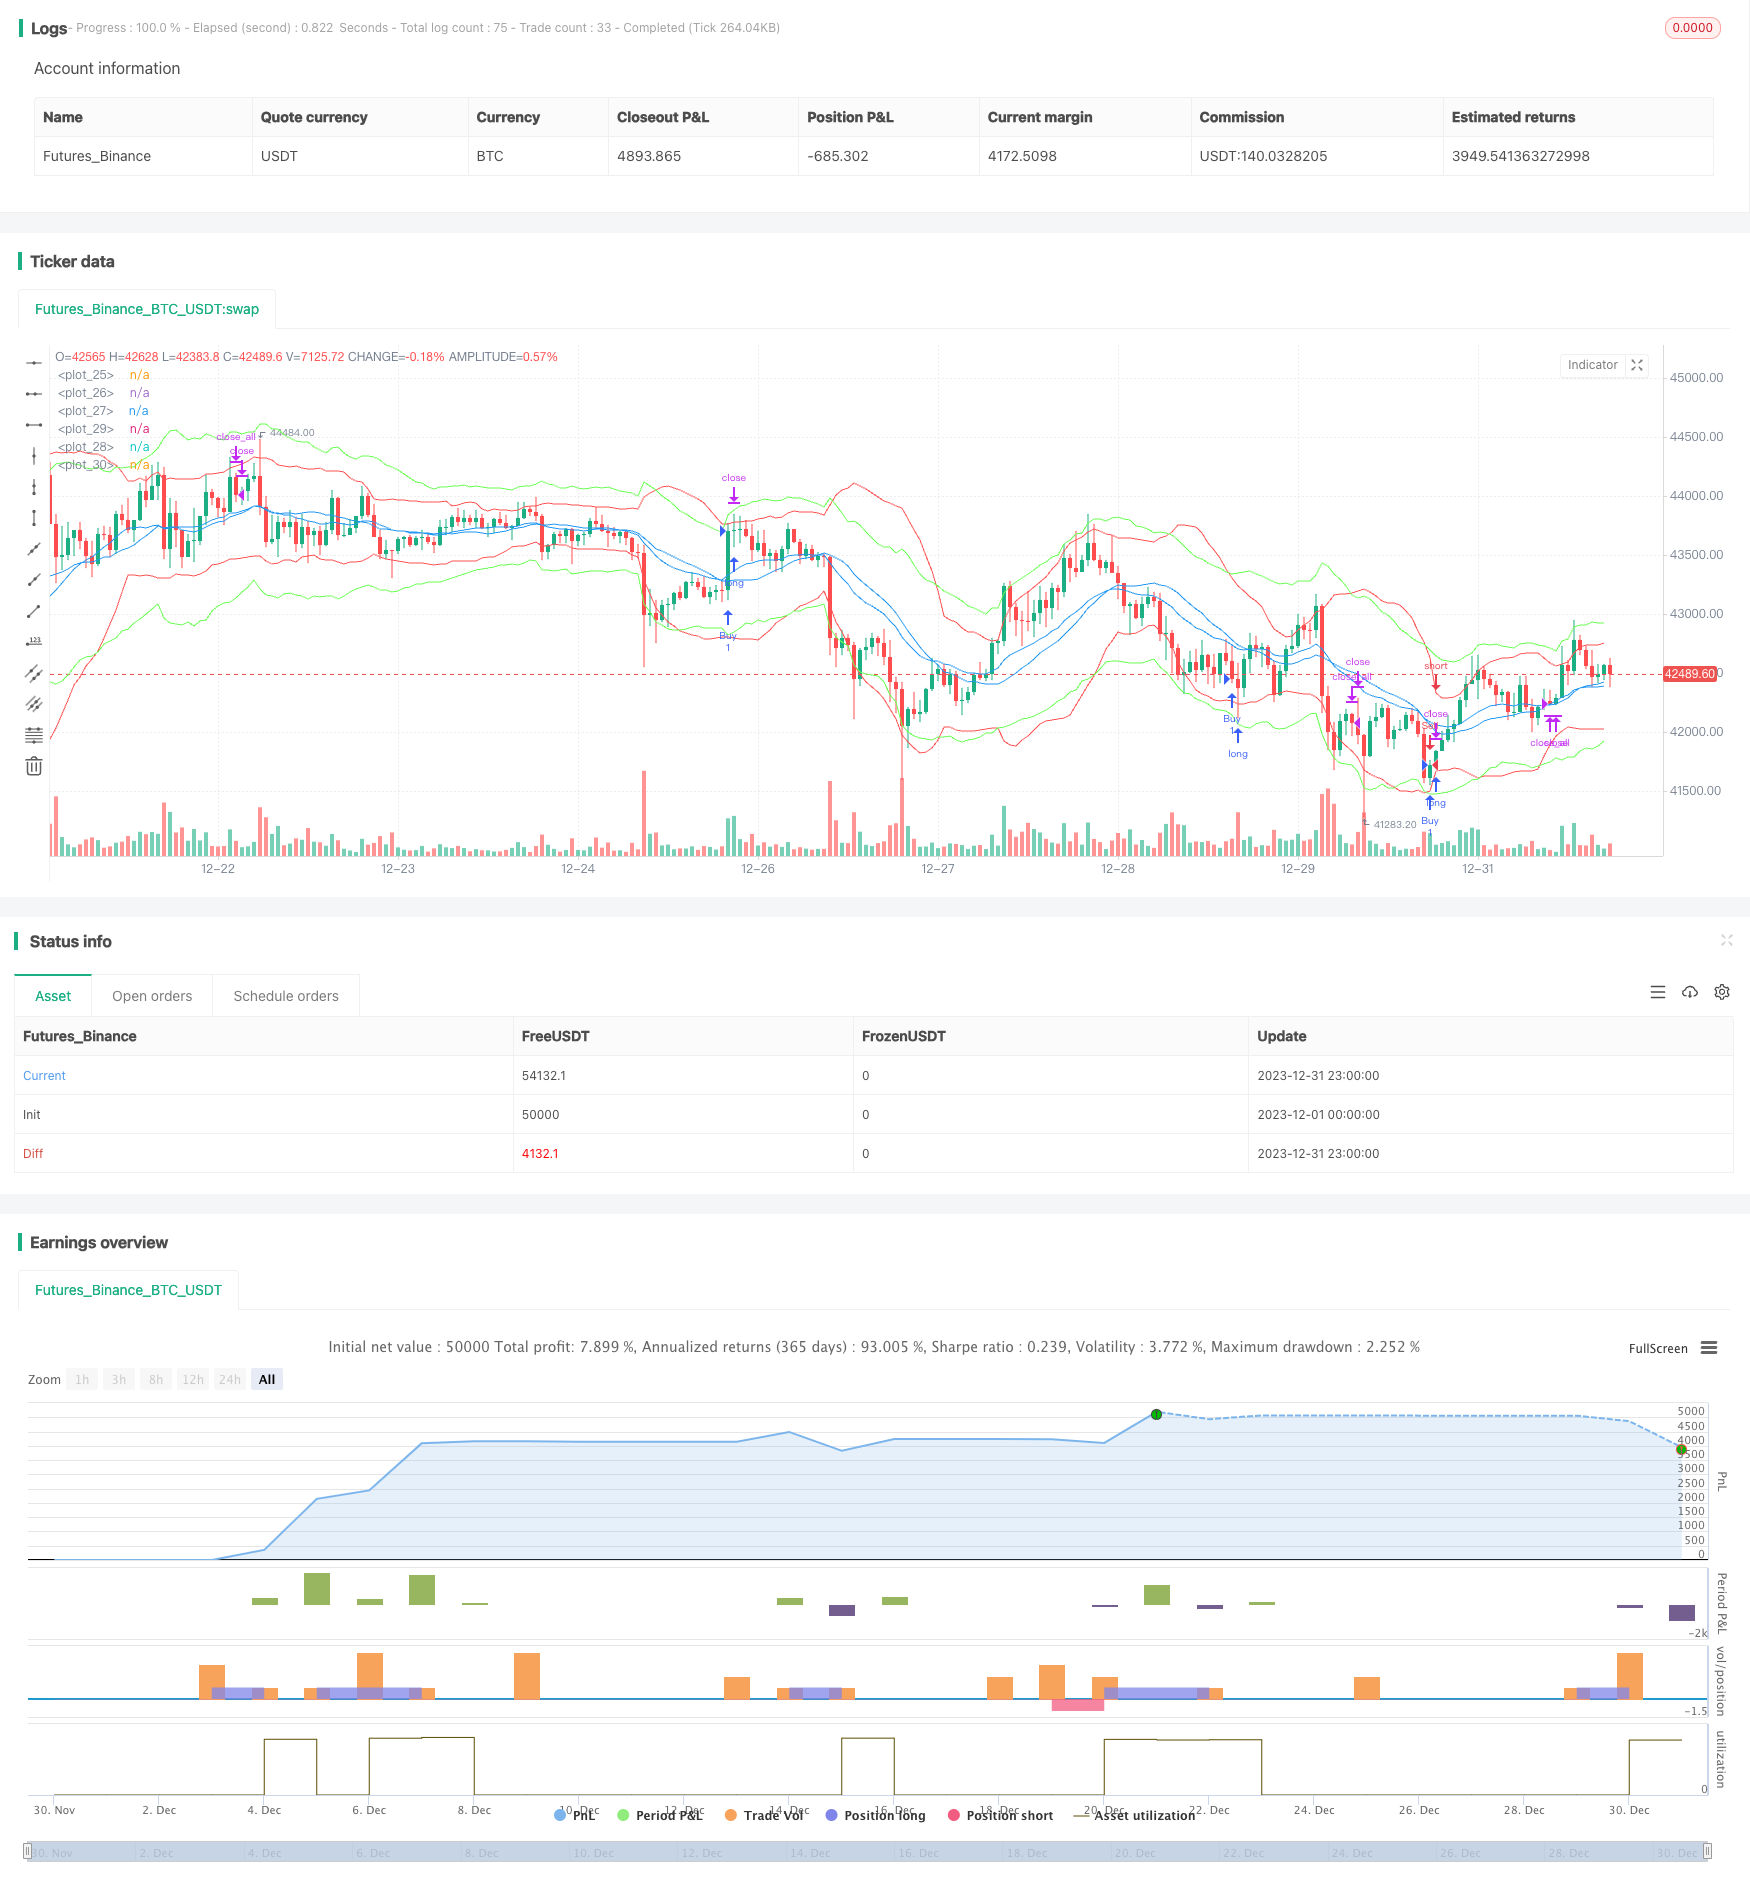
/*backtest
start: 2023-12-01 00:00:00
end: 2023-12-31 23:59:59
period: 1h
basePeriod: 15m
exchanges: [{"eid":"Futures_Binance","currency":"BTC_USDT"}]
*/

// This source code is subject to the terms of the Mozilla Public License 2.0 at https://mozilla.org/MPL/2.0/
// © jensenvilhelm

//@version=5
strategy("BB and KC Strategy", overlay=true)

// Define the input parameters for the strategy, these can be changed by the user to adjust the strategy
kcLength = input.int(20, "KC Length", minval=1) // Length for Keltner Channel calculation
kcStdDev = input.float(2.2, "KC StdDev") // Standard Deviation for Keltner Channel calculation
bbLength = input.int(20, "BB Length", minval=1) // Length for Bollinger Bands calculation
bbStdDev = input.float(2, "BB StdDev") // Standard Deviation for Bollinger Bands calculation
volumeLength = input.int(10, "Volume MA Length", minval=1) // Length for moving average of volume calculation
stopLossPercent = input.float(1.5, "Stop Loss (%)") // Percent of price for Stop loss
trailStopPercent = input.float(2, "Trail Stop (%)") // Percent of price for Trailing Stop
barsInTrade = input.int(20, "Bars in trade before exit", minval = 1) // Minimum number of bars in trade before considering exit

// Calculate Bollinger Bands and Keltner Channel
[bb_middle, bb_upper, bb_lower] = ta.bb(close, bbLength, bbStdDev) // Bollinger Bands calculation
[kc_middle, kc_upper, kc_lower] = ta.kc(close, kcLength, kcStdDev) // Keltner Channel calculation

// Calculate moving average of volume
vol_ma = ta.sma(volume, volumeLength) // Moving average of volume calculation

// Plotting Bollinger Bands and Keltner Channels on the chart
plot(bb_upper, color=color.red) // Bollinger Bands upper line
plot(bb_middle, color=color.blue) // Bollinger Bands middle line
plot(bb_lower, color=color.red) // Bollinger Bands lower line
plot(kc_upper, color=color.rgb(105, 255, 82)) // Keltner Channel upper line
plot(kc_middle, color=color.blue) // Keltner Channel middle line
plot(kc_lower, color=color.rgb(105, 255, 82)) // Keltner Channel lower line

// Define entry conditions: long position if upper KC line crosses above upper BB line and volume is above MA of volume
// and short position if lower KC line crosses below lower BB line and volume is above MA of volume
longCond = ta.crossover(kc_upper, bb_upper) and volume > vol_ma // Entry condition for long position
shortCond = ta.crossunder(kc_lower, bb_lower) and volume > vol_ma // Entry condition for short position

// Define variables to store entry price and bar counter at entry point
var float entry_price = na // variable to store entry price
var int bar_counter = na // variable to store bar counter at entry point

// Check entry conditions and if met, open long or short position
if (longCond)
    strategy.entry("Buy", strategy.long) // Open long position
    entry_price := close // Store entry price
    bar_counter := 1 // Start bar counter
if (shortCond)
    strategy.entry("Sell", strategy.short) // Open short position
    entry_price := close // Store entry price
    bar_counter := 1 // Start bar counter

// If in a position and bar counter is not na, increment bar counter
if (strategy.position_size != 0 and na(bar_counter) == false)
    bar_counter := bar_counter + 1 // Increment bar counter

// Define exit conditions: close position if been in trade for more than specified bars
// or if price drops by more than specified percent for long or rises by more than specified percent for short
if (bar_counter > barsInTrade) // Only consider exit after minimum bars in trade
    if (bar_counter >= barsInTrade)
        strategy.close_all() // Close all positions
    // Stop loss and trailing stop
    if (strategy.position_size > 0)
        strategy.exit("Sell", "Buy", stop=entry_price * (1 - stopLossPercent/100), trail_points=entry_price * trailStopPercent/100) // Set stop loss and trailing stop for long position
    else if (strategy.position_size < 0)
        strategy.exit("Buy", "Sell", stop=entry_price * (1 + stopLossPercent/100), trail_points=entry_price * trailStopPercent/100) // Set stop loss and trailing stop for short position