Chiến lược dừng lỗ theo xu hướng RSI
Tổng quan
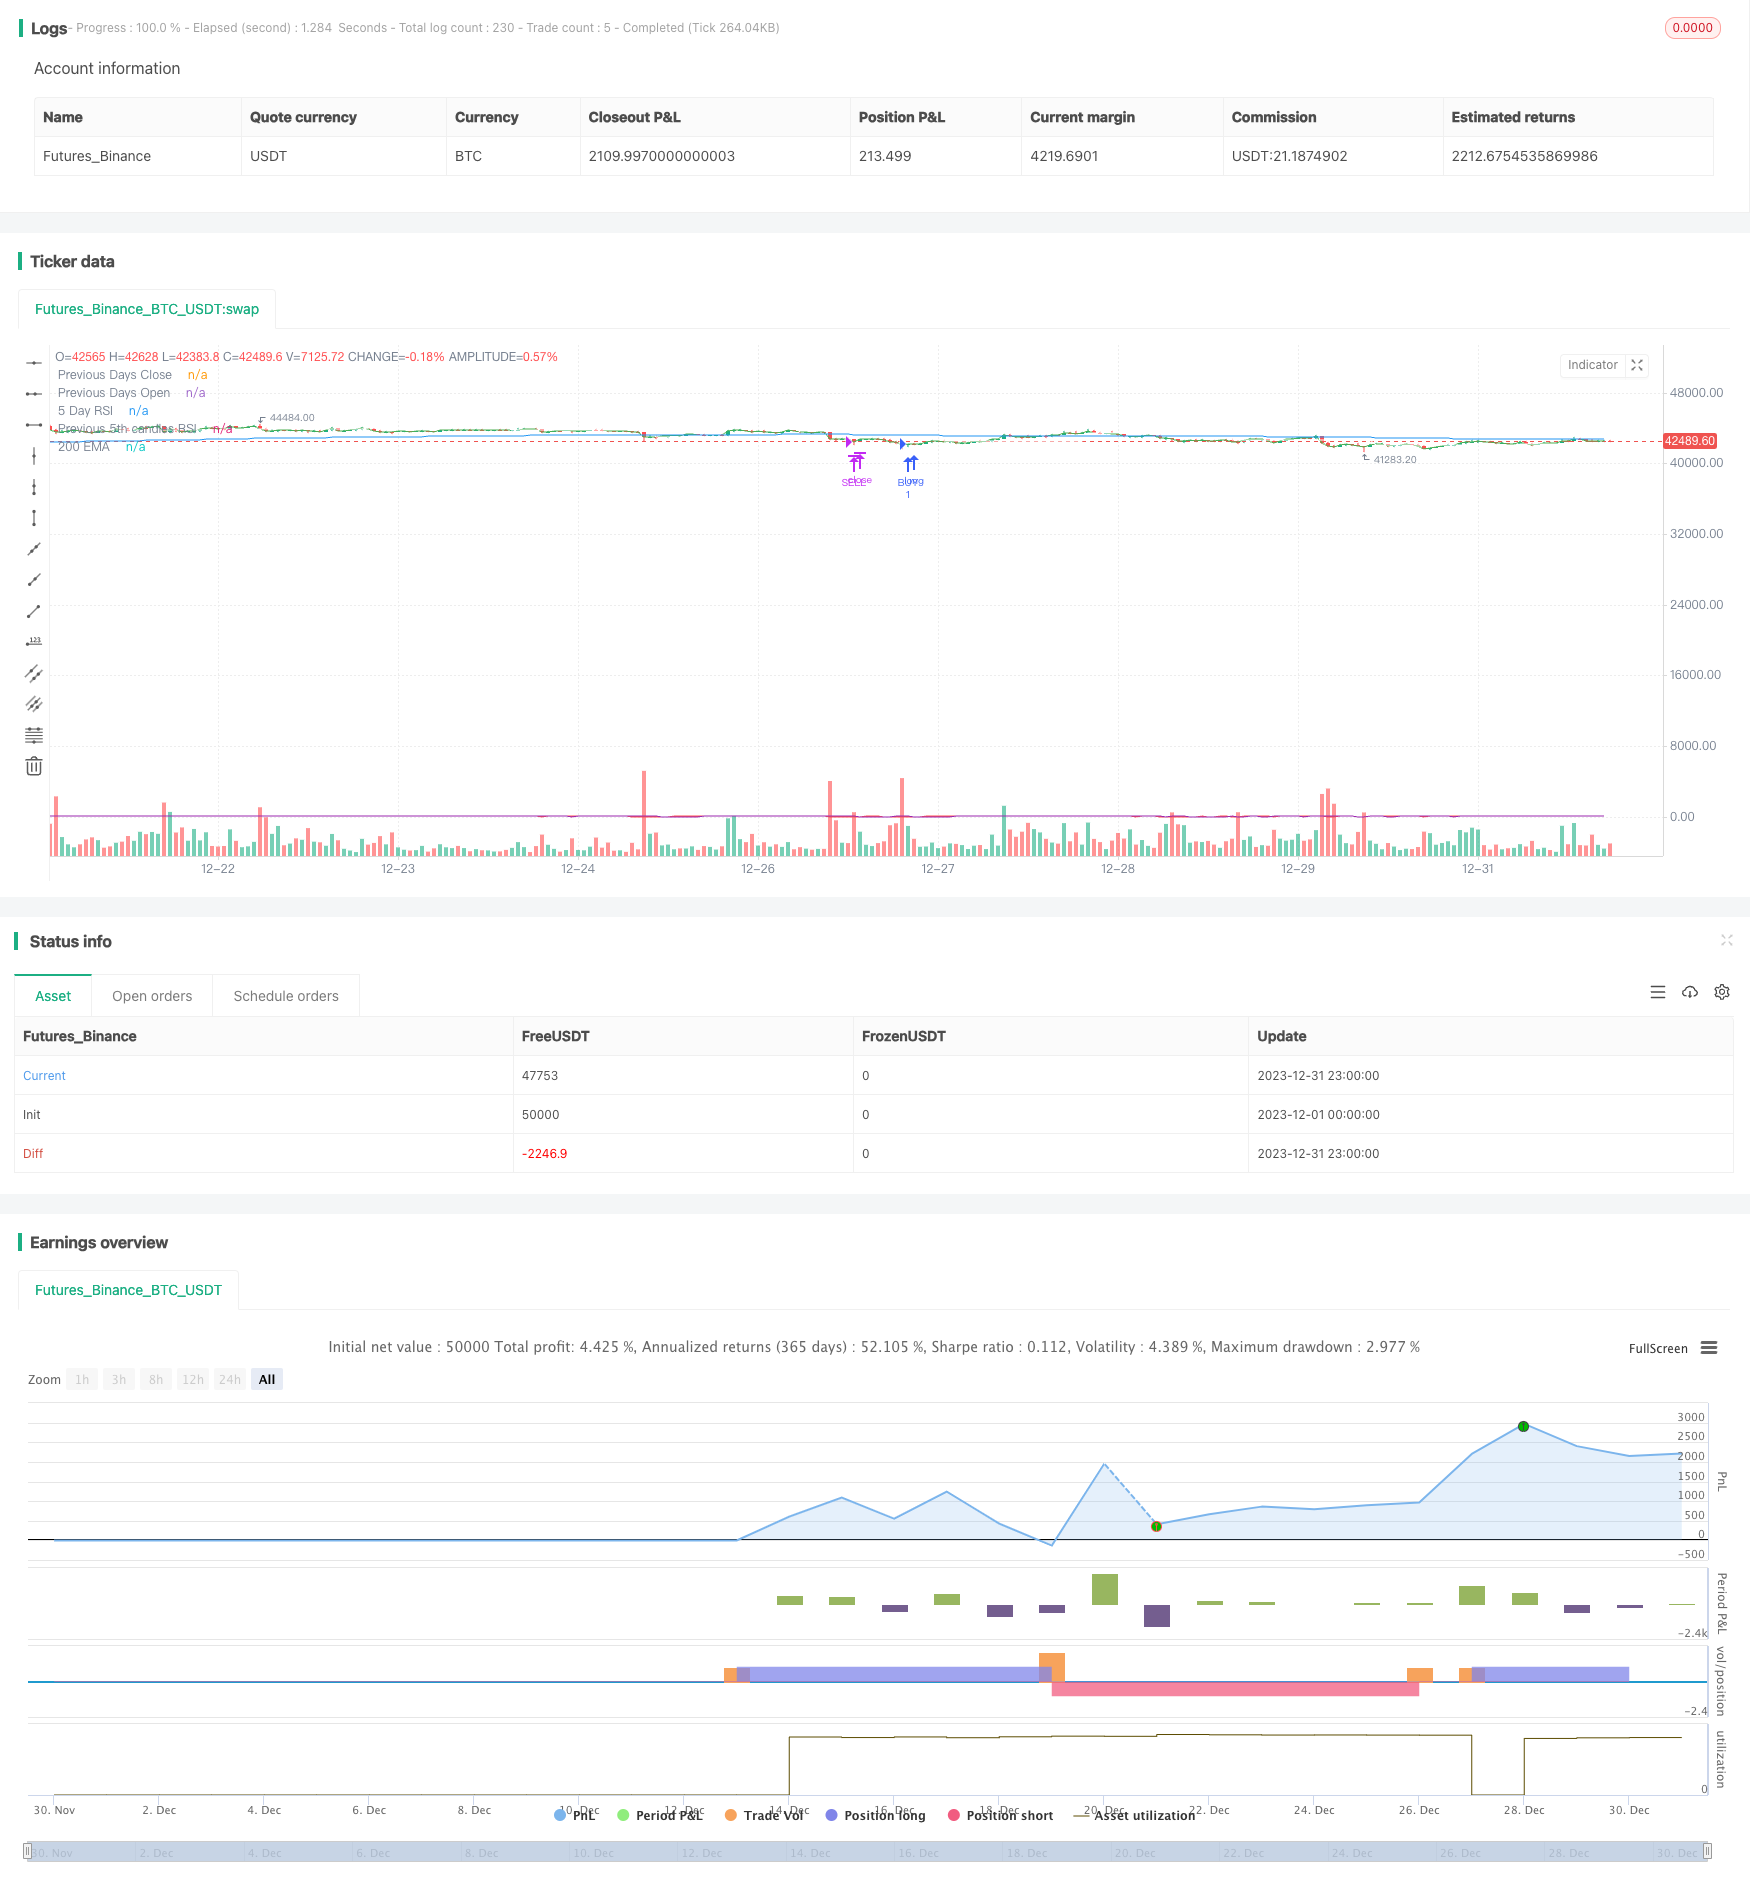
Đây là một chiến lược giao dịch định lượng sử dụng chỉ số RSI để xác định xu hướng và thiết lập điểm dừng lỗ. Chiến lược này kết hợp chỉ số RSI để xác định hướng xu hướng của thị trường và thiết lập điểm dừng động để khóa lợi nhuận, giảm thiểu tối đa rủi ro.
Nguyên tắc chiến lược
Chiến lược này chủ yếu dựa trên chỉ số RSI để xác định xu hướng của thị trường. Khi RSI vượt qua đường thấp, thị trường đang có xu hướng tăng, hãy làm nhiều hơn; Khi RSI vượt qua đường cao, thị trường đang có xu hướng giảm, hãy làm giảm.
Trong khi đó, chiến lược thiết lập dừng lỗ nổi bằng cách theo dõi giá mở vị trí cho mỗi đơn. Đối với nhiều đơn đặt một tỷ lệ nhất định của giá mở vị trí làm đường dừng lỗ, và cho đơn mở vị đặt một tỷ lệ nhất định của giá mở vị trí làm đường dừng. Khi giá chạm vào đường dừng lỗ, chiến lược sẽ tự động dừng lỗ hoặc dừng.
Lợi thế chiến lược
- Sử dụng chỉ số RSI để đánh giá xu hướng thị trường, tránh giao dịch trong khoảng thời gian thu hẹp.
- Thiết lập các điểm dừng lỗ nổi, có thể khóa lợi nhuận một cách linh hoạt và kiểm soát rủi ro một cách hiệu quả;
- Các tham số RSI và tỷ lệ dừng lỗ có thể được điều chỉnh và tối ưu hóa thông qua đầu vào bên ngoài.
Rủi ro chiến lược
- Chỉ số RSI có thể bị trễ một chút và có thể bỏ lỡ điểm chuyển hướng ngắn hạn.
- Lây quá gần có thể bị phá vỡ.
Hướng tối ưu hóa
- Có thể kiểm tra hiệu quả của các chỉ số RSI trong các chu kỳ khác nhau;
- Có thể thử nghiệm các kết hợp tham số khác nhau để tìm tỷ lệ dừng lỗ tối ưu;
- Các chỉ số bổ sung có thể được thêm vào để đánh giá các tín hiệu lọc.
Tóm tắt
Chiến lược này nói chung là một chiến lược giao dịch định lượng sử dụng các chỉ số RSI để theo dõi xu hướng và kết hợp với lệnh dừng lỗ nổi. Chiến lược này làm tốt hơn trong việc kiểm soát rủi ro và có thể khóa lợi nhuận hiệu quả so với chiến lược giao dịch chỉ số đơn.
/*backtest
start: 2023-12-01 00:00:00
end: 2023-12-31 23:59:59
period: 1h
basePeriod: 15m
exchanges: [{"eid":"Futures_Binance","currency":"BTC_USDT"}]
*/

// This source code is subject to the terms of the Mozilla Public License 2.0 at https://mozilla.org/MPL/2.0/
// ©chewyScripts.

//@version=5
strategy("96er RSI+200EMA Strategy + Alerts", overlay=true, shorttitle = "The old 96er - RSI5 + 200 EMA")
//,use_bar_magnifier=false
// This works best on a small account $100, with 50% of equity and up to 10 max open trades.
// 96% Profitable, turns $100 into $350 in 1 month. very few losses. super happy with it.
// So far it triples the account on a 1m chart in 1 month back testing on the SEI-USD pair.
// I did not test on FX pairs or other instruments.
// had some issues with the inputs not working so had to hard code some, also the lastClose var sometimes breaks and starts following every candle, not sure why.

in_r1 = input.int(8,"5 day input or RSI1", group = "Signals")
in_lowerRSI = input.int(28,"RSI Lower", group = "Signals")
in_upperRSI = input.int(72,"RSI Upper ", group = "Signals")
in_emaperiod = input.int(200,"EMA Period", group = "Signals")
in_daysback = input.int(1,"Look back days for close/open", group = "Signals")

in_openOrders = input.int(5,"max open orders",tooltip = "Be careful, to high and you will get margin called!! 5 is probably the highest you should go", group = "Order Controls")
in_buybreakout = input.int(40,"Buy breakout range", group = "Order Controls")

in_buyTP = input.float(1.1500,"Buy TP: 1+TP %, .05 seems to work well.", group = "TPSL")
in_sellTP = input.float(0.9750, "Sell TP: 1-TP%. .025 seems to work well. ", group = "TPSL")

in_useAlerts = input.bool(false,"Turns on Buy/Sell Alerts",group = "Alerts")
in_useCustomAlertMSG = input.bool(false,"Use default Buy/Sell or the messages below",group = "Alerts")
in_alertBuySignalTxt = input("Buy","Buy signal API/TXT message template", tooltip = "Review the UserGuid on JSON varibles in alerts", group = "Alerts")
in_alertSellSignalTxt = input("Sell","Sell signal API/TXT message template", tooltip = "Review the UserGuid on JSON varibles in alerts", group = "Alerts")

simple int rsi5 = in_r1

// 3 rsi strategy , when all of them are overbought we sell, and vice versa
rsi7 = ta.rsi(close,rsi5)
[lastOpen, lastClose] = request.security(syminfo.tickerid, "D", [open,close], lookahead = barmerge.lookahead_on)
rsi3 = ta.rsi(close[5],rsi5)

ma = ta.ema(close,in_emaperiod)

plot(rsi7,"5 Day RSI",color.red)
plot(lastClose,"Previous Days Close",color.green)
plot(lastOpen,"Previous Days Open",color.white)
plot(rsi3,"Previous 5th candles RSI",color.purple)
plot(ma,"200 EMA",color.blue)


//sell = ta.crossunder(rsi7,70) and ta.crossunder(rsi14,70) and ta.crossunder(rsi21,70)
//buy = ta.crossover(rsi7,in_lowerRSI) and close < ma and rsi3 <= in_upperRSI and strategy.opentrades < in_openOrders
//sell = ta.crossunder(rsi7,in_upperRSI) and close > ma and rsi3 >= in_lowerRSI3 and strategy.opentrades < in_openOrders

//buy condition
buy = ta.crossover(rsi7,in_lowerRSI) and close < ma and close < lastClose and strategy.opentrades < in_openOrders

// sell condition
sell = ta.crossunder(rsi7,in_upperRSI) and close > ma and close > lastClose and strategy.opentrades < in_openOrders


var lastBuy = close
var lastSell = close
//var buyLabel = label.new(na,na,yloc = yloc.belowbar, style = label.style_none, textcolor = color.green, size = size.normal)
//var sellLabel = label.new(na,na,yloc = yloc.abovebar, style = label.style_none, textcolor = color.red, size = size.normal)
if (buy)
    strategy.entry("BUY", strategy.long,alert_message = "Buy @"+str.tostring(close))
    lastBuy := close
    //buyLabel := label.new(na,na,yloc = yloc.belowbar, style = label.style_none, textcolor = color.green, size = size.normal)
    //label.set_x(buyLabel,bar_index)
    //label.set_y(buyLabel,low)
    //label.set_text(buyLabel,"Buy!!@ " +str.tostring(lastBuy)  + "\n TP: " + str.tostring(lastBuy*in_buyTP) + "\n↑")
    if(not in_useAlerts)
        alert("Buy")

//label.delete(buyLabel)

if ((close >= lastBuy*in_buyTP ) or (rsi7 > in_buybreakout) and close >= lastClose and (close >= lastClose*in_buyTP or close >= lastBuy*in_buyTP ) )
    //label.new(bar_index,na,"TP!!@ " +str.tostring(close), yloc = yloc.abovebar, style = label.style_none, textcolor = color.green, size = size.normal)
    strategy.close("BUY", "BUY Exit",alert_message = "Buy Exit: TP @" +str.tostring(close) + " OR TP: " + str.tostring(lastBuy*in_buyTP))
    if(not in_useAlerts)
        alert("Buy Exit")

if (sell)
    strategy.entry("SELL", strategy.short, alert_message = "Sell @ " + str.tostring(close))
    lastSell := close
    //sellLabel := label.new(na,na,yloc = yloc.abovebar, style = label.style_none, textcolor = color.red, size = size.normal)
    //label.set_x(sellLabel,bar_index)
    //label.set_y(sellLabel,high)
    //label.set_text(sellLabel,"Sell!!@ " +str.tostring(lastSell)  + "\n TP: " + str.tostring(lastSell*in_sellTP) + "\n🠇")
    if(not in_useAlerts)
        alert("Sell")

//label.delete(sellLabel)

if ( close < ma and (close <= lastSell*in_sellTP ) or (close < lastClose*in_sellTP) )
    //label.new(bar_index,na,"TP!!@ " +str.tostring(close), yloc = yloc.belowbar, style = label.style_none, textcolor = color.red, size = size.normal)
    strategy.close("SELL", "Sell Exit", alert_message = "Sell Exit TP @" +str.tostring(close) + " OR TP: " + str.tostring(lastSell*in_sellTP))
    if(not in_useAlerts)
        alert("Sell Exit")


alertcondition(buy and in_useAlerts,"Buy Alert","test")