Chiến lược theo xu hướng dựa trên đường trung bình động EMA
Tổng quan
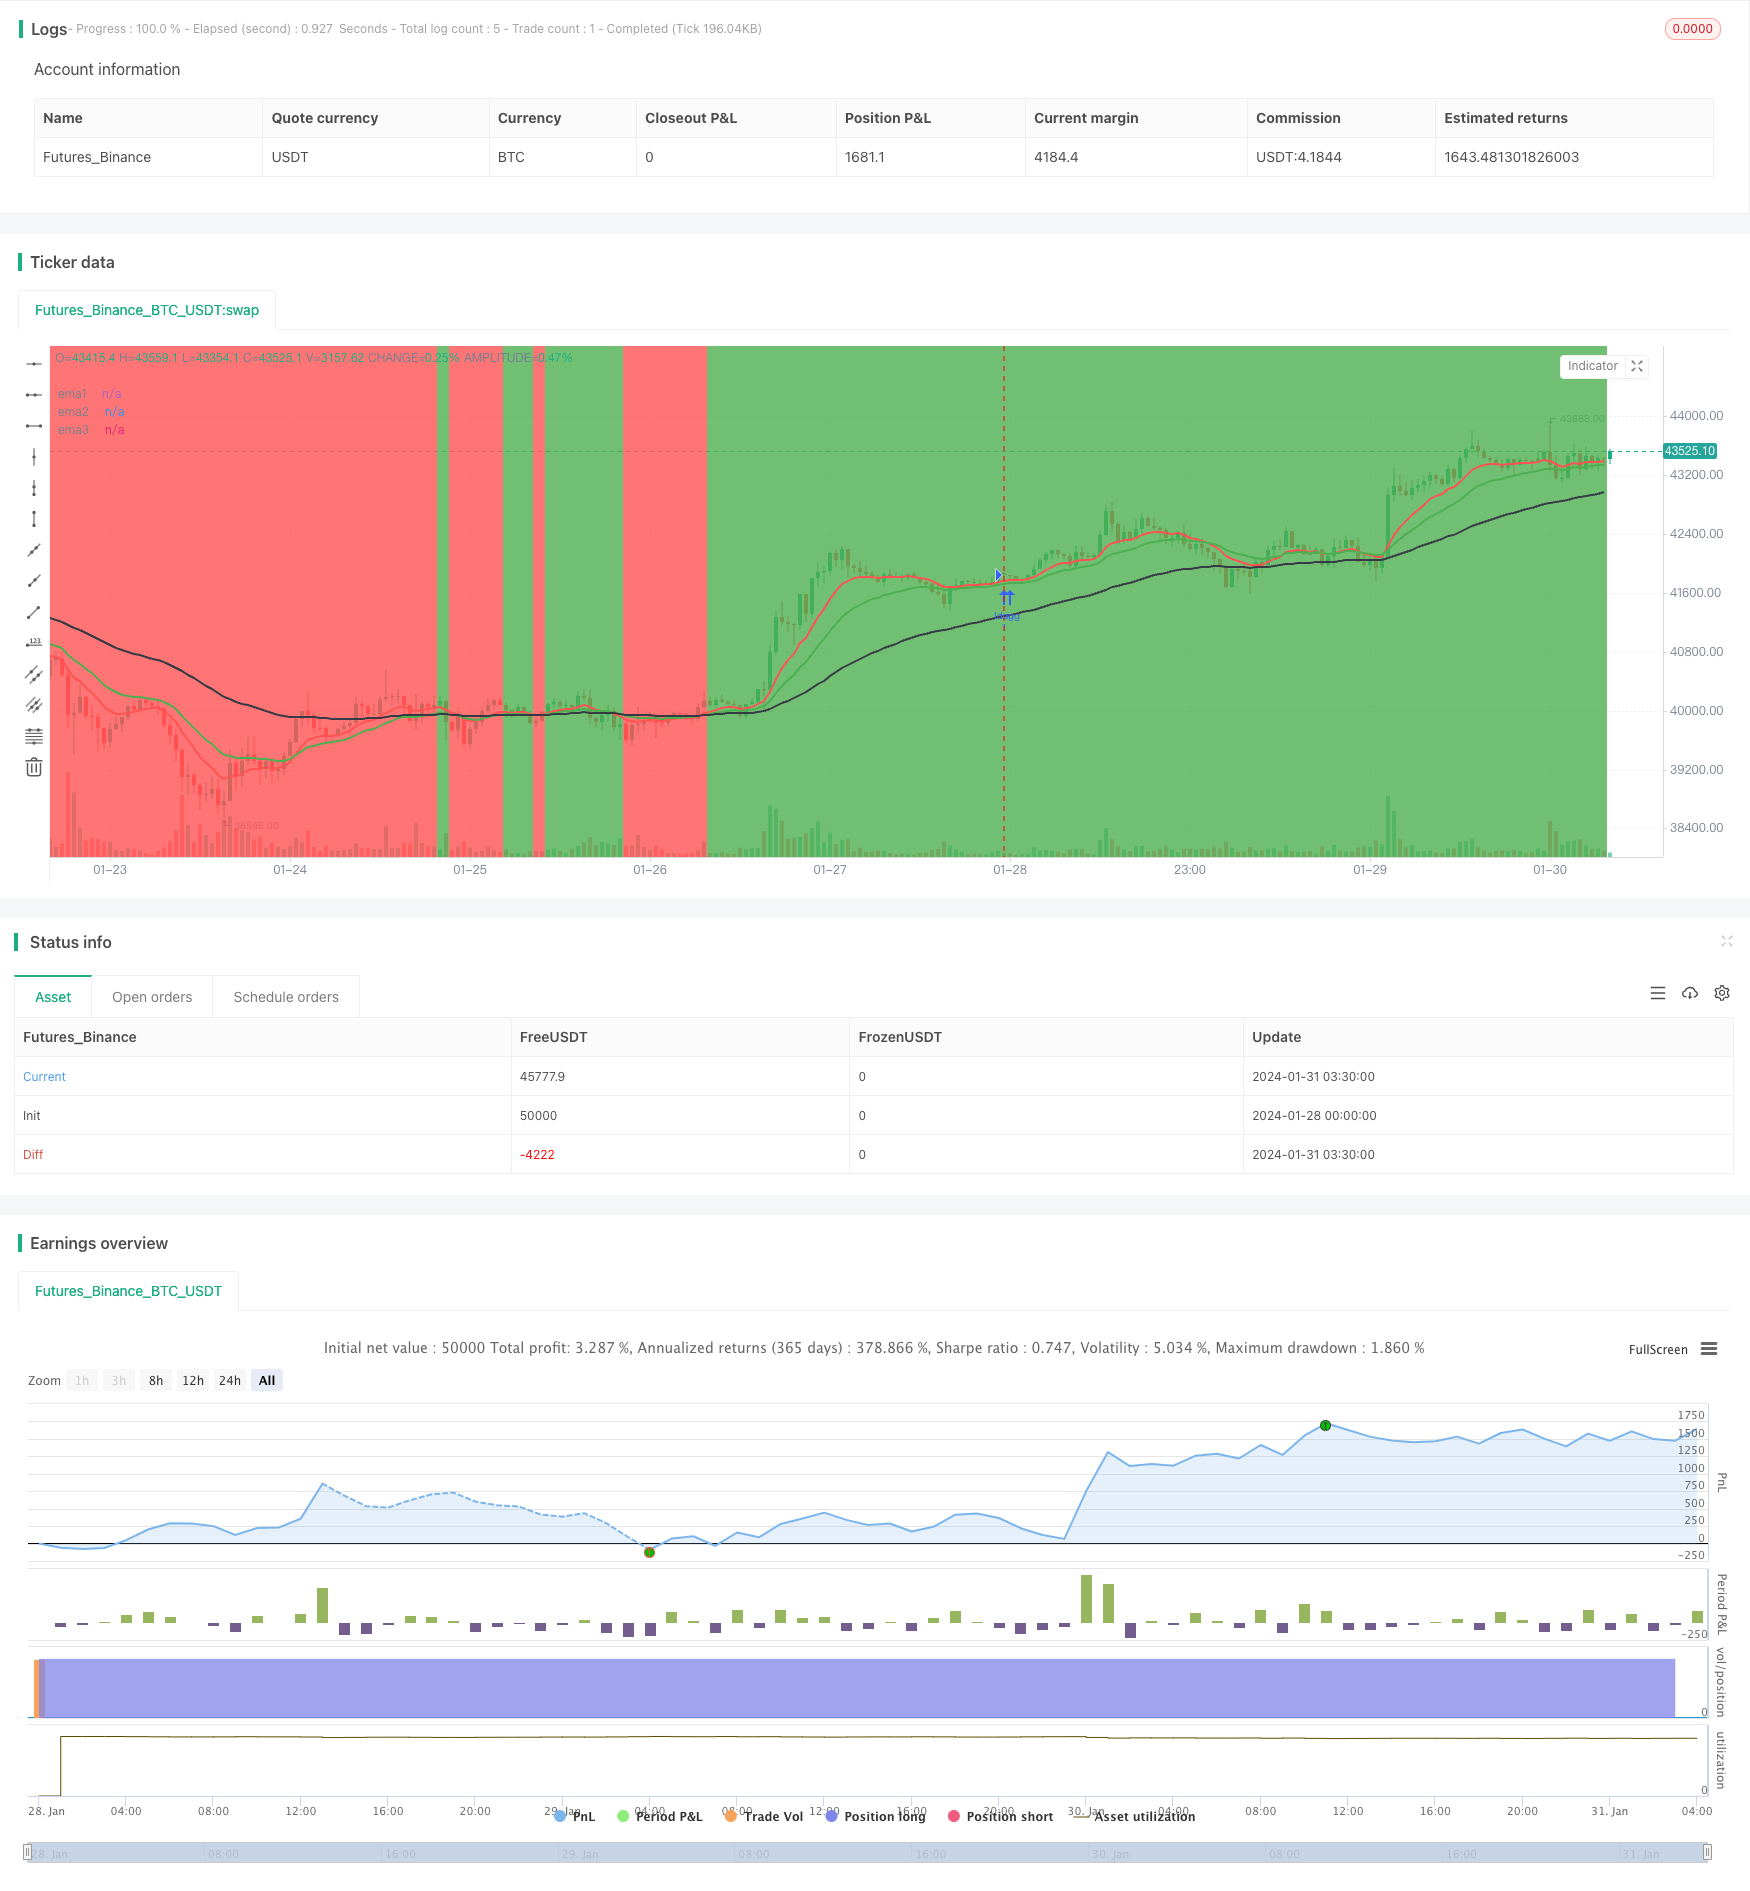
Chiến lược này dựa trên trung bình EMA của 3 chu kỳ khác nhau để đánh giá hướng xu hướng hiện tại bằng cách đánh giá xem giá có nằm trên trung bình EMA hay không. Nó tạo ra tín hiệu mua khi đường EMA ngắn xuyên qua đường EMA dài; nó tạo ra tín hiệu bán khi đường EMA ngắn xuyên qua đường EMA dài.
Nguyên tắc chiến lược
Chiến lược này sử dụng 3 đường trung bình EMA, là đường 10, đường 20 và đường 50. Quy tắc phán đoán của nó là:
Khi đường EMA 10 và đường EMA 20 cùng nằm trên đường EMA 50, được định nghĩa là xu hướng tăng;
Xu hướng giảm được định nghĩa khi đường 10 EMA và đường 20 EMA cùng nằm dưới đường 50 EMA;
Tín hiệu mua được tạo ra khi đường EMA ngắn hạn (đường 10 ngày và đường 20 ngày) đi qua đường EMA dài hạn (đường 50 ngày);
Tín hiệu bán được tạo ra khi đường EMA ngắn hạn (đường 10 ngày và đường 20 ngày) đi qua đường EMA dài hạn (đường 50 ngày);
giữ nhiều vị trí đầu trong xu hướng tăng và giữ vị trí đầu trống trong xu hướng giảm;
Khi xu hướng chuyển hướng, các đường ngắn EMA và đường dài xuyên qua các vị trí của tín hiệu hiện tại.
Chiến lược này được thực hiện theo từng lượt bằng cách nắm bắt lợi nhuận và khóa lợi nhuận bằng cách giữ cổ phiếu trong thời gian.
Phân tích lợi thế
Chiến lược này có những ưu điểm sau:
- Các quy tắc đơn giản, rõ ràng, dễ hiểu và dễ thực hiện.
- Sử dụng đường trung bình EMA để định hướng xu hướng và tránh bị ảnh hưởng bởi sự biến động ngắn hạn của thị trường;
- Các nhà đầu tư cũng có thể có những kế hoạch khác để giảm bớt tổn thất.
- Không cần phải dự đoán hướng đi, theo dõi xu hướng, tỷ lệ thắng cao hơn.
Phân tích rủi ro
Chiến lược này cũng có một số rủi ro:
- Trong thị trường, EMA có thể bị phá vỡ nhiều lần, và có thể thường xuyên mở các vị trí trơn tru dẫn đến chi phí giao dịch.
- Sau khi hoạt động nhảy vọt, hiệu quả của EMA trong việc đánh giá xu hướng sẽ bị ảnh hưởng, có thể bỏ lỡ cơ hội mở vị trí tốt.
Những rủi ro trên có thể được tối ưu hóa bằng cách:
- Trong trường hợp có khoảng cách nhỏ giữa các EMA, các quy tắc mở vị trí có thể được nới lỏng một cách thích hợp để tránh giao dịch quá thường xuyên;
- Kết hợp với các chỉ số khác để xác định xu hướng và tránh EMA đánh giá không hiệu quả.
Hướng tối ưu hóa
Chiến lược này có thể được tối ưu hóa theo các hướng sau:
Tối ưu hóa tham số. Có thể thử nghiệm các kết hợp tham số của các chu kỳ EMA khác nhau để tìm tham số tối ưu;
Tối ưu hóa chi phí giao dịch: Tối ưu hóa đúng quy tắc mở kho, giảm giao dịch thường xuyên không cần thiết;
Tối ưu hóa chiến lược dừng lỗ. Thiết lập mức dừng lỗ hợp lý, kiểm soát tổn thất đơn lẻ;
Kết hợp với các chỉ số khác. Sử dụng các chỉ số hỗ trợ khác như MACD, KDJ để tối ưu hóa thời gian nhập học.
Tóm tắt
Chiến lược này nói chung là khá đơn giản và thực tế. Nó sử dụng EMA để xác định xu hướng hoạt động, kèm theo chiến lược dừng lỗ thích hợp, có thể kiểm soát rủi ro hiệu quả. Đồng thời, có một số không gian tối ưu hóa, hiệu quả của chiến lược này có thể được nâng cao rất nhiều nếu kết hợp với tối ưu hóa tham số, chiến lược dừng lỗ và các chỉ số khác.
/*backtest
start: 2024-01-28 00:00:00
end: 2024-01-31 04:00:00
period: 45m
basePeriod: 5m
exchanges: [{"eid":"Futures_Binance","currency":"BTC_USDT"}]
*/

// This source code is subject to the terms of the Mozilla Public License 2.0 at https://mozilla.org/MPL/2.0/
// © mattehalen

//@version=4
//study("EMA 10,20 59",overlay=true)
strategy("EMA 10,20 59",overlay=true)
infoBox     = input(true, title="infoBox", type=input.bool)
infoBox2    = input(false, title="infoBox2", type=input.bool)
BuySellSignal_Bool = input(false, title="Buy & SellSignal", type=input.bool)
infoBoxSize = input(title="infoBoxSize", defval=size.large, options=[size.auto, size.tiny, size.small, size.normal, size.large, size.huge])
ema1Value   = input(10)
ema2Value   = input(20)
ema3Value   = input(59)
maxLoss = input(3000)
ema1        = ema(close,ema1Value)
ema2        = ema(close,ema2Value)
ema3        = ema(close,ema3Value)
objcnt      = 0
buyTitle    = tostring(close[1])
myProfit    = float(0)

plot(ema1,title="ema1",color=color.red,linewidth=2)
plot(ema2,title="ema2",color=color.green,linewidth=2)
plot(ema3,title="ema3",color=color.black,linewidth=2)

Buytrend = (ema1 and ema2 > ema3) and (ema1[1] and ema2[1] > ema3[1])
BarssinceBuyTrend = barssince(Buytrend)
BarssinceSellTrend = barssince(not Buytrend)
closeAtBuyTrend = close[1]
bgcolor(Buytrend ? color.green : color.red,transp=70)

BuySignal = Buytrend and not Buytrend[1] and BuySellSignal_Bool

BuySignalOut = Buytrend and (crossunder(ema1,ema2)) and BuySellSignal_Bool
BarssinceBuy = barssince(BuySignal)
bgcolor(BuySignal ? color.green : na , transp=30)
bgcolor(BuySignalOut ? color.black : na , transp=30)
plot(BarssinceBuy,title="BarssinceBuy",display=display.none)


SellSignal = not Buytrend and Buytrend[1] and BuySellSignal_Bool
SellSignalOut = not Buytrend and (crossover(ema1,ema2)) and BuySellSignal_Bool
BarssinceSell = barssince(SellSignal)
bgcolor(SellSignal ? color.red : na , transp=30)
bgcolor(SellSignalOut ? color.black : na , transp=30)
plot(BarssinceSell,title="BarssinceSell",display=display.none)


buyProfit   = float(0)
cntBuy      =0
sellProfit  = float(0)
cntSell     =0
buyProfit   := Buytrend and not Buytrend[1]? nz(buyProfit[1]) + (close[BarssinceBuyTrend[1]]-close) : nz(buyProfit[1])
cntBuy      := Buytrend and not Buytrend[1]? nz(cntBuy[1]) + 1: nz(cntBuy[1])
sellProfit  := not Buytrend and Buytrend[1]? nz(sellProfit[1]) + (close-close[BarssinceSellTrend[1]]) : nz(sellProfit[1])
cntSell     := not Buytrend and Buytrend[1]? nz(cntSell[1]) + 1 : nz(cntSell[1])
totalProfit = buyProfit + sellProfit

// if (Buytrend and not Buytrend[1] and infoBox==true)
//     l = label.new(bar_index - (BarssinceBuyTrend[1]/2), na,text="Close = " + tostring(close) + "\n" + "Start = "+tostring(close[BarssinceBuyTrend[1]]) + "\n" + "Profit = "+tostring(close[BarssinceBuyTrend[1]]-close) ,style=label.style_labelup, yloc=yloc.belowbar,color=color.red,size=infoBoxSize)
// if (not Buytrend and Buytrend[1] and infoBox==true)
//     l = label.new(bar_index - (BarssinceSellTrend[1]/2), na,text="Close = " + tostring(close) + "\n" + "Start = "+tostring(close[BarssinceSellTrend[1]]) + "\n" + "Profit = "+tostring(close-close[BarssinceSellTrend[1]]) ,style=label.style_labeldown, yloc=yloc.abovebar,color=color.green,size=infoBoxSize)

// if (BuySignalOut and not BuySignalOut[1] and infoBox2==true)
// //    l = label.new(bar_index - (BarssinceBuy[0]/2), na,text="Close = " + tostring(close) + "\n" + "Start = "+tostring(close[BarssinceBuy[0]]) + "\n" + "Profit = "+tostring(close-close[BarssinceBuy[0]]) ,style=label.style_labelup, yloc=yloc.belowbar,color=color.purple,size=infoBoxSize
//     l = label.new(bar_index, na,text="Close = " + tostring(close) + "\n" + "Start = "+tostring(close[BarssinceBuy[0]]) + "\n" + "Profit = "+tostring(close-close[BarssinceBuy[0]]) ,style=label.style_labelup, yloc=yloc.belowbar,color=color.lime,size=infoBoxSize)
// if (SellSignalOut and not SellSignalOut[1] and infoBox2==true)
// //    l = label.new(bar_index - (BarssinceSell[0]/2), na,text="Close = " + tostring(close) + "\n" + "Start = "+tostring(close[BarssinceSell[0]]) + "\n" + "Profit = "+tostring(close[BarssinceSell[0]]-close) ,style=label.style_labeldown, yloc=yloc.abovebar,color=color.purple,size=infoBoxSize)
//     l = label.new(bar_index, na,text="Close = " + tostring(close) + "\n" + "Start = "+tostring(close[BarssinceSell[0]]) + "\n" + "Profit = "+tostring(close[BarssinceSell[0]]-close) ,style=label.style_labeldown, yloc=yloc.abovebar,color=color.fuchsia,size=infoBoxSize)


// l2 = label.new(bar_index, na, 'buyProfit in pip = '+tostring(buyProfit)+"\n"+  'cntBuy = '+tostring(cntBuy) +"\n"+  'sellProfit in pip = '+tostring(sellProfit)+"\n"+  'cntSell = '+tostring(cntSell) +"\n"+  'totalProfit in pip = '+tostring(totalProfit)     ,
//   color=totalProfit>0 ? color.green : color.red,
//   textcolor=color.white,
//   style=label.style_labeldown, yloc=yloc.abovebar,
//   size=size.large)

// label.delete(l2[1])


//--------------------------------------------------
//--------------------------------------------------
if (Buytrend)
    strategy.close("short", comment = "Exit short")
    strategy.entry("long", true)
    strategy.exit("Max Loss", "long", loss = maxLoss)

//if BuySignalOut
   // strategy.close("long", comment = "Exit Long")
if (not Buytrend)
    // Enter trade and issue exit order on max loss.
    strategy.close("long", comment = "Exit Long")
    strategy.entry("short", false)
    strategy.exit("Max Loss", "short", loss = maxLoss)
//if SellSignalOut
    // Force trade exit.
    //strategy.close("short", comment = "Exit short")

//--------------------------------------------------
//--------------------------------------------------
//--------------------------------------------------