Chiến lược định lượng dựa trên trục Kamachira và dải Bollinger

1
Follow
1782
Followers
Tổng quan
Chiến lược này đầu tiên tính toán các điểm trung tâm Camachilla dựa trên giá cao nhất, giá thấp nhất và giá đóng cửa của ngày giao dịch trước đó. Sau đó, kết hợp với chỉ số Bollinger Bands để lọc giá và tạo ra tín hiệu giao dịch khi giá vượt qua các điểm trung tâm.
Nguyên tắc chiến lược
- Tính giá cao nhất, giá thấp nhất, giá đóng cửa của ngày giao dịch trước
- Tính toán trục Camachilla dựa trên công thức, bao gồm các đường ray trên H4, H3, H2, H1 và đường ray dưới L1, L2, L3 và L4
- Đánh giá ngày 20 Brin lên và xuống đường ray
- Khi giá lên, bạn làm nhiều, khi giá xuống, bạn làm ít.
- Điểm dừng là gần đường ray trên hoặc dưới đường ray của Brin
Phân tích lợi thế
- Trục Camachilla chứa nhiều điểm kháng cự hỗ trợ quan trọng, tăng cường độ tin cậy của tín hiệu giao dịch
- Kết hợp với chỉ số Brin, có thể lọc hiệu quả các đột phá giả
- Giao dịch linh hoạt
Phân tích rủi ro
- Thiết lập không đúng các tham số chỉ số BRI có thể dẫn đến lỗi tín hiệu giao dịch
- Tính toán điểm quan trọng của trục Camachilla phụ thuộc vào giá của ngày giao dịch trước đó, có thể bị ảnh hưởng bởi việc nhảy qua đêm
- Hoạt động nhiều đầu không đầu có nguy cơ thua lỗ
Hướng tối ưu hóa
- Tối ưu hóa các tham số của vòng Boolean để tìm các tham số kết hợp tốt nhất
- Kết hợp các chỉ số khác để lọc tín hiệu đột phá giả
- Tăng chiến lược dừng lỗ, giảm tổn thất đơn
Tóm tắt
Chiến lược này sử dụng tổng hợp các chỉ số Camachilla Axis và Bollinger Bands để tạo ra tín hiệu giao dịch khi giá vượt qua ngưỡng kháng cự hỗ trợ quan trọng. Lợi nhuận và sự ổn định của chiến lược có thể được cải thiện thông qua việc tối ưu hóa tham số và lọc tín hiệu. Nhìn chung, chiến lược giao dịch có ý tưởng rõ ràng, có thể hoạt động và đáng để kiểm tra thực tế.
Source
Pine
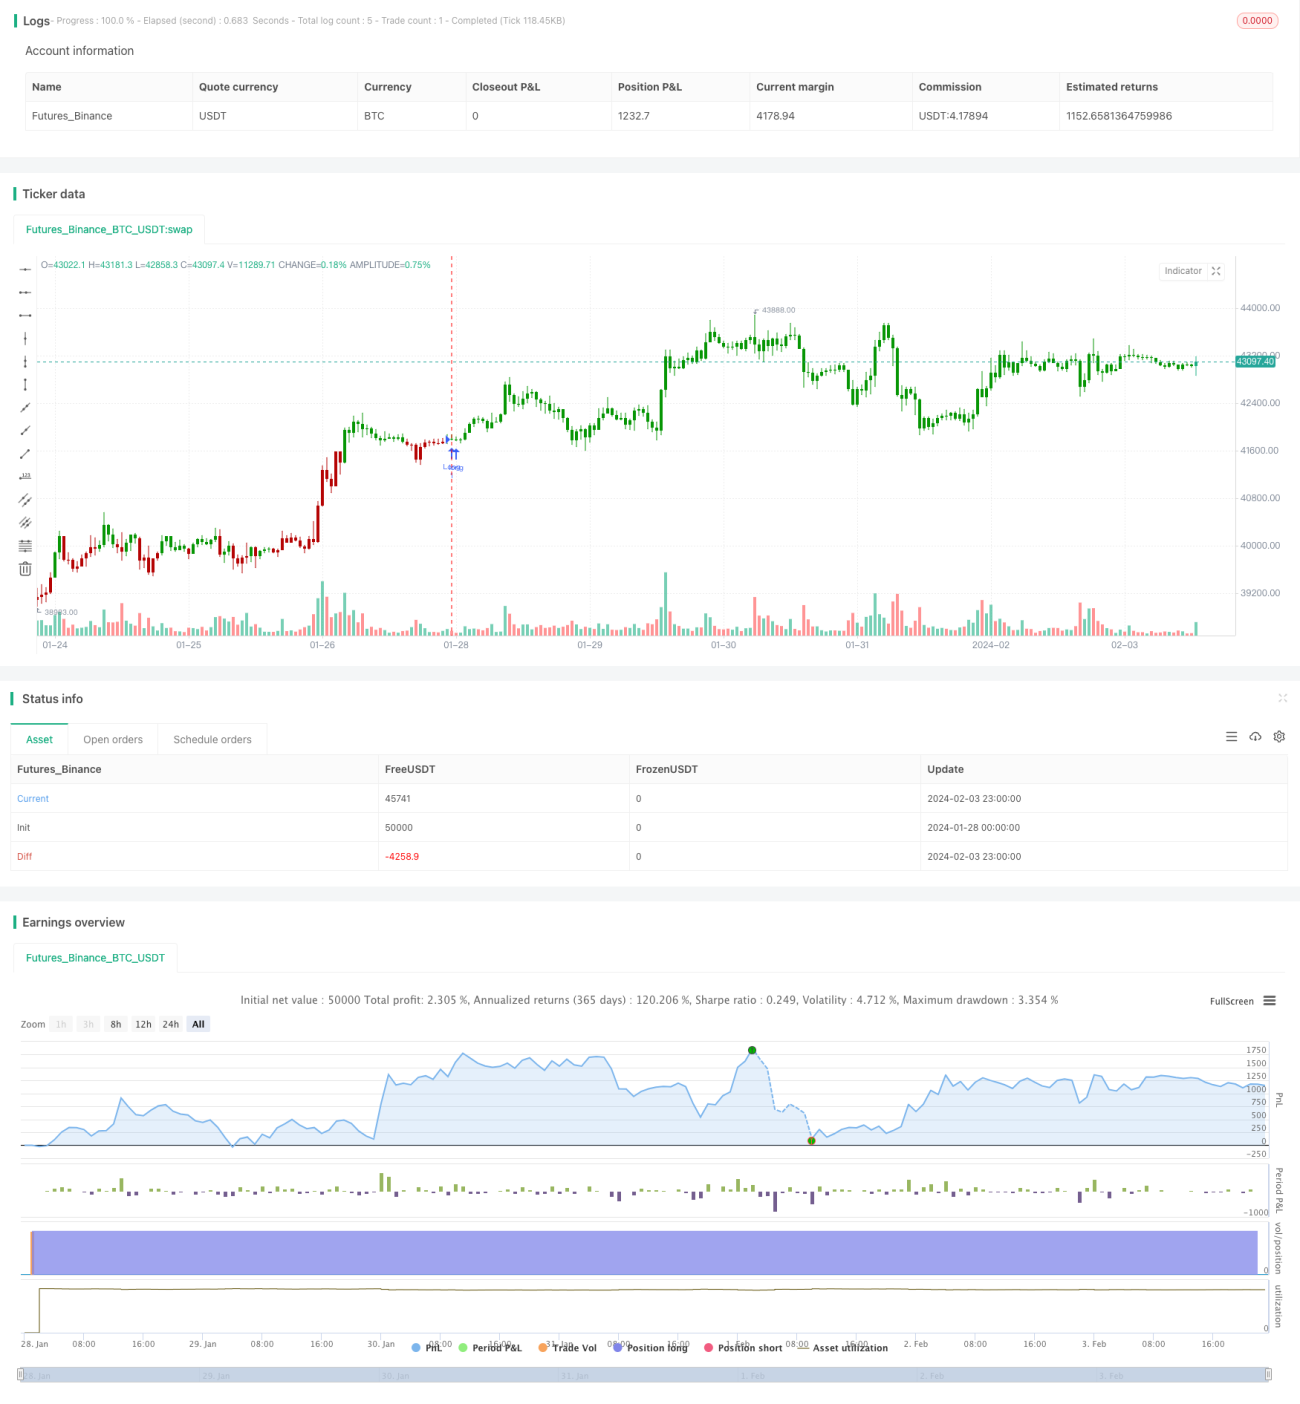
/*backtest
start: 2024-01-28 00:00:00
end: 2024-02-04 00:00:00
period: 1h
basePeriod: 15m
exchanges: [{"eid":"Futures_Binance","currency":"BTC_USDT"}]
*/

//@version=4
////////////////////////////////////////////////////////////
//  Copyright by HPotter v1.0 12/05/2020
// Camarilla pivot point formula is the refined form of existing classic pivot point formula. Strategy parameters
Related strategies
Comment
All comments (0)
No data
- 1