Chiến lược giao dịch định lượng Bitcoin dựa trên siêu xu hướng
Tổng quan
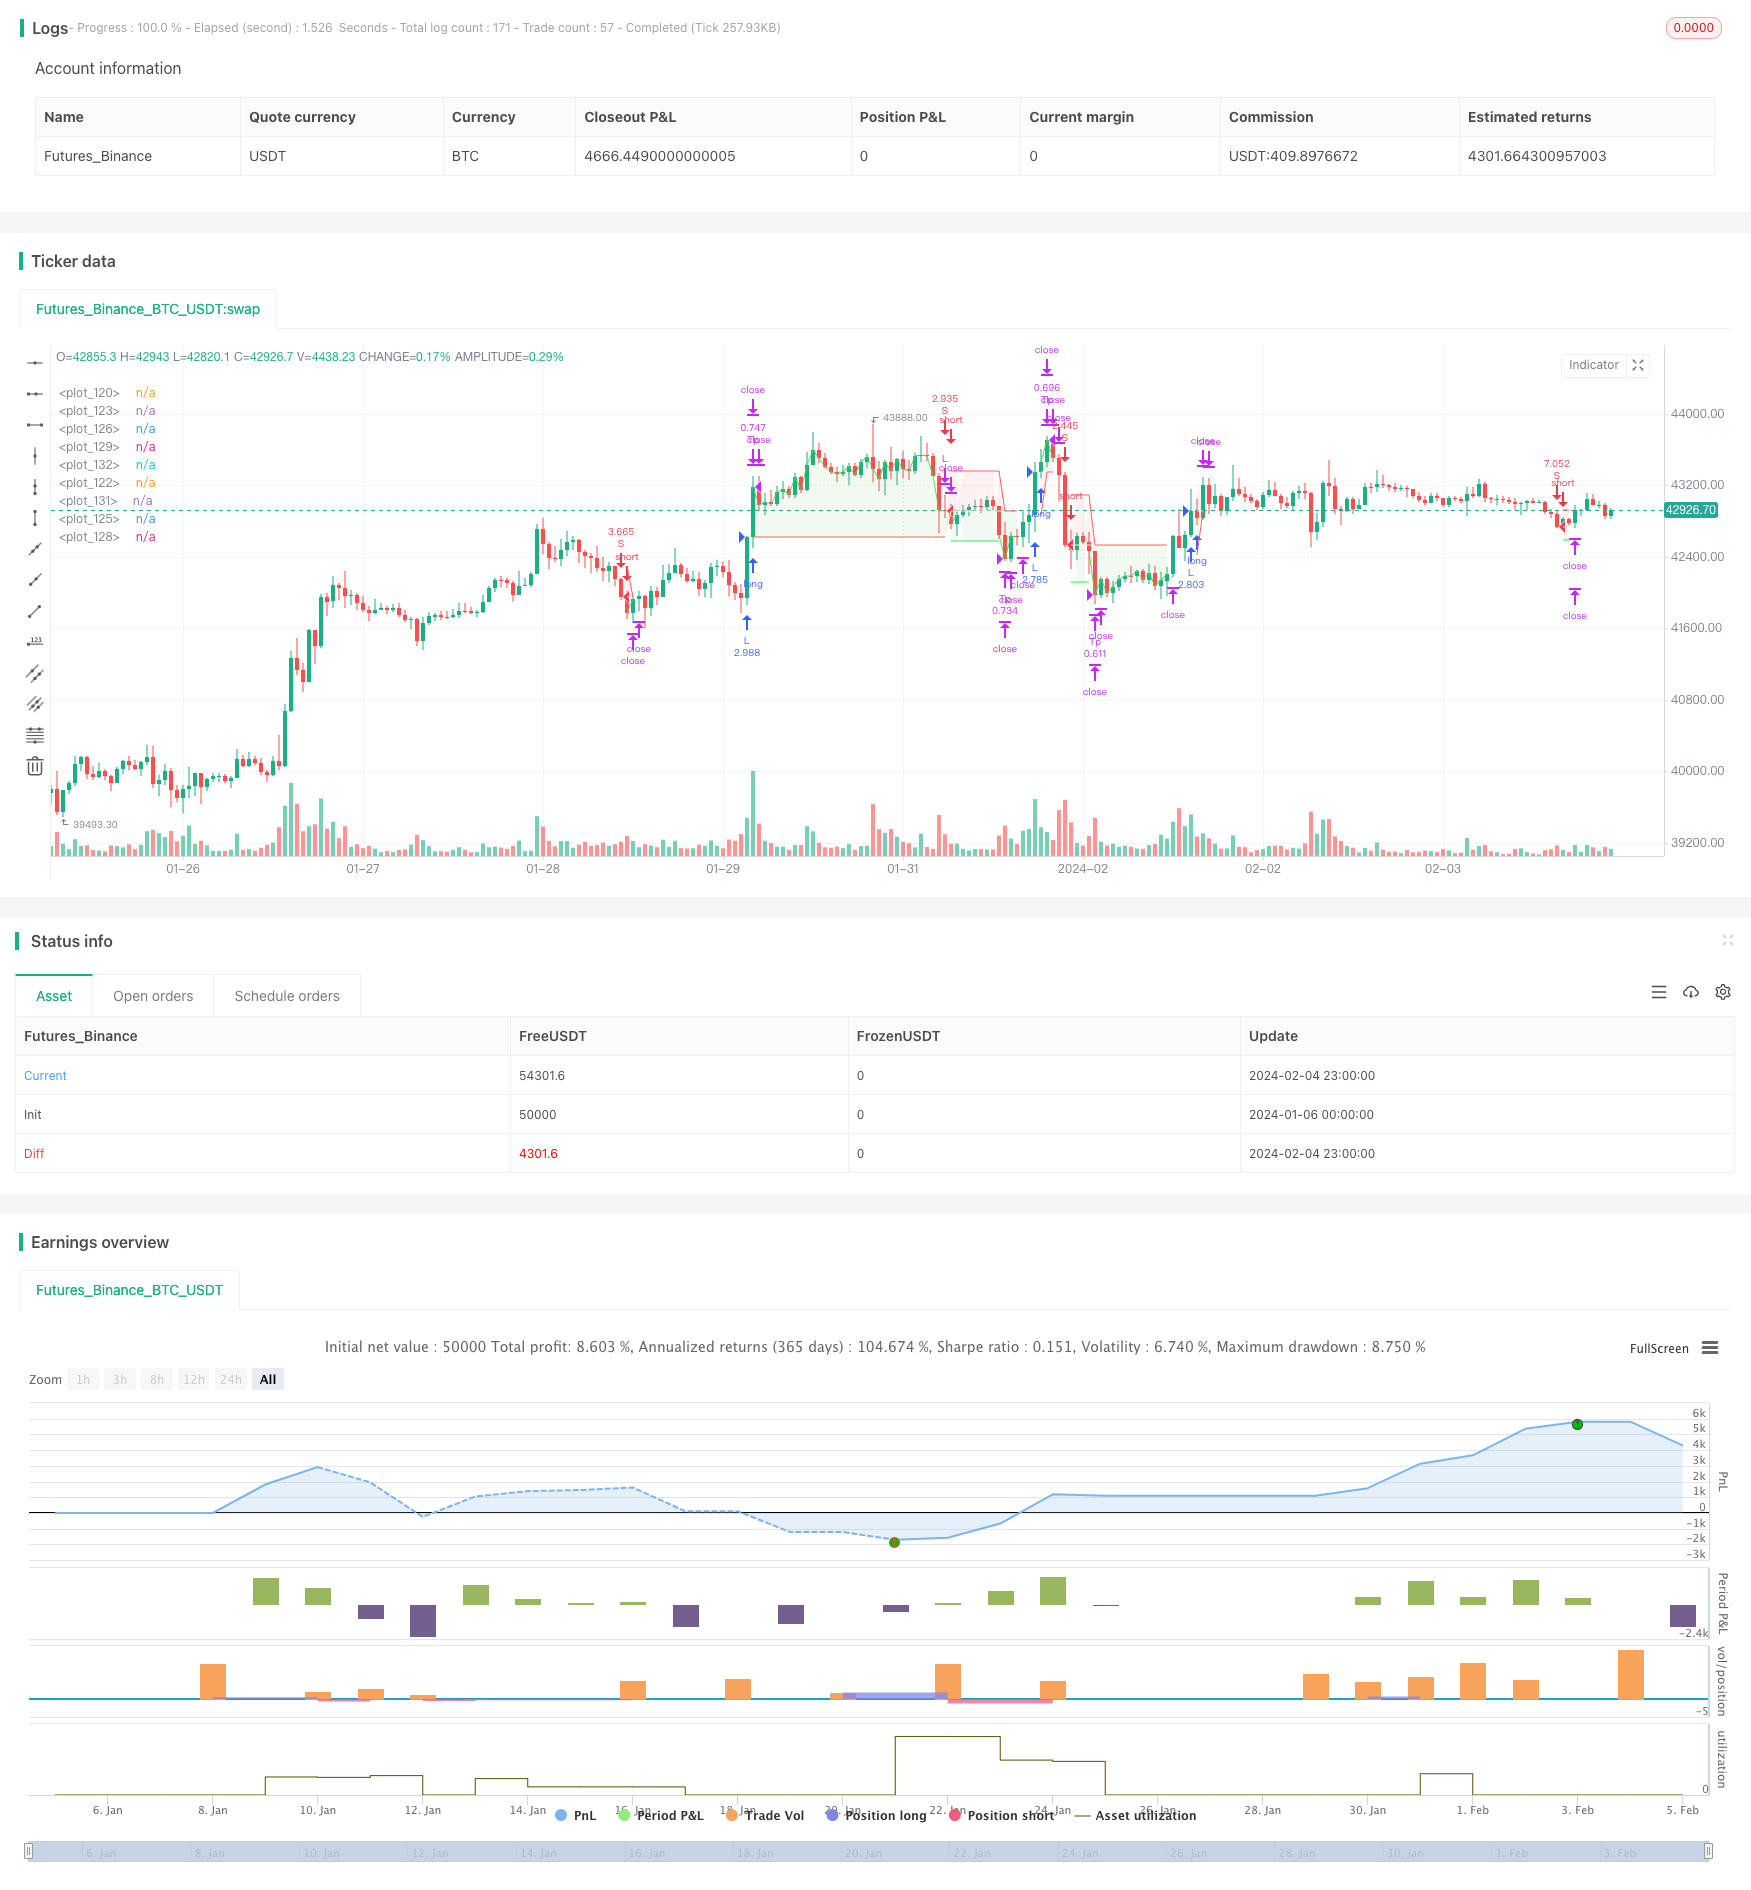
Chiến lược này là một chiến lược giao dịch Bitcoin tự động định lượng dựa trên các chỉ số siêu xu hướng. Nó sử dụng các chỉ số siêu xu hướng để đánh giá xu hướng thị trường, kết hợp với ATR để kiểm soát rủi ro, để thực hiện giao dịch hai chiều dài.
Nguyên tắc chiến lược
Chiến lược này sử dụng các chỉ số xu hướng siêu để xác định xu hướng thị trường. Khi các chỉ số xu hướng siêu chuyển từ xu hướng giảm sang xu hướng tăng, hãy tham gia nhiều đầu; Khi các chỉ số xu hướng siêu chuyển từ xu hướng tăng sang xu hướng giảm, hãy tham gia ngắn.
Cụ thể, chiến lược này đầu tiên tính toán chiều dài của chỉ số ATR là 14 chu kỳ, xác định khoảng cách dừng của mỗi đơn vị bằng cách nhân với một ATR Stop Loss Multiple (ví dụ: 1,5 lần). Sau đó, tính toán chỉ số siêu xu hướng, tham số chỉ số sử dụng giá trị mặc định ((chu kỳ ATR 9, hệ số siêu xu hướng 2.5)).
Sau khi vào cửa, điểm dừng bị cố định trên hoặc dưới mức dừng ATR. Điểm dừng đầu tiên được tính theo tỷ lệ rủi ro / lợi nhuận, mặc định là 0,75, tức là khoảng cách dừng là 0,75 lần khoảng cách dừng. Khi giá đạt đến điểm dừng đầu tiên, hãy bán 50% vị trí và di chuyển điểm dừng đến mức giá mở cửa (sau khi đạt được lợi nhuận), để vị trí này đạt được lợi nhuận.
Do đó, chiến lược này có thể đảm bảo lợi nhuận bằng cách ngăn chặn một phần, trong khi đảm bảo rủi ro dừng lỗ có thể kiểm soát được, phù hợp với chiến lược đầu tư nắm giữ dài hạn.
Phân tích lợi thế
Lợi thế lớn nhất của chiến lược này là tỷ lệ lợi nhuận rủi ro tốt, có thể được giữ trong trung và dài hạn. Những lợi thế cụ thể là:
Sử dụng xu hướng siêu để đánh giá xu hướng thị trường, lọc tiếng ồn thị trường, tránh bỏ lỡ xu hướng chính.
ATR theo dõi động dừng lỗ, kiểm soát đáng tin cậy tổn thất đơn lẻ.
Một số phương pháp ngăn chặn khóa lợi nhuận, rủi ro có lợi nhuận cao hơn.
Khi giá đạt điểm dừng 1, điều chỉnh điểm dừng để mở vị trí, đảm bảo lợi nhuận và tăng cường sự ổn định của chiến lược.
Logic giao dịch cực kỳ đơn giản, dễ hiểu thực hiện, có nhiều tham số điều chỉnh.
Có thể áp dụng cho dữ liệu trong ngày hoặc tần số cao của các sàn giao dịch chính, linh hoạt.
Phân tích rủi ro
Chiến lược này cũng có một số rủi ro, chủ yếu tập trung vào các khía cạnh sau:
Các sự kiện bất ngờ của thị trường gây ra khoảng trống hoặc nhảy vọt, không thể dừng lỗ, phải đối mặt với tổn thất lớn. Bạn có thể giảm rủi ro bằng cách điều chỉnh hợp lý hệ số dừng lỗ ATR.
Các chỉ số siêu xu hướng đã bị đánh giá không đúng, gây ra lỗi tín hiệu giao dịch. ATR và các tham số siêu xu hướng có thể được điều chỉnh thích hợp để tối ưu hóa.
Một số tỷ lệ thế chấp được thiết lập quá cao để không có đủ lợi nhuận theo xu hướng. Một số tỷ lệ thế chấp nên được điều chỉnh theo thị trường khác nhau.
Tần suất giao dịch có thể quá cao hoặc quá thấp. Các tham số siêu xu hướng nên được điều chỉnh để tìm sự cân bằng tối ưu.
Hướng tối ưu hóa
Có rất nhiều khả năng để tối ưu hóa chiến lược này, chủ yếu tập trung vào các khía cạnh sau:
Thử các phương thức dừng lỗ khác nhau của ATR, chẳng hạn như ATR tiêu chuẩn, dừng động lực, dừng dây chuyền Brin để tối ưu hóa chiến lược dừng lỗ.
Kiểm tra các chỉ số siêu xu hướng với các tham số khác nhau để tìm ra các tham số tốt nhất. Có thể sử dụng tối ưu hóa từng bước hoặc thuật toán di truyền để tối ưu hóa tham số đa chiều.
Cố gắng xếp lớp thứ hai của các chỉ số dừng, chẳng hạn như kênh Donchian, lên trên dừng để làm cho dừng đáng tin cậy hơn.
Kiểm tra các tỷ lệ cân bằng phần khác nhau để tìm kiếm sự cân bằng tối ưu giữa lợi nhuận và rủi ro.
Khám phá các chiến lược dựa trên học máy như dừng động, điều chỉnh vị trí động.
Tóm tắt
Chiến lược này là một chiến lược định lượng dựa trên xu hướng đánh giá xu hướng siêu xu hướng, ATR động dừng lỗ, một phần dừng lợi nhuận. Nó có cân bằng lợi nhuận rủi ro tốt, phù hợp với giao dịch tự động. Chiến lược này có thể tối ưu hóa đáng kể các phương thức vượt trội, dừng lỗ, lợi nhuận, v.v., là chiến lược định lượng đáng để điều chỉnh và sử dụng lâu dài.
/*backtest
start: 2024-01-06 00:00:00
end: 2024-02-05 00:00:00
period: 1h
basePeriod: 15m
exchanges: [{"eid":"Futures_Binance","currency":"BTC_USDT"}]
*/

// This source code is subject to the terms of the Mozilla Public License 2.0 at https://mozilla.org/MPL/2.0/
// Developed by © StrategiesForEveryone
//@version=5

strategy("SuperTrend Strategy for BTCUSD 4H", overlay=true, process_orders_on_close = true, initial_capital = 100, default_qty_type = strategy.cash, precision = 2, slippage = 50, commission_value = 0.03, backtest_fill_limits_assumption = 50)

// ------ Date filter (obtained from ZenAndTheArtOfTrading) ---------

initial_date = input(title="Initial date", defval=timestamp("10 Feb 2014 13:30 +0000"), group="Time filter", tooltip="Enter the start date and time of the strategy")
final_date   = input(title="Final date", defval=timestamp("01 Jan 2030 19:30 +0000"), group="Time filter", tooltip="Enter the end date and time of the strategy")
dateFilter(int st, int et) => time >= st and time <= et
colorDate = input.bool(defval=false, title="Date background", tooltip = "Add color to the period of time of the strategy tester")
bgcolor(colorDate and dateFilter(initial_date, final_date) ? color.new(color.blue, transp=90) : na)

// ------------ Super Trend ----------

atrPeriod = input(9, "ATR Length SuperTrend")
factor = input.float(2.5, "Factor SuperTrend", step = 0.05)
[supertrend, direction] = ta.supertrend(factor, atrPeriod)
show_supertrend = input.bool(defval = false, title="Show supertrend ?", group = "Appearance")
bodyMiddle = plot(show_supertrend ? ((open + close) / 2) : na, display=display.none)
upTrend = plot(show_supertrend and direction < 0 ? supertrend : na, "Up Trend", color = color.green, style=plot.style_linebr)
downTrend = plot(show_supertrend and direction > 0 ? supertrend : na, "Down Trend", color = color.red, style=plot.style_linebr)
fill(bodyMiddle, upTrend, color.new(color.green, 90), fillgaps=false)
fill(bodyMiddle, downTrend, color.new(color.red, 90), fillgaps=false)

// ---------- Atr stop loss (obtained from garethyeo)

source_atr = input(close, title='Source', group = "Atr stop loss", inline = "A")
length_atr = input.int(14, minval=1, title='Period', group = "Atr stop loss" , inline = "A")
multiplier = input.float(1.5, minval=0.1, step=0.1, title='Atr multiplier', group = "Atr stop loss", inline = "A", tooltip = "Defines the stop loss distance based on the Atr stop loss indicator")
shortStopLoss = source_atr + ta.atr(length_atr) * multiplier
longStopLoss = source_atr - ta.atr(length_atr) * multiplier
show_atr_stoploss = input.bool(defval=false, title="Show Atr stop loss ?", group = "Appearance")
plot(show_atr_stoploss ? longStopLoss : na, color=color.white, style = plot.style_circles)
plot(show_atr_stoploss ? shortStopLoss : na, color=color.white, style = plot.style_circles)

// ------------- Money management --------------

strategy_contracts = strategy.equity / close
distance_sl_atr_long = -1 * (longStopLoss - close) / close
distance_sl_atr_short = (shortStopLoss - close) / close
risk = input.float(2.5, '% Account risk per trade', step=1, group = "Risk management for trades", tooltip = "Percentage of total account to risk per trade")
long_amount = strategy_contracts * (risk / 100) / distance_sl_atr_long
short_amount = strategy_contracts * (risk / 100) / distance_sl_atr_short

// ---------- Risk management ---------------

risk_reward_breakeven_long= input.float(title="Risk/reward for breakeven long", defval=0.75, step=0.05, group = "Risk management for trades")
risk_reward_take_profit_long= input.float(title="Risk/reward for take profit long", defval=0.75, step=0.05, group = "Risk management for trades")
risk_reward_breakeven_short= input.float(title="Risk/reward for break even short", defval=0.75, step=0.05, group = "Risk management for trades")
risk_reward_take_profit_short= input.float(title="Risk/reward for take profit short", defval=0.75, step=0.05, group = "Risk management for trades")
tp_percent=input.float(title="% of trade for first take profit", defval=50, step=5, group = "Risk management for trades", tooltip = "Closing percentage of the current position when the first take profit is reached.")

// ------------ Trade conditions ---------------

bought = strategy.position_size > 0
sold = strategy.position_size < 0
long_supertrend=ta.crossover(close, supertrend)
short_supertrend=ta.crossunder(close, supertrend)
var float sl_long = na
var float sl_short = na
var float be_long = na
var float be_short = na
var float tp_long = na
var float tp_short = na
if not bought
    sl_long:=na
if not sold
    sl_short:=na

// ---------- Strategy -----------

// Long position

if not bought and long_supertrend
    sl_long:=longStopLoss
    long_stoploss_distance = close - longStopLoss
    be_long := close + long_stoploss_distance * risk_reward_breakeven_long
    tp_long:=close+(long_stoploss_distance*risk_reward_take_profit_long)
    strategy.entry('L', strategy.long, long_amount, alert_message = "Long")
    strategy.exit("Tp", "L", stop=sl_long, limit=tp_long, qty_percent=tp_percent)
    strategy.exit('Exit', 'L', stop=sl_long)
if high > be_long
    sl_long := strategy.position_avg_price
    strategy.exit("Tp", "L", stop=sl_long, limit=tp_long, qty_percent=tp_percent)
    strategy.exit('Exit', 'L', stop=sl_long)
if bought and short_supertrend
    strategy.close("L", comment="CL")

// Short position

if not sold and short_supertrend
    sl_short:=shortStopLoss
    short_stoploss_distance=shortStopLoss - close
    be_short:=((short_stoploss_distance*risk_reward_breakeven_short)-close)*-1
    tp_short:=((short_stoploss_distance*risk_reward_take_profit_short)-close)*-1
    strategy.entry("S", strategy.short, short_amount, alert_message = "Short")
    strategy.exit("Tp", "S", stop=sl_short, limit=tp_short, qty_percent=tp_percent)
    strategy.exit("Exit", "S", stop=sl_short)
if low < be_short
    sl_short:=strategy.position_avg_price
    strategy.exit("Tp", "S", stop=sl_short, limit=tp_short, qty_percent=tp_percent)
    strategy.exit("Exit", "S", stop=sl_short)
if sold and long_supertrend
    strategy.close("S", comment="CS")

// ---------- Draw position on chart -------------

if high>tp_long
    tp_long:=na
if low<tp_short
    tp_short:=na
if high>be_long
    be_long:=na
if low<be_short
    be_short:=na

show_position_on_chart = input.bool(defval=true, title="Draw position on chart ?", group = "Appearance", tooltip = "Activate to graphically display profit, stop loss and break even")
position_price = plot(show_position_on_chart? strategy.position_avg_price : na, style=plot.style_linebr, color = color.new(#ffffff, 10), linewidth = 1)

sl_long_price = plot(show_position_on_chart and bought ? sl_long : na, style = plot.style_linebr, color = color.new(color.red, 10), linewidth = 1)
sl_short_price = plot(show_position_on_chart and sold ? sl_short : na, style = plot.style_linebr, color = color.new(color.red, 10), linewidth = 1)

tp_long_price = plot(strategy.position_size>0 and show_position_on_chart? tp_long : na, style = plot.style_linebr, color = color.new(#11eb47, 10), linewidth = 1)
tp_short_price = plot(strategy.position_size<0 and show_position_on_chart? tp_short : na, style = plot.style_linebr, color = color.new(#11eb47, 10), linewidth = 1)

breakeven_long = plot(strategy.position_size>0 and high<be_long and show_position_on_chart ? be_long : na , style = plot.style_linebr, color = color.new(#00ff40, 60), linewidth = 1)
breakeven_short = plot(strategy.position_size<0 and low>be_short and show_position_on_chart ? be_short : na , style = plot.style_linebr, color = color.new(#00ff40, 60), linewidth = 1)

position_profit_long = plot(bought and show_position_on_chart and strategy.openprofit>0 ? close : na, style = plot.style_linebr, color = color.new(#4cd350, 10), linewidth = 1)
position_profit_short = plot(sold and show_position_on_chart and strategy.openprofit>0 ? close : na, style = plot.style_linebr, color = color.new(#4cd350, 10), linewidth = 1)

fill(plot1 = position_price, plot2 = position_profit_long, color = color.new(color.green,90))
fill(plot1 = position_price, plot2 = position_profit_short, color = color.new(color.green,90))

fill(plot1 = position_price, plot2 = sl_long_price, color = color.new(color.red,90))
fill(plot1 = position_price, plot2 = sl_short_price, color = color.new(color.red,90))

fill(plot1 = position_price, plot2 = tp_long_price, color = color.new(color.green,90))
fill(plot1 = position_price, plot2 = tp_short_price, color = color.new(color.green,90))