Chiến lược dừng lỗ theo xu hướng siêu tốc dựa trên Heikin Ashi
Ngày tạo:
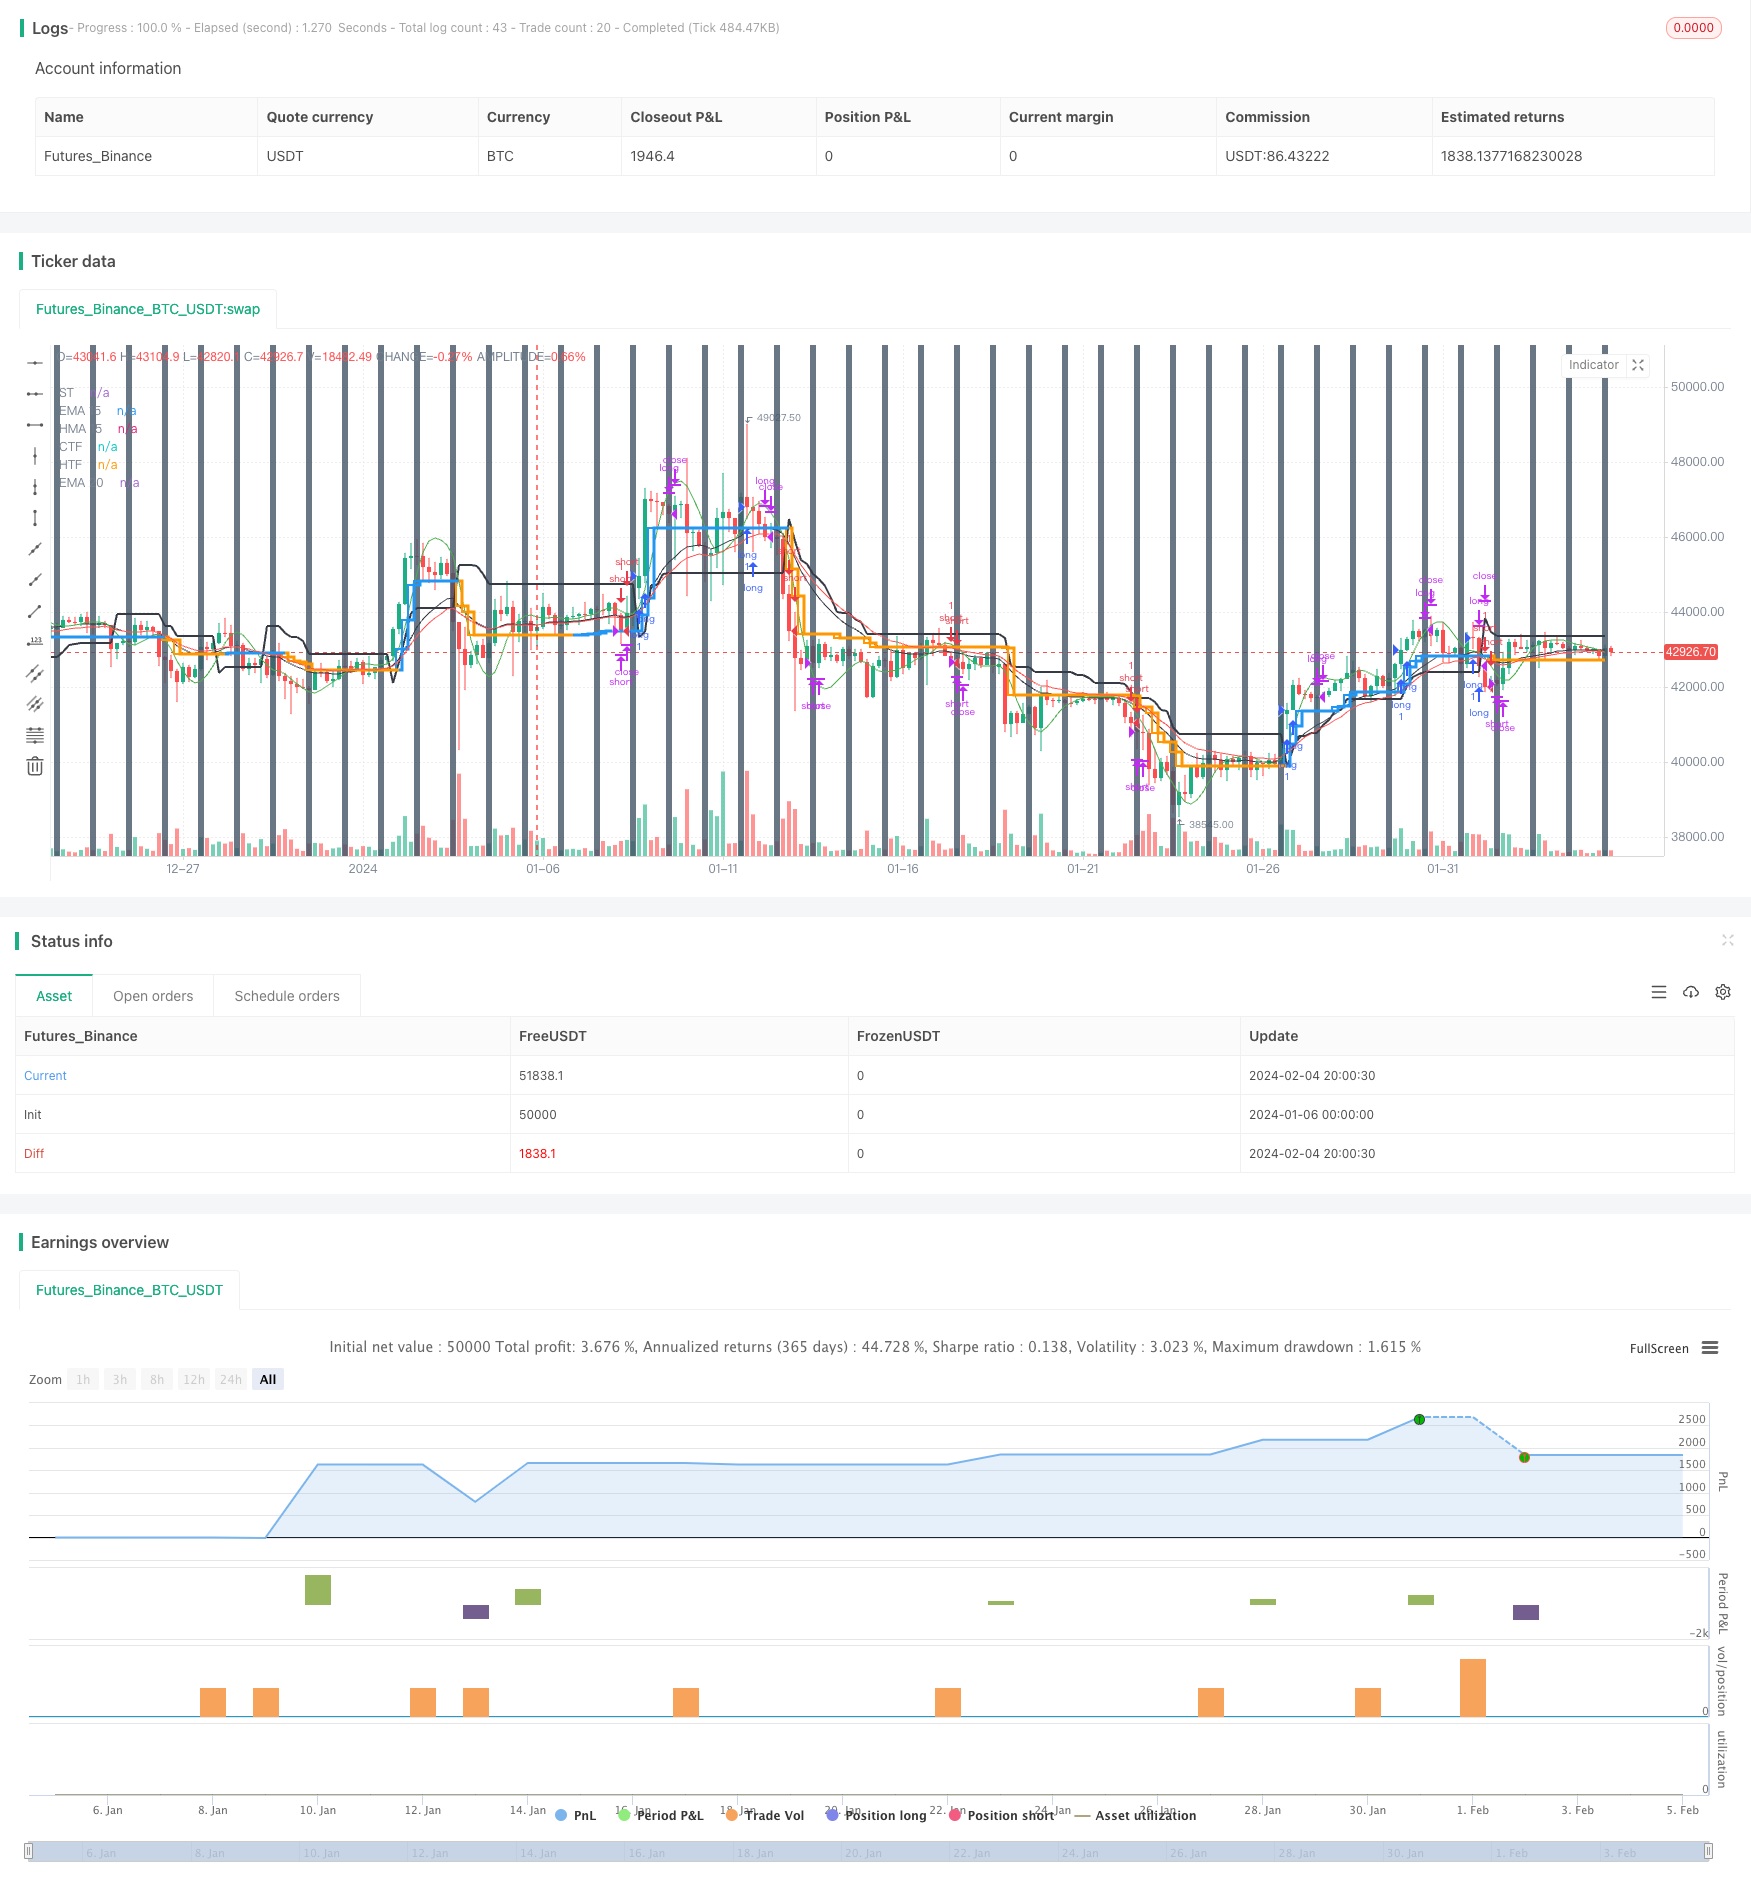
2024-02-06 14:43:14
sửa đổi lần cuối:
2024-02-06 14:43:14
sao chép:
5
Số nhấp chuột:
1231
1
tập trung vào
1750
Người theo dõi
Tổng quan về chiến lược
Chiến lược này là một chiến lược theo dõi xu hướng kết hợp với đường Heikin Ashi và các chỉ số xu hướng siêu. Nó sử dụng đường Heikin Ashi để lọc tiếng ồn thị trường, các chỉ số xu hướng siêu để đánh giá xu hướng và sử dụng xu hướng siêu như một đường dừng động để theo dõi xu hướng hiệu quả và kiểm soát rủi ro.
Nguyên tắc chiến lược
- Tính toán đường Heikin Ashi: bao gồm giá mở, giá đóng, giá cao nhất, giá thấp nhất.
- Tính toán chỉ số siêu xu hướng: tính trên và dưới đường ray dựa trên ATR và giá cả.
- Phương pháp này được sử dụng để xác định xu hướng của một xu hướng, kết hợp với đường dây Heikin Ashi và siêu xu hướng.
- Xu hướng giảm khi giá đóng cửa của Heikin Ashi gần đường đi của xu hướng siêu so với giá đóng cửa của một đường K trước đó. Xu hướng giảm khi giá đóng cửa của Heikin Ashi gần đường đi của xu hướng siêu so với giá đóng cửa của một đường K trước đó.
- Trong xu hướng giảm giá, theo dõi đường dừng với đường theo dõi xu hướng siêu; trong xu hướng giảm giá, theo dõi đường dừng với đường theo dõi xu hướng siêu.
Lợi thế chiến lược
- Sử dụng bộ lọc Heikin Ashi để phá vỡ giả mạo và nhận ra tín hiệu xu hướng một cách đáng tin cậy hơn.
- Siêu xu hướng hoạt động như một động lực dừng lỗ, tối đa hóa lợi nhuận của xu hướng và tránh rút lui quá lớn.
- Kết hợp với các chu kỳ thời gian khác nhau để xác định độ trống, xác nhận tín hiệu cao thấp là đáng tin cậy hơn.
- Chế độ thanh toán theo thời gian tránh ảnh hưởng của hành vi phi lý tại một thời điểm nhất định.
Rủi ro chiến lược
- Đường dừng có thể được nới lỏng thích hợp để giảm nguy cơ này.
- Thiết lập tham số siêu xu hướng không đúng có thể dẫn đến dừng quá rộng hoặc quá hẹp. Các kết hợp tham số khác nhau có thể được thử nghiệm.
- Không xem xét các vấn đề quản lý tài chính.
- Không tính chi phí giao dịch.
Hướng tối ưu hóa chiến lược
- Tối ưu hóa các tham số siêu xu hướng để tìm tham số tối ưu.
- Thêm chức năng kiểm soát vị trí.
- Thêm các yếu tố chi phí, chẳng hạn như phí xử lý, điểm trượt.
- Lượng dừng lỗ có thể được điều chỉnh theo xu hướng.
- Xem xét các chỉ số khác để lọc tín hiệu vào sân.
Tóm tắt
Chiến lược này tích hợp các ưu điểm của hai chỉ số Heikin Ashi và siêu xu hướng, có thể nắm bắt hướng xu hướng, đồng thời sử dụng siêu xu hướng để thực hiện tự động hóa theo dõi động, do đó khóa lợi nhuận xu hướng. Rủi ro của chiến lược chủ yếu đến từ đảo ngược xu hướng và tối ưu hóa tham số, cả hai khía cạnh này có thể được cải thiện bằng cách tối ưu hóa hơn nữa.
Mã nguồn chiến lược
/*backtest
start: 2024-01-06 00:00:00
end: 2024-02-05 00:00:00
period: 4h
basePeriod: 15m
exchanges: [{"eid":"Futures_Binance","currency":"BTC_USDT"}]
*/

// This source code is subject to the terms of the Mozilla Public License 2.0 at https://mozilla.org/MPL/2.0/
// © ringashish

//@version=4
strategy("sa-strategy with HTF-TSL", overlay=true)


Pd = input(title="ATR Period", type=input.integer, defval=4)
Factor = input(title="ATR Multiplier", type=input.float, step=0.1, defval=2)
ST= supertrend(Factor, Pd)

heikinashi_close = security(heikinashi(syminfo.tickerid), timeframe.period, close)
heikinashi_low = security(heikinashi(syminfo.tickerid), timeframe.period, low)
heikinashi_open = security(heikinashi(syminfo.tickerid), timeframe.period, open)
heikinashi_high = security(heikinashi(syminfo.tickerid), timeframe.period, high)

heikinashi_close30 = security(heikinashi(syminfo.tickerid), "30", close)
//res1 = input("30", type=input.resolution, title="higher Timeframe")


//CCI TSL

res = input("240",type=input.resolution,title = "Higher Time Frame")
CCI = input(20)
ATR = input(5)
Multiplier=input(1,title='ATR Multiplier')
original=input(false,title='original coloring')
thisCCI = cci(close, CCI)
lastCCI = nz(thisCCI[1])


calcx()=>
    bufferDn= high + Multiplier * sma(tr,ATR)
    bufferUp= low - Multiplier * sma(tr,ATR)
    if (thisCCI >= 0 and lastCCI < 0)
        bufferUp := bufferDn[1]
    if (thisCCI <= 0 and lastCCI > 0)
        bufferDn := bufferUp[1]

    if (thisCCI >= 0)
        if (bufferUp < bufferUp[1])
            bufferUp := bufferUp[1]
    else
        if (thisCCI <= 0)
            if (bufferDn > bufferDn[1])
                bufferDn := bufferDn[1]


    x = 0.0
    x := thisCCI >= 0 ?bufferUp:thisCCI <= 0 ?bufferDn:x[1]
    x

tempx = calcx()

calcswap() =>
    swap = 0.0
    swap := tempx>tempx[1]?1:tempx<tempx[1]?-1:swap[1]
    swap

tempswap = calcswap()

swap2=tempswap==1?color.blue:color.orange
swap3=thisCCI >=0 ?color.blue:color.orange
swap4=original?swap3:swap2

//display current timeframe's Trend

plot(tempx,"CTF",color=swap4,transp=0,linewidth=2, style = plot.style_stepline)


htfx = security(syminfo.tickerid,res,tempx[1],lookahead = barmerge.lookahead_on)
htfswap4 = security(syminfo.tickerid,res,swap4[1],lookahead = barmerge.lookahead_on)

plot(htfx,"HTF",color=htfswap4,transp=0,linewidth=3,style = plot.style_stepline)


//supertrend
Supertrend(Factor, Pd) =>
    Up=hl2-(Factor*atr(Pd))
    Dn=hl2+(Factor*atr(Pd))

    TrendUp = 0.0
    TrendUp := heikinashi_close[1]>TrendUp[1] ? max(Up,TrendUp[1]) : Up
    TrendDown = 0.0
    TrendDown := heikinashi_close[1]<TrendDown[1]? min(Dn,TrendDown[1]) : Dn
    Trend = 0.0
    Trend := heikinashi_close > TrendDown[1] ? 1: heikinashi_close< TrendUp[1]? -1: nz(Trend[1],1)
    Tsl = Trend==1? TrendUp: TrendDown

    S_Buy = Trend == 1 ? 1 : 0
    S_Sell = Trend != 1 ? 1 : 0

    [Trend, Tsl]

[Trend,Tsl] = Supertrend(Factor, Pd)
// Security
//ST1_Trend_MTF = security(syminfo.tickerid, res1, Tsl,barmerge.lookahead_on)
//plot(ST1_Trend_MTF, "higher ST")

crossdn = crossunder(heikinashi_close,Tsl) or crossunder(heikinashi_close[1],Tsl) or crossunder(heikinashi_close[2],Tsl) or heikinashi_close < Tsl
crossup = crossover(heikinashi_close,Tsl) or crossover(heikinashi_close[1],Tsl) or crossover(heikinashi_close[2],Tsl) or heikinashi_close > Tsl
plot(Tsl,"ST",color = color.black,linewidth =2)
plot(ema(heikinashi_close,20),"EMA 20",color=color.red)
plot(hma(heikinashi_close,15),"HMA 15",color=color.green)
plot(ema(heikinashi_close,15),"EMA 15",color=color.black)

closedown = (heikinashi_close < hma(heikinashi_close,15) and heikinashi_high > hma(heikinashi_close,15)) or(heikinashi_close < ema(heikinashi_close,20) and heikinashi_high > ema(heikinashi_close,20))
closeup = (heikinashi_close > hma(heikinashi_close,15) and heikinashi_low < hma(heikinashi_close,15)) or (heikinashi_close > ema(heikinashi_close,20) and heikinashi_low < ema(heikinashi_close,20))

buy = heikinashi_open == heikinashi_low and closeup and crossup  and close > htfx
//buy = heikinashi_open == heikinashi_low and heikinashi_close > ema(close,20) and heikinashi_low < ema(close,20) and crossup
buyexit = cross(close,tempx) //heikinashi_open == heikinashi_high //and heikinashi_close < ema(close,15) and heikinashi_high > ema(close,15)

//if heikinashi_close30[1] < ST1_Trend_MTF
//sell = heikinashi_open == heikinashi_high and heikinashi_close < ema(close,20) and heikinashi_high > ema(close,20) and rsi(close,14)<60 and crossdn
sell = heikinashi_open == heikinashi_high and closedown and rsi(close,14)<55 and crossdn  and close < htfx
sellexit = cross(close,tempx) //heikinashi_open == heikinashi_low //and heikinashi_close > ema(close,15) and heikinashi_low < ema(close,15)

rg = 0
rg := buy ? 1 : buyexit ? 2 : nz(rg[1])

longLogic = rg != rg[1] and rg == 1
longExit = rg != rg[1] and rg == 2

//plotshape(longExit,"exit buy",style = shape.arrowup,location = location.belowbar,color = color.red, text ="buy exit", textcolor = color.red)
//plotshape(longLogic,"BUY",style = shape.arrowup,location = location.belowbar,color = color.green, text ="buy", textcolor= color.green)

nm = 0
nm := sell ? 1 : sellexit ? 2 : nz(nm[1])

shortLogic = nm != nm[1] and nm == 1
shortExit = nm != nm[1] and nm == 2

//plotshape(shortExit,"exit sell",style = shape.arrowup,location = location.belowbar,color = color.red, text ="sell exit", textcolor = color.red)
//plotshape(shortLogic,"SELL",style = shape.arrowup,location = location.belowbar,color = color.green, text ="sell", textcolor= color.green)


//Exit at particular time

ExitHour = input(title="Exit Hour Of Day", type=input.integer, defval=15, step = 5, maxval = 24, minval = 0)
ExitMint = input(title="Exit Minute Of Day", type=input.integer, defval=15, step = 5, maxval = 24, minval = 0)
bgc = input(title="Highlight Background Color?", type=input.bool, defval=true)
mRound(num,rem) => (floor(num/rem)*rem)
exitTime = (hour(time) >= ExitHour and (minute == mRound(ExitMint, timeframe.multiplier))) ? 1 : 0
exitTime := exitTime == 0 ? (hour(time) >= ExitHour and (minute + timeframe.multiplier >= ExitMint)) ? 1 : 0 : exitTime

MarketClose =  exitTime and not exitTime[1]

alertcondition(exitTime and not exitTime[1], title="Intraday Session Close Time", message="Close All Positions")
bgcolor(exitTime and not exitTime[1] and bgc ? #445566 : na, transp =40)


longCondition = longLogic
if (longCondition)
    strategy.entry("long", strategy.long)


shortCondition = shortLogic
if (shortCondition)
    strategy.entry("short", strategy.short)


strategy.close("short", when =cross(close,tempx)  or MarketClose)
strategy.close( "long", when =cross(close,tempx) or MarketClose )