LPB Microcycles Adaptive Oscillation Contour Tracking Chiến lược

Tác giả:ChaoZhang, Ngày: 2024-02-19 11:32:12
Tags:

img

Tổng quan

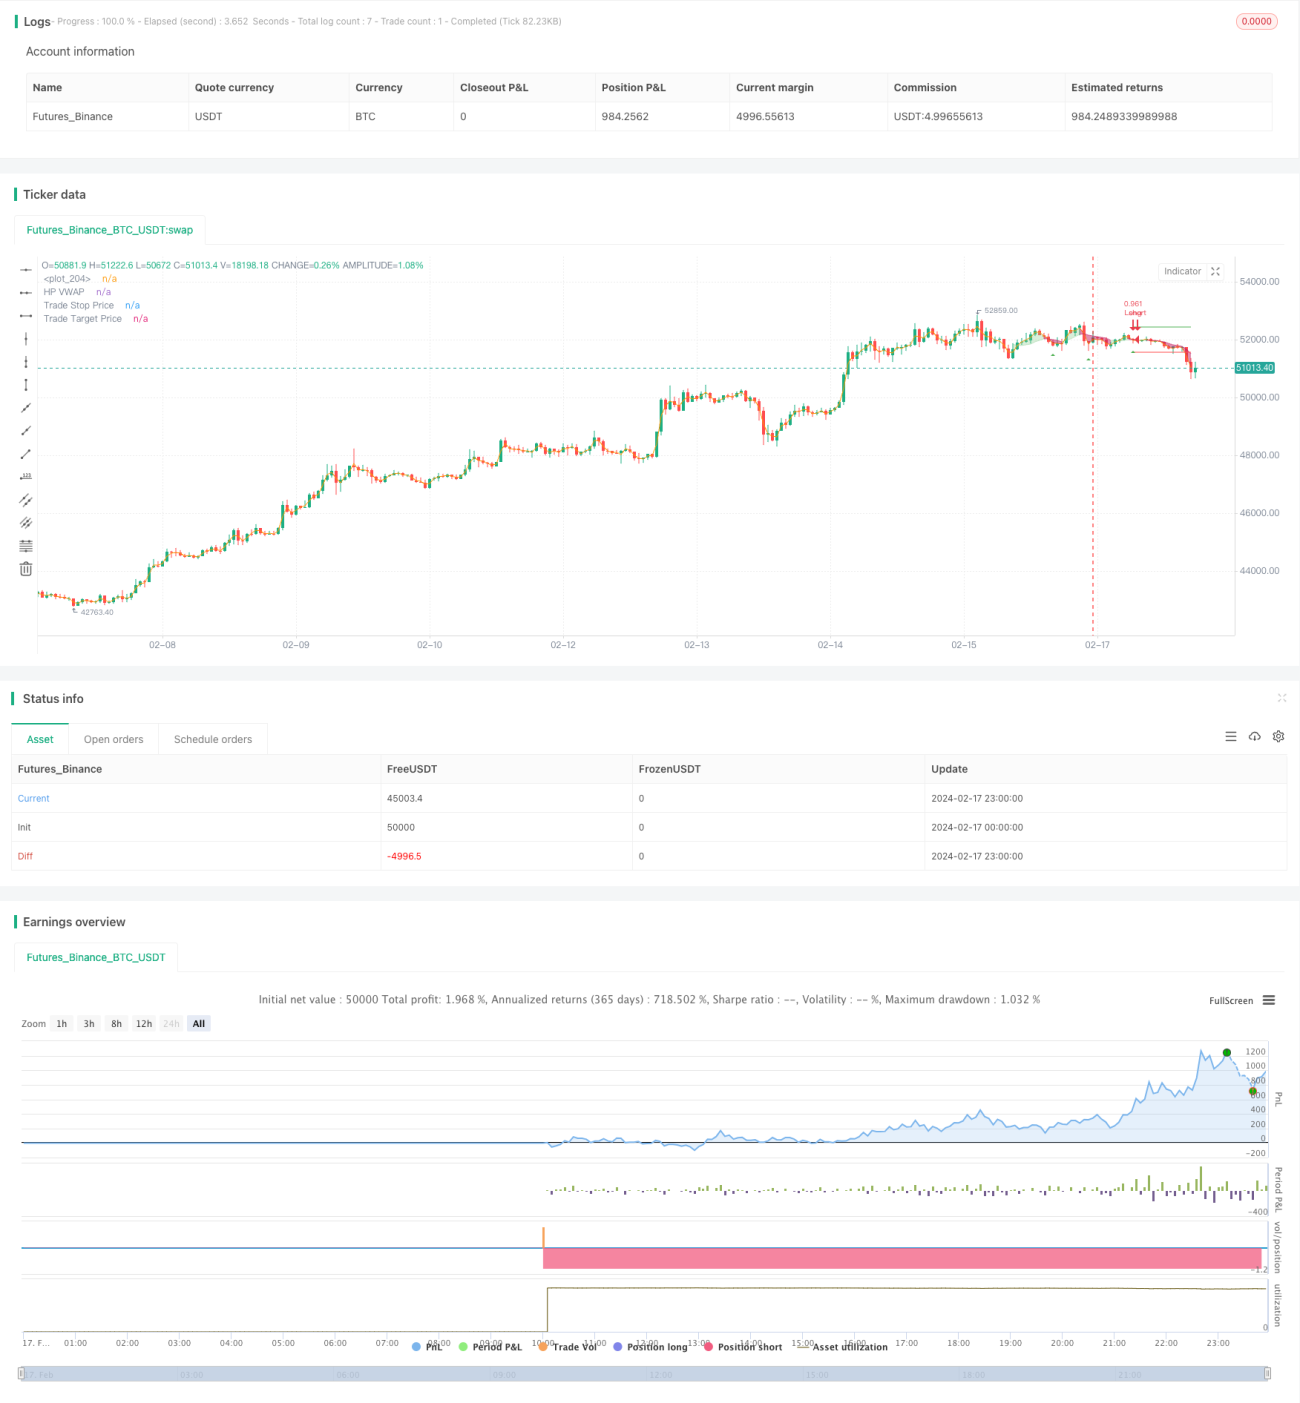
Chiến lược này sử dụng bộ lọc Hodrick-Prescott (HP) để làm mịn giá và chiết xuất xu hướng giá. Sau đó nó tính toán giá trung bình cân nhắc tùy chỉnh (VWAP) dựa trên khoảng thời gian được xác định bởi người dùng. Nó đi dài khi giá trên đường xu hướng và đi ngắn khi dưới. Nó cũng kết hợp ATR dừng lỗ để kiểm soát rủi ro giao dịch.

Nguyên tắc chiến lược

  1. Sử dụng bộ lọc HP để chiết xuất xu hướng giá. Bộ lọc HP sử dụng các phương pháp tối ưu hóa để chiết xuất thành phần xu hướng dài hạn của giá trong khi lọc các biến động ngắn hạn.

  2. Tính toán VWAP dựa trên phạm vi thời gian tùy chỉnh của người dùng.

  3. Đáp ứng điều kiện dài khi giá trên đường xu hướng HP; đáp ứng điều kiện ngắn khi giá dưới.

  4. ATR stop loss đảm nhận rủi ro hợp lý và ngăn ngừa tổn thất quá mức.

Phân tích lợi thế

  1. Bộ lọc HP trích xuất xu hướng giá mượt mà hơn các chỉ số dựa trên MA, tránh phân tâm từ biến động giá ngắn hạn.

  2. Thời gian VWAP có thể tùy chỉnh thích nghi tốt hơn với chu kỳ thị trường thay đổi.

  3. Giao dịch theo hướng xu hướng phù hợp với các khái niệm giao dịch xu hướng và có tỷ lệ thắng cao hơn.

  4. ATR dừng lỗ kiểm soát lỗ cho mỗi giao dịch, ngăn ngừa lỗ quá lớn.

  5. Các tham số có thể điều chỉnh cao cung cấp không gian tối ưu hóa lớn hơn cho các thị trường khác nhau.

Rủi ro và giải pháp

  1. Stop loss có thể bị tấn công thường xuyên trong quá trình củng cố giới hạn phạm vi. Có thể nới lỏng stop loss một chút.

  2. Việc khôi phục cuối xu hướng thường tạo ra sự đột phá sai lầm khiến chiến lược bị mắc kẹt.

  3. Các thiết lập thời gian VWAP không chính xác có thể bỏ lỡ các cơ hội giao dịch hiệu quả hơn.

Hướng dẫn tối ưu hóa

  1. HP lọc tham số λ điều chỉnh cường độ làm mịn. lớn hơn λ làm cho đường xu hướng mịn hơn và nắm bắt tốt hơn xu hướng dài hạn; nhỏ hơn λ làm cho nó đáp ứng tốt hơn với những thay đổi giá và phù hợp với cơ hội ngắn trung bình.

  2. ATR nhân điều chỉnh phạm vi dừng lỗ. Có thể phối hợp với tham số λ để tối ưu hóa. λ lớn hơn đảm bảo dừng rộng hơn; λ nhỏ hơn cho phép dừng chặt chẽ hơn và khóa trong lợi nhuận nhiều hơn.

  3. Rủi ro: Tỷ lệ phần thưởng ảnh hưởng trực tiếp đến tỷ lệ L&L. Có thể kiểm tra các tỷ lệ khác nhau để kiểm soát rút vốn và tiềm năng lợi nhuận.

Kết luận

Chiến lược tổng thể áp dụng một cách tiếp cận theo xu hướng. Điều chỉnh tham số rộng rãi nhắm mục tiêu tối ưu hóa trong các khung thời gian dài, trung bình và ngắn, với tỷ lệ thắng mạnh và tiềm năng lợi nhuận. Kiểm soát rủi ro hợp lý ngăn ngừa tổn thất quá lớn trên mỗi giao dịch. Tóm lại, bằng cách chiết xuất xu hướng giá theo cách khoa học và các tham số có thể điều chỉnh cao, chiến lược có triển vọng ứng dụng tốt.


/*backtest
start: 2024-02-17 00:00:00
end: 2024-02-18 00:00:00
period: 1h
basePeriod: 15m
exchanges: [{"eid":"Futures_Binance","currency":"BTC_USDT"}]
*/

// This source code is subject to the terms of the Mozilla Public License 2.0 at https://mozilla.org/MPL/2.0/
// © tathal animouse hajixde

//@version=4
strategy("LPB MicroCycles Strategy", "HPVWAP", overlay=true, default_qty_type=strategy.percent_of_equity, default_qty_value=100, max_bars_back=5000)
startDate = input(title="Start Date", type=input.integer,
     defval=1, minval=1, maxval=31)
startMonth = input(title="Start Month", type=input.integer,
     defval=1, minval=1, maxval=12)
startYear = input(title="Start Year", type=input.integer,
     defval=2010, minval=1800, maxval=2100)

endDate = input(title="End Date", type=input.integer,
     defval=31, minval=1, maxval=31)
endMonth = input(title="End Month", type=input.integer,
     defval=12, minval=1, maxval=12)
endYear = input(title="End Year", type=input.integer,
     defval=2021, minval=1800, maxval=2100)
     
// STEP 2:
// Look if the close time of the current bar
// falls inside the date range
inDateRange = true

///

// Strategy Settings
var g_strategy      = "Strategy Settings"
stopMultiplier      = input(title="Stop Loss ATR", type=input.float, defval=1.0, group=g_strategy, tooltip="Stop loss multiplier (x ATR)")
rr                  = input(title="R:R", type=input.float, defval=1.0, group=g_strategy, tooltip="Risk:Reward profile")

/// Backtester Settings
var g_tester        = "Backtester Settings"
startBalance        = input(title="Starting Balance", type=input.float, defval=10000.0, group=g_tester, tooltip="Your starting balance for the custom inbuilt tester system")
riskPerTrade        = input(title="Risk Per Trade", type=input.float, defval=1.0, group=g_tester, tooltip="Your desired % risk per trade (as a whole number)")
drawTester          = input(title="Draw Backtester", type=input.bool, defval=true, group=g_tester, tooltip="Turn on/off inbuilt backtester display")

////////////////INPUTS///////////////////
lambda = input(defval = 1000, type = input.float, title = "Smoothing Factor (Lambda)", minval = 1)
leng = input(defval = 100, type = input.integer, title = "Filter Length", minval = 1)
src = ohlc4
atr = atr(14)

///////////Construct Arrays///////////////
a = array.new_float(leng, 0.0) 
b = array.new_float(leng, 0.0)
c = array.new_float(leng, 0.0)
d = array.new_float(leng, 0.0)
e = array.new_float(leng, 0.0)
f = array.new_float(leng, 0.0)

/////////Initialize the Values///////////

ll1 = leng-1
ll2 = leng-2

for i = 0 to ll1
    array.set(a,i, lambda*(-4))
    array.set(b,i, src[i])
    array.set(c,i, lambda*(-4))
    array.set(d,i, lambda*6 + 1)
    array.set(e,i, lambda)
    array.set(f,i, lambda)

array.set(d, 0,  lambda + 1.0)
array.set(d, ll1, lambda + 1.0)
array.set(d, 1,  lambda * 5.0 + 1.0)
array.set(d, ll2, lambda * 5.0 + 1.0)

array.set(c, 0 , lambda * (-2.0))
array.set(c, ll2, lambda * (-2.0))

array.set(a, 0 , lambda * (-2.0))
array.set(a, ll2, lambda * (-2.0))

//////////////Solve the optimization issue/////////////////////
float r = array.get(a, 0)
float s = array.get(a, 1)
float t = array.get(e, 0)
float xmult = 0.0

for i = 1 to ll2
    xmult := r / array.get(d, i-1) 
    array.set(d, i, array.get(d, i) - xmult * array.get(c, i-1))
    array.set(c, i, array.get(c, i) - xmult * array.get(f, i-1))
    array.set(b, i, array.get(b, i) - xmult * array.get(b, i-1))

    xmult := t / array.get(d, i-1)
    r     := s - xmult*array.get(c, i-1)
    array.set(d, i+1, array.get(d, i+1) - xmult * array.get(f, i-1))
    array.set(b, i+1, array.get(b, i+1) - xmult * array.get(b, i-1))
    
    s     := array.get(a, i+1)
    t     := array.get(e, i)

xmult := r / array.get(d, ll2)
array.set(d, ll1, array.get(d, ll1) - xmult * array.get(c, ll2))

x = array.new_float(leng, 0) 
array.set(x, ll1, (array.get(b, ll1) - xmult * array.get(b, ll2)) / array.get(d, ll1))
array.set(x, ll2, (array.get(b, ll2) - array.get(c, ll2) * array.get(x, ll1)) / array.get(d, ll2))

for j = 0 to leng-3
    i = leng-3 - j
    array.set(x, i, (array.get(b,i) - array.get(f,i)*array.get(x,i+2) - array.get(c,i)*array.get(x,i+1)) / array.get(d, i))


//////////////Construct the output///////////////////
HP = array.get(x,0)

///////////////Custom VWAP////////////////////////
TimeFrame = input('1', type=input.resolution)
start = security(syminfo.tickerid, TimeFrame, time)

//------------------------------------------------
newSession = iff(change(start), 1, 0)
//------------------------------------------------
vwapsum = 0.0
vwapsum := iff(newSession, HP*volume, vwapsum[1]+HP*volume)
volumesum = 0.0
volumesum := iff(newSession, volume, volumesum[1]+volume)
v2sum = 0.0
v2sum := iff(newSession, volume*HP*HP, v2sum[1]+volume*HP*HP)
myvwap = vwapsum/volumesum
dev = sqrt(max(v2sum/volumesum - myvwap*myvwap, 0))
Coloring=close>myvwap?color.new(#81c784, 62):color.new(#c2185b, 38)
av=myvwap
showBcol = input(true, type=input.bool, title="Show barcolors")


///////////////Entry & Exit///////////////////

// Custom function to convert pips into whole numbers
toWhole(number) =>
    return = atr < 1.0 ? (number / syminfo.mintick) / (10 / syminfo.pointvalue) : number
    return := atr >= 1.0 and atr < 100.0 and syminfo.currency == "JPY" ? return * 100 : return
    
// Custom function to convert whole numbers back into pips
toPips(number) =>
    return = atr >= 1.0 ? number : (number * syminfo.mintick) * (10 / syminfo.pointvalue)
    return := atr >= 1.0 and atr < 100.0 and syminfo.currency == "JPY" ? return / 100 : return
    
// Custom function to truncate (cut) excess decimal places
truncate(_number, _decimalPlaces) =>
    _factor = pow(10, _decimalPlaces)
    int(_number * _factor) / _factor


///////////////Conditional Strategy Logic//////////////
Long = crossover(av, ohlc4)
Sell = crossunder(av, ohlc4)

// Check if we have confirmation for our setup
validLong = Long and strategy.position_size == 0 and inDateRange and barstate.isconfirmed
validShort = Sell and strategy.position_size == 0 and inDateRange and barstate.isconfirmed


// Calculate our stop distance & size for the current bar
stopSize = atr * stopMultiplier
longStopPrice = low < low[1] ? low - stopSize : low[1] - stopSize
longStopDistance = close - longStopPrice
longTargetPrice = close + (longStopDistance * rr)


// Save trade stop & target & position size if a valid setup is detected
var t_entry = 0.0
var t_stop = 0.0
var t_target = 0.0
var t_direction = 0

// Detect valid long setups & trigger alert
if validLong
    t_entry := close
    t_stop := longStopPrice
    t_target := longTargetPrice
    t_direction := 1
    strategy.entry(id="Long", long=strategy.long, when=validLong, comment="(SL=" + tostring(truncate(toWhole(longStopDistance),2)) + " pips)")
    // Fire alerts
    alert(message="Long Detected", freq=alert.freq_once_per_bar_close)
    
// Check if price has hit long stop loss or target
if t_direction == 1 and (low <= t_stop or high >= t_target)
    t_direction := 0

// Check if price has hit short stop loss or target
if t_direction == -1 and (high >= t_stop or low <= t_target)
    t_direction := 0


// Exit trades whenever our stop or target is hit
strategy.exit(id="Long Exit", from_entry="Long", limit=t_target, stop=t_stop, when=strategy.position_size > 0)

// Draw trade data
plot(strategy.position_size != 0 or validLong? t_stop : na, title="Trade Stop Price", color=color.red, style=plot.style_linebr)
plot(strategy.position_size != 0 or validLong? t_target : na, title="Trade Target Price", color=color.green, style=plot.style_linebr)

/////////////////////Plotting//////////////////////////

A=plot(av, color=Coloring, title="HP VWAP")

barcolor(showBcol?Coloring:na)

fill(A, plot(ohlc4), Coloring)

// Draw price action setup arrows
plotshape(validLong ? 1 : na, style=shape.triangleup, location=location.belowbar, color=color.green, title="Bullish Setup")

// // --- BEGIN TESTER CODE --- //
// // Declare performance tracking variables
// var balance = startBalance
// var drawdown = 0.0
// var maxDrawdown = 0.0
// var maxBalance = 0.0
// var totalPips = 0.0
// var totalWins = 0
// var totalLoss = 0

// // Detect winning trades
// if strategy.wintrades != strategy.wintrades[1]
//     balance := balance + ((riskPerTrade / 100) * balance) * rr
//     totalPips := totalPips + abs(t_entry - t_target)
//     totalWins := totalWins + 1
//     if balance > maxBalance
//         maxBalance := balance
        
// // Detect losing trades
// if strategy.losstrades != strategy.losstrades[1]
//     balance := balance - ((riskPerTrade / 100) * balance)
//     totalPips := totalPips - abs(t_entry - t_stop)
//     totalLoss := totalLoss + 1
//     // Update drawdown
//     drawdown := (balance / maxBalance) - 1
//     if drawdown < maxDrawdown
//         maxDrawdown := drawdown
        
// // Prepare stats table
// var table testTable = table.new(position.top_right, 5, 2, border_width=1)
// f_fillCell(_table, _column, _row, _title, _value, _bgcolor, _txtcolor) =>
//     _cellText = _title + "\n" + _value
//     table.cell(_table, _column, _row, _cellText, bgcolor=_bgcolor, text_color=_txtcolor)
    
// // Draw stats table
// var bgcolor = color.new(color.black,0)
// if drawTester
//     if barstate.islastconfirmedhistory
//         // Update table
//         dollarReturn = balance - startBalance
//         f_fillCell(testTable, 0, 0, "Total Trades:", tostring(strategy.closedtrades), bgcolor, color.white)
//         f_fillCell(testTable, 0, 1, "Win Rate:", tostring(truncate((strategy.wintrades/strategy.closedtrades)*100,2)) + "%", bgcolor, color.white)
//         f_fillCell(testTable, 1, 0, "Starting:", "$" + tostring(startBalance), bgcolor, color.white)
//         f_fillCell(testTable, 1, 1, "Ending:", "$" + tostring(truncate(balance,2)), bgcolor, color.white)
//         f_fillCell(testTable, 2, 0, "Return:", "$" + tostring(truncate(dollarReturn,2)), dollarReturn > 0 ? color.green : color.red, color.white)
//         f_fillCell(testTable, 2, 1, "Pips:", (totalPips > 0 ? "+" : "") + tostring(truncate(toWhole(totalPips),2)), bgcolor, color.white)
//         f_fillCell(testTable, 3, 0, "Return:", (dollarReturn > 0 ? "+" : "") + tostring(truncate((dollarReturn / startBalance)*100,2)) + "%", dollarReturn > 0 ? color.green : color.red, color.white)
//         f_fillCell(testTable, 3, 1, "Max DD:", tostring(truncate(maxDrawdown*100,2)) + "%", color.red, color.white)
// // --- END TESTER CODE --- //

Thêm nữa