Chiến lược giao dịch đảo ngược đột phá kênh

Tổng quan
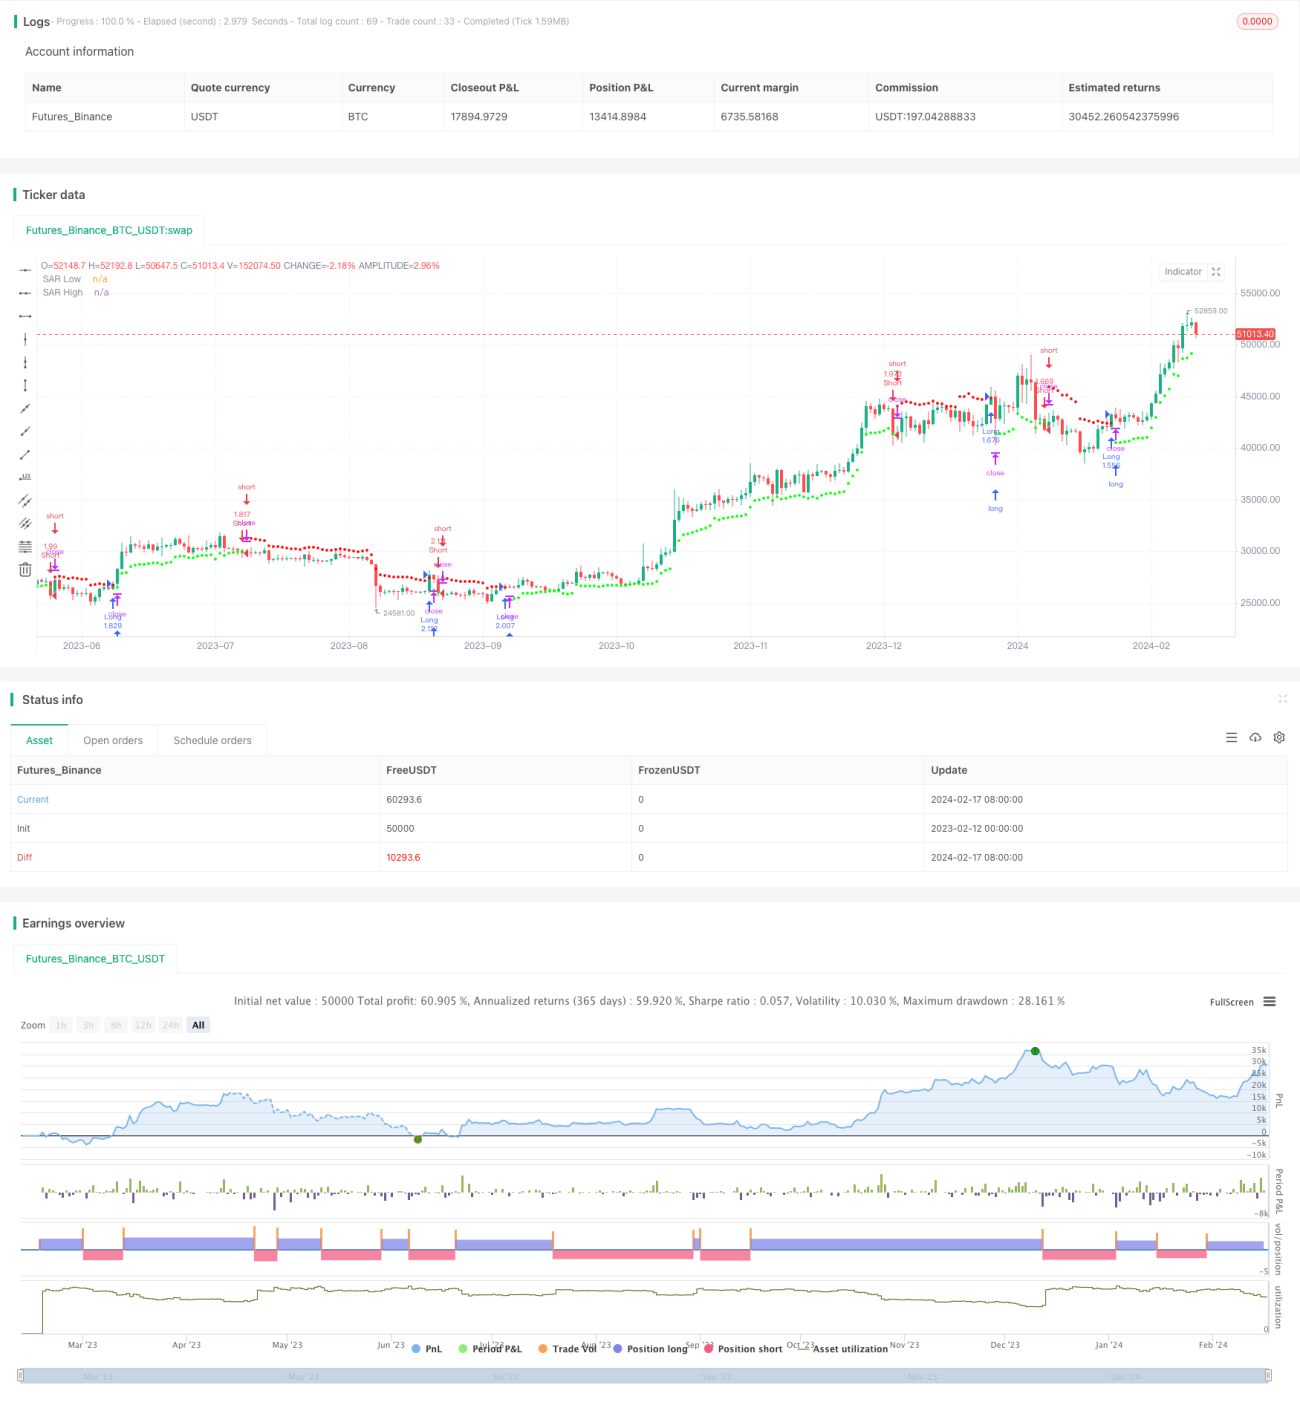
Chiến lược giao dịch đảo ngược phá vỡ kênh là một chiến lược giao dịch đảo ngược theo dõi điểm dừng chân di chuyển của kênh giá. Nó sử dụng phương pháp trung bình di chuyển có trọng lượng để tính toán kênh giá và thiết lập vị trí đầu nhiều hoặc trống khi giá phá vỡ kênh.
Nguyên tắc chiến lược
Chiến lược này đầu tiên sử dụng chỉ số Wilder Average True Range (ATR) để tính toán tỷ lệ biến động giá. Sau đó, tính toán hằng số phạm vi trung bình (ARC) dựa trên giá trị ATR. ARC là một nửa chiều rộng của kênh giá.
Cụ thể, ATR của đường N gốc K gần nhất được tính đầu tiên. ARC được nhân với ATR bằng một hệ số. ARC được nhân với hệ số có thể kiểm soát chiều rộng của kênh. ARC được cộng với giá đóng cửa ở điểm cao nhất trong đường N gốc K để có được đường dẫn lên, tức là SAR cao.
Lợi thế chiến lược
- Sử dụng các kênh thích ứng để tính toán biến động giá để theo dõi sự thay đổi của thị trường
- Giao dịch đảo ngược, phù hợp với thị trường đảo ngược xu hướng
- Mobile Stop Loss, khóa lợi nhuận, kiểm soát rủi ro
Rủi ro chiến lược
- Giao dịch chuyển đổi ngược dễ bị đặt cược, cần điều chỉnh các tham số phù hợp
- Dễ bị đóng vị trí trong thị trường biến động lớn
- Các tham số không đúng sẽ dẫn đến giao dịch quá thường xuyên
Giải pháp:
- Tối ưu hóa chu kỳ ATR và hệ số ARC để hợp lý hóa chiều rộng đường dẫn
- Kết hợp các chỉ số xu hướng để lọc vào thời gian
- Tăng chu kỳ ATR, giảm tần suất giao dịch
Hướng tối ưu hóa chiến lược
- Tối ưu hóa chu kỳ ATR và ARC
- Tăng điều kiện mở vị trí, ví dụ như kết hợp với chỉ số MACD
- Tăng chiến lược dừng lỗ
Tóm tắt
Chiến lược giao dịch đảo ngược phá vỡ kênh sử dụng kênh để theo dõi sự thay đổi giá, xây dựng vị trí đảo ngược khi biến động tăng lên và thiết lập dừng dừng động thích ứng. Chiến lược này được áp dụng cho thị trường hoàn thiện chủ yếu là đảo ngược, có thể nhận được lợi nhuận đầu tư tốt nếu xác định chính xác điểm đảo ngược. Tuy nhiên, cần lưu ý để ngăn chặn điểm dừng lỗ quá nới lỏng và tối ưu hóa tham số.
- 1