Chiến lược giao cắt đường trung bình động nhiều khung thời gian

Tổng quan
Chiến lược chéo đường trung bình di chuyển nhiều khung thời gian (Multi Timeframe Moving Average Crossover Strategy) là một chiến lược giao dịch thuật toán sử dụng tín hiệu chéo giữa các trung bình di chuyển trong các chu kỳ thời gian khác nhau để xác định hướng xu hướng. Chiến lược này sử dụng kết hợp các chỉ số xu hướng, chỉ số động lực và chỉ số dao động, làm cho tín hiệu chiến lược đáng tin cậy hơn.
Nguyên tắc chiến lược
Chiến lược này xác định xu hướng thị trường bằng cách tính toán các chỉ số CCI trong các chu kỳ khác nhau, sau đó kết hợp với chỉ số MACD để tìm tín hiệu giao dịch vàng, và cuối cùng sử dụng chỉ số ATR để thiết lập vị trí dừng lỗ để mua thấp và bán cao.
Cụ thể, đầu tiên tính toán chỉ số CCI 20 chu kỳ, để đánh giá xu hướng thị trường dựa trên tích cực và tiêu cực của nó; sau đó tính toán đường trung bình MACD của chỉ số MACD có xảy ra giao nhau hay không, để xác định liệu có tín hiệu mua bán được tạo ra hay không; sau đó sử dụng chỉ số ATR để tạo ra cơ chế theo dõi dừng lỗ, để khóa lợi nhuận hơn nữa; và cuối cùng, tổng hợp các tín hiệu của nhiều chỉ số trên để tạo ra tín hiệu chiến lược mua bán cuối cùng.
Lợi thế chiến lược
-
Kết hợp nhiều chỉ số để tăng độ chính xác tín hiệu
Chiến lược này sử dụng sự kết hợp của ba chỉ số CCI, MACD và ATR để đánh giá tổng hợp xu hướng, động lực và độ biến động của thị trường, làm cho tín hiệu chiến lược chính xác và đáng tin cậy hơn.
-
Phân tích khung thời gian đa dạng, nắm bắt nhịp độ thị trường
Sử dụng CCI của các chu kỳ khác nhau để đánh giá xu hướng chung của thị trường, kết hợp với MACD chu kỳ cao để tìm các nút mua và bán thấp, có thể nắm bắt nhịp độ xu hướng lớn của thị trường.
-
ATR ngăn chặn theo dõi thiệt hại, kiểm soát rủi ro hiệu quả
Sử dụng chỉ số ATR để tạo ra stop loss, bạn có thể đặt mức dừng hợp lý dựa trên biến động của thị trường, đồng thời có chức năng theo dõi dừng lỗ, có thể kiểm soát rủi ro của chiến lược.
Rủi ro chiến lược
-
Không gian tối ưu hóa tham số giới hạn
Hầu hết các tham số trong chiến lược này không có nhiều điều chỉnh, dễ dàng đạt đến giới hạn hiệu quả, hạn chế việc nâng cao hiệu quả của chiến lược.
-
Gói đa chỉ số tăng tải tính toán
Vì chiến lược sử dụng nhiều chỉ số để thực hiện các hoạt động kết hợp, nó làm tăng khối lượng tính toán của chiến lược ở một mức độ nhất định. Trong giao dịch tần số cao, có thể có vấn đề về carton.
-
Tín hiệu thường xuyên, kiểm soát rủi ro hạn chế
Các tín hiệu chiến lược có thể thường xuyên hơn, trong khi kiểm soát rủi ro chủ yếu dựa trên việc theo dõi tổn thất của chỉ số ATR, kiểm soát rủi ro đối với các tình huống cực đoan là không hoàn chỉnh.
Tối ưu hóa chiến lược
-
Tăng hiệu quả tối ưu hóa tham số bằng thuật toán học máy
Bạn có thể thử sử dụng một số thuật toán tối ưu hóa siêu tham số của học máy, chẳng hạn như tối ưu hóa Bayesian, thuật toán di truyền, để điều chỉnh tham số thông minh hơn và hiệu quả hơn.
-
Tăng các chỉ số chức năng, tăng tính linh hoạt của chiến lược
Có thể xem xét thêm một số chỉ số chức năng khác, chẳng hạn như chỉ số tỷ lệ biến động, chỉ số năng lượng, chỉ số cảm xúc, để nâng cao khả năng thích ứng và tính mạnh mẽ của chiến lược.
-
Tăng cường mô-đun quản lý rủi ro, kiểm soát rủi ro chiến lược
Có thể thiết kế nguyên tắc dừng lỗ khoa học hơn, hoặc có thể thêm một số mô-đun kiểm soát vị trí hoặc quản lý tiền để bảo vệ tốt hơn rủi ro của tình huống cực đoan và đảm bảo sự ổn định của chiến lược.
Tóm tắt
Các chiến lược đa khung thời gian vượt qua các chiến lược đường bằng bằng cách sử dụng sự kết hợp của ba chỉ số lớn CCI, MACD và ATR, để đạt được sự phán đoán xu hướng đáng tin cậy hơn và kiểm soát rủi ro hiệu quả hơn. Chiến lược tổng hợp xem xét xu hướng, động lực và dao động ba chiều, có độ chính xác tín hiệu cao, nắm bắt nhịp độ thị trường và kiểm soát rủi ro hiệu quả. Tất nhiên, chiến lược cũng có một không gian tối ưu hóa tham số nhất định, khối lượng tính toán hạn chế và kiểm soát rủi ro có thể nâng cao. Bằng cách giới thiệu nhiều chỉ số hơn, sử dụng các phương tiện tối ưu hóa tham số tốt hơn và thiết kế mô-đun kiểm soát rủi ro mạnh mẽ hơn, chiến lược có thể được nâng cao và tối ưu hóa hơn nữa.
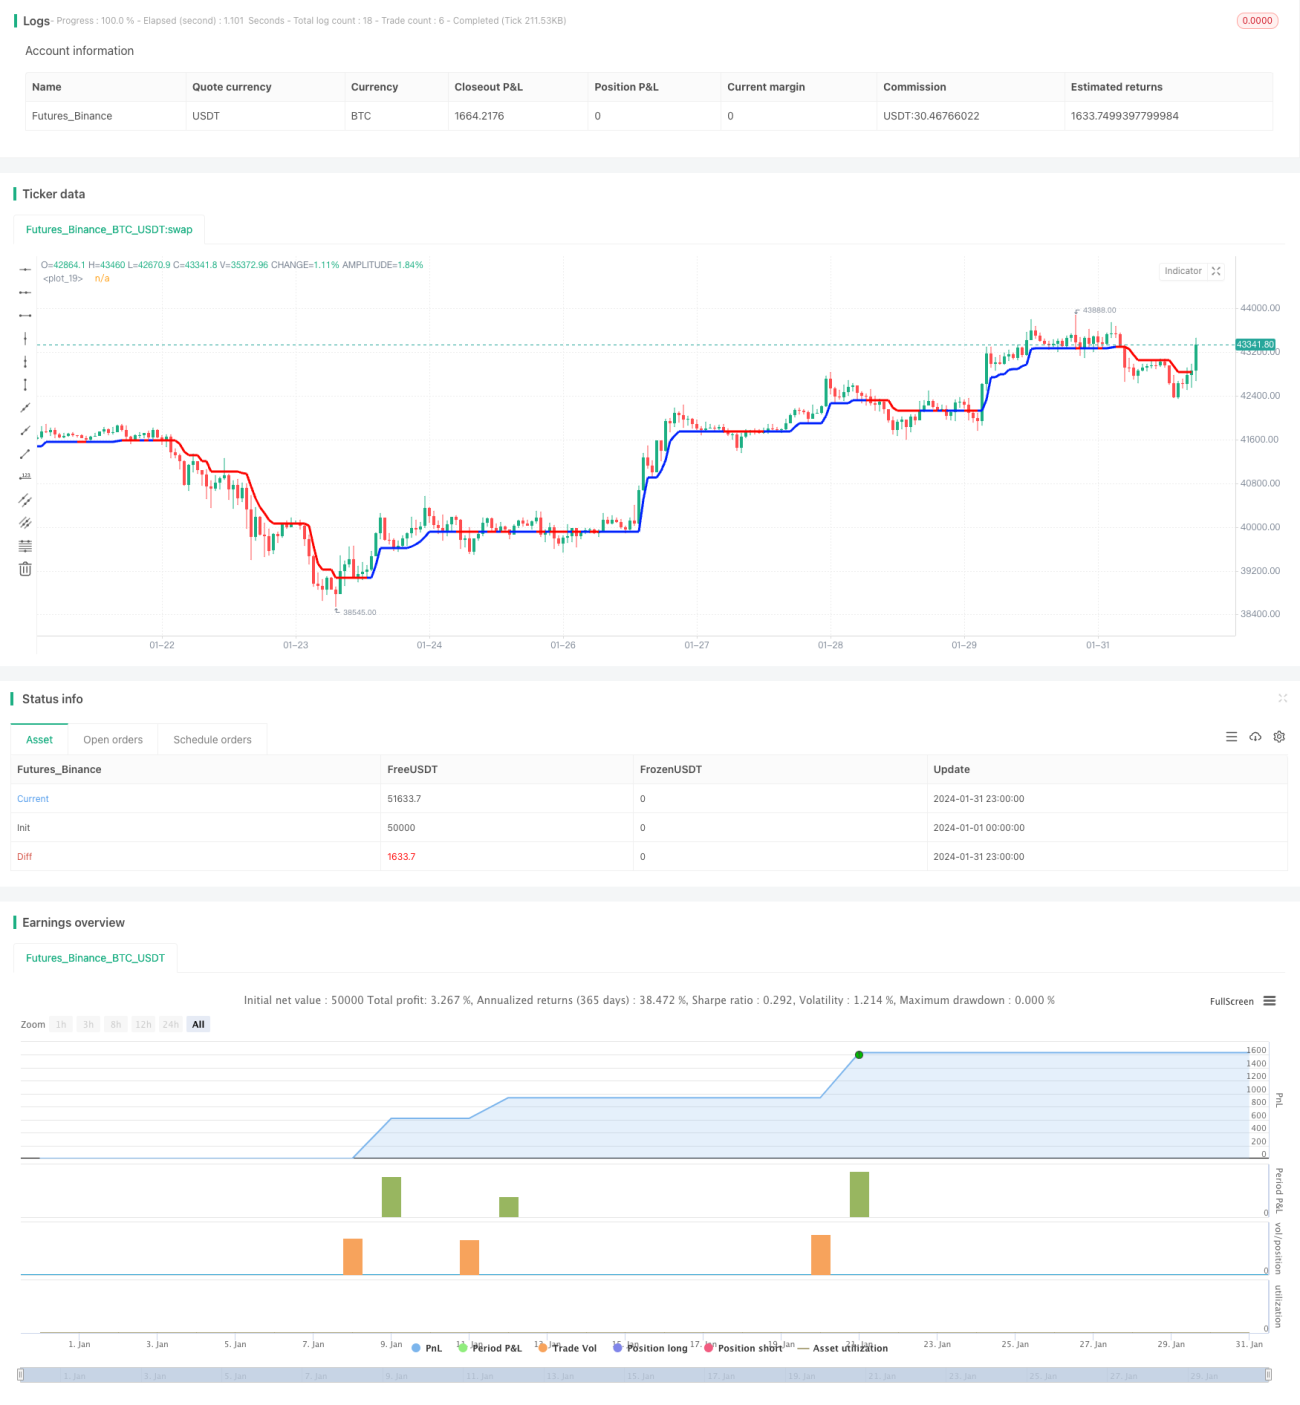
/*backtest
start: 2024-01-01 00:00:00
end: 2024-01-31 23:59:59
period: 1h
basePeriod: 15m
exchanges: [{"eid":"Futures_Binance","currency":"BTC_USDT"}]
*/

//@version=5
strategy('smplondonclinic Strategy', shorttitle='SMPLC Strategy', overlay=true, pyramiding = 0, process_orders_on_close = true, default_qty_type = strategy.percent_of_equity, default_qty_value = 100)

direction = input.string(title='Entry Direction', defval='Long', options=['Long', 'Short', 'Both'],group = "Strategy Entry Direction")- 1