Chiến lược phá vỡ động lực

Tác giả:ChaoZhang, Ngày: 2024-02-23 14:27:21
Tags:

img

Tổng quan

Chiến lược phá vỡ đà là một chiến lược theo xu hướng theo dõi đà của thị trường. Nó kết hợp nhiều chỉ số để đánh giá xem thị trường hiện đang có xu hướng tăng hay giảm, và mở các vị trí dài khi phá vỡ các mức kháng cự chính và mở các vị trí ngắn khi phá vỡ các mức hỗ trợ chính.

Chiến lược logic

Chiến lược này chủ yếu sử dụng các kênh Donchian của nhiều khung thời gian để xác định xu hướng thị trường và mức giá chính. Cụ thể, khi giá vượt qua đường ray trên của kênh Donchian dài hạn như 40 ngày, nó được đánh giá là xu hướng tăng. Cùng với các bộ lọc bổ sung như mức cao mới trong năm và sự sắp xếp của đường trung bình động, các tín hiệu dài được kích hoạt. Khi giá vượt qua đường ray dưới của kênh Donchian dài hạn, nó được đánh giá là xu hướng giảm. Cùng với các bộ lọc như mức thấp mới trong năm, các tín hiệu ngắn được kích hoạt.

Chiến lược này cung cấp hai tùy chọn cho các vị trí thoát: đường vô hiệu hóa cố định và đường dừng lỗ sau. Đường vô hiệu hóa cố định sử dụng đường ray dưới / trên của kênh Donchian ngắn hơn chẳng hạn như 20 ngày. Đường dừng lỗ sau tính toán đường dừng lỗ năng động mỗi ngày dựa trên giá trị ATR. Cả hai phương pháp đều có thể kiểm soát rủi ro một cách hiệu quả.

Phân tích lợi thế

Chiến lược này kết hợp phán đoán xu hướng và các hoạt động đột phá, có thể nắm bắt hiệu quả các cơ hội định hướng ngắn hạn trên thị trường. So với chỉ số duy nhất, nó sử dụng nhiều bộ lọc có thể lọc ra một số đột phá sai và cải thiện chất lượng tín hiệu nhập cảnh. Ngoài ra, việc áp dụng các chiến lược dừng lỗ cũng tăng cường khả năng phục hồi của nó và có thể kiểm soát hiệu quả lỗ ngay cả khi thị trường rút ngắn.

Phân tích rủi ro

Rủi ro chính của chiến lược này là giá có thể dao động mạnh mẽ, gây ra lỗ dừng để thoát khỏi các vị trí. Nếu giá đảo ngược nhanh sau đó, các cơ hội có thể bị bỏ lỡ. Ngoài ra, việc sử dụng nhiều bộ lọc cũng có thể lọc ra một số cơ hội và giảm tần suất giao dịch.

Để giảm rủi ro, các nhân ATR có thể được điều chỉnh hoặc khoảng thời gian kênh Donchian có thể được mở rộng để giảm khả năng bị trúng lỗ dừng.

Hướng dẫn tối ưu hóa

Chiến lược này có thể được tối ưu hóa trong các khía cạnh sau:

  1. Tối ưu hóa chiều dài của các kênh Donchian để tìm ra sự kết hợp tốt nhất của các tham số.
  2. Hãy thử các loại trung bình động khác nhau như bộ lọc.
  3. Điều chỉnh nhân ATR hoặc sử dụng các điểm cố định để dừng lỗ.
  4. Thêm thêm các chỉ số đánh giá xu hướng như MACD.
  5. Tối ưu hóa các khoảng thời gian xem lại cho mức cao / thấp mới trong năm vv

Bằng cách thử nghiệm các tham số khác nhau, sự kết hợp tối ưu cân bằng rủi ro và lợi nhuận có thể được tìm thấy.

Kết luận

Chiến lược này kết hợp nhiều chỉ số để xác định hướng xu hướng và kích hoạt giao dịch ở các mức đột phá chính. Cơ chế dừng lỗ của nó cũng làm cho nó chống lại rủi ro. Bằng cách tối ưu hóa các tham số, lợi nhuận dư thừa ổn định có thể đạt được. Nó phù hợp với các nhà đầu tư không có tầm nhìn rõ ràng về thị trường nhưng muốn theo dõi xu hướng.
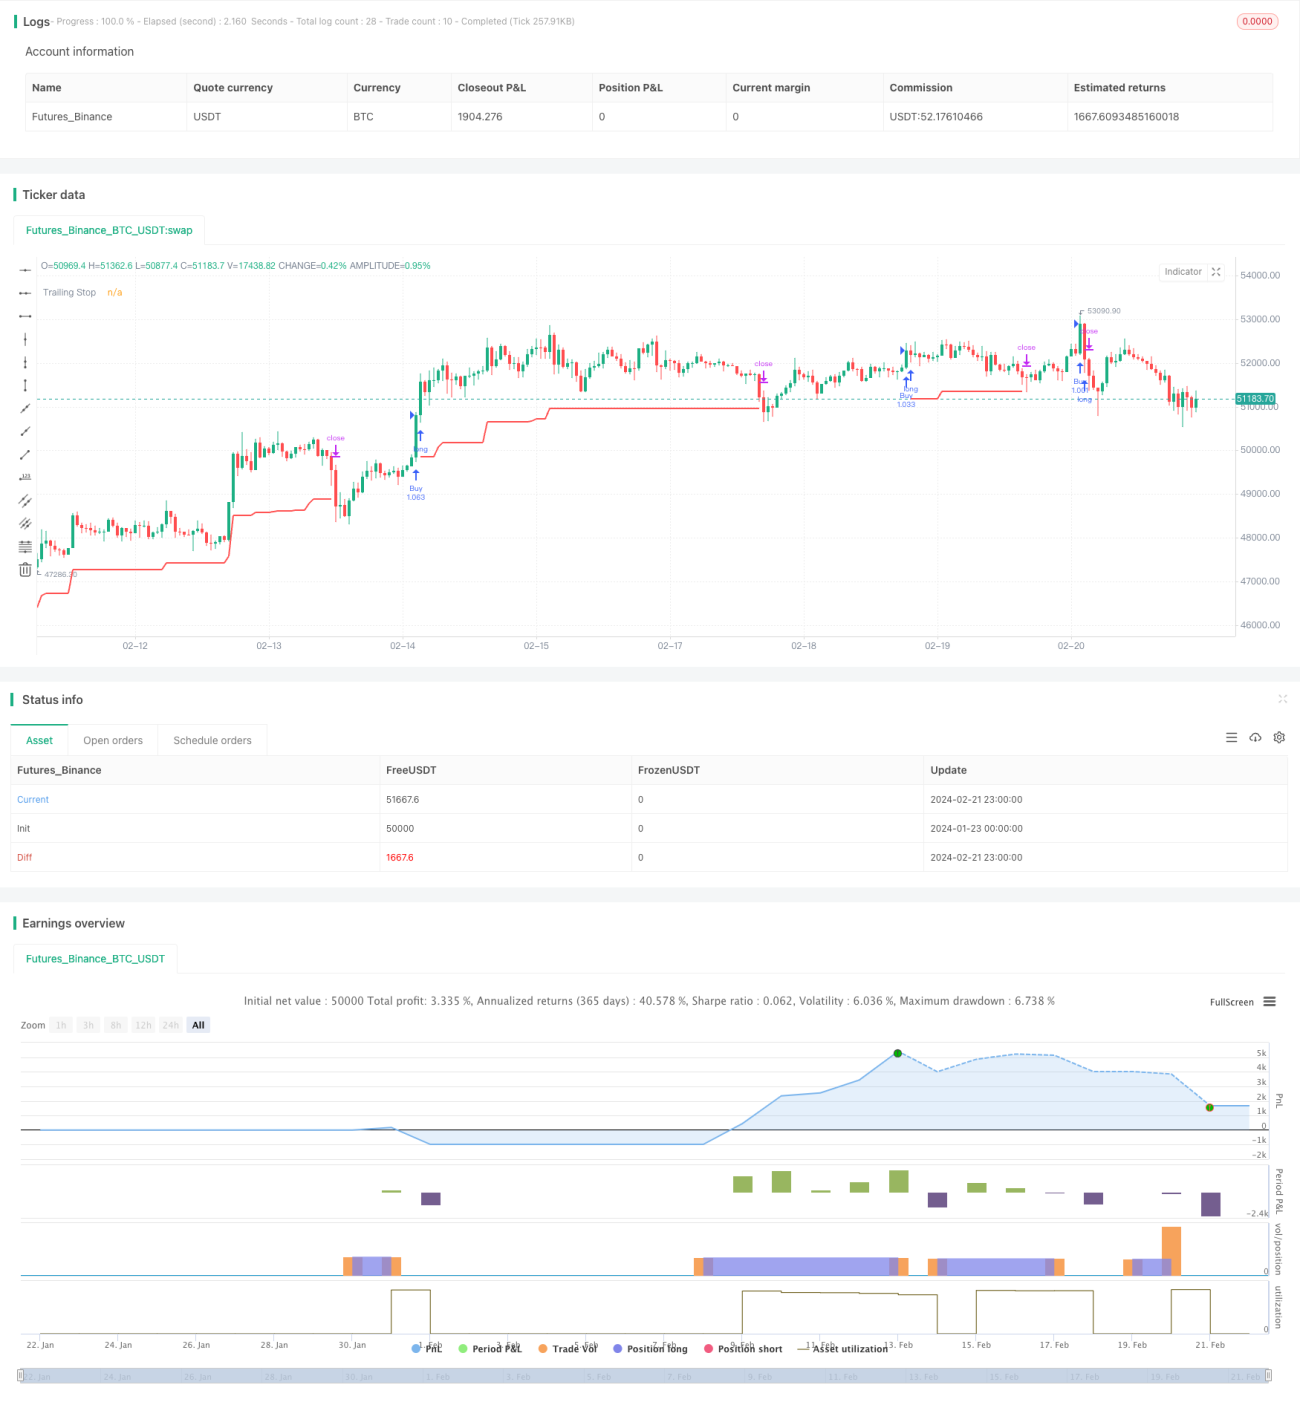

/*backtest
start: 2024-01-23 00:00:00
end: 2024-02-22 00:00:00
period: 1h
basePeriod: 15m
exchanges: [{"eid":"Futures_Binance","currency":"BTC_USDT"}]
*/

// This source code is subject to the terms of the Mozilla Public License 2.0 at https://mozilla.org/MPL/2.0/
// © HeWhoMustNotBeNamed

//@version=4
strategy("BuyHigh-SellLow Strategy", overlay=true, initial_capital = 10000, default_qty_type = strategy.percent_of_equity, default_qty_value = 100, commission_type = strategy.commission.percent, pyramiding = 1, commission_value = 0.01, calc_on_order_fills = true)
donchianEntryLength = input(40, step=10)
donchianExitLength = input(20, step=10)

considerNewLongTermHighLows = input(true)
shortHighLowPeriod = input(120, step=10)
longHighLowPeriod = input(180, step=10)

considerMAAlignment = input(true)
MAType = input(title="Moving Average Type", defval="ema", options=["ema", "sma", "hma", "rma", "vwma", "wma"])
LookbackPeriod = input(40, minval=10,step=10)

atrLength = input(22)
atrMult = input(4)

exitStrategy = input(title="Exit Strategy", defval="tsl", options=["dc", "tsl"])

considerYearlyHighLow = input(true)
backtestYears = input(10, minval=1, step=1)
f_getMovingAverage(source, MAType, length)=>
    ma = sma(source, length)
    if(MAType == "ema")
        ma := ema(source,length)
    if(MAType == "hma")
        ma := hma(source,length)
    if(MAType == "rma")
        ma := rma(source,length)
    if(MAType == "vwma")
        ma := vwma(source,length)
    if(MAType == "wma")
        ma := wma(source,length)
    ma

f_getTrailingStop(atr, atrMult)=>
    stop = close - atrMult*atr
    stop := strategy.position_size > 0 ? max(stop, stop[1]) : stop
    stop

f_getMaAlignment(MAType, includePartiallyAligned)=>
    ma5 = f_getMovingAverage(close,MAType,5)
    ma10 = f_getMovingAverage(close,MAType,10)
    ma20 = f_getMovingAverage(close,MAType,20)
    ma30 = f_getMovingAverage(close,MAType,30)
    ma50 = f_getMovingAverage(close,MAType,50)
    ma100 = f_getMovingAverage(close,MAType,100)
    ma200 = f_getMovingAverage(close,MAType,200)

    upwardScore = 0
    upwardScore := close > ma5? upwardScore+1:upwardScore
    upwardScore := ma5 > ma10? upwardScore+1:upwardScore
    upwardScore := ma10 > ma20? upwardScore+1:upwardScore
    upwardScore := ma20 > ma30? upwardScore+1:upwardScore
    upwardScore := ma30 > ma50? upwardScore+1:upwardScore
    upwardScore := ma50 > ma100? upwardScore+1:upwardScore
    upwardScore := ma100 > ma200? upwardScore+1:upwardScore
    
    upwards = close > ma5 and ma5 > ma10 and ma10 > ma20 and ma20 > ma30 and ma30 > ma50 and ma50 > ma100 and ma100 > ma200
    downwards = close < ma5 and ma5 < ma10 and ma10 < ma20 and ma20 < ma30 and ma30 < ma50 and ma50 < ma100 and ma100 < ma200
    upwards?1:downwards?-1:includePartiallyAligned ? (upwardScore > 5? 0.5: upwardScore < 2?-0.5:upwardScore>3?0.25:-0.25) : 0

//////////////////////////////////// Calculate new high low condition //////////////////////////////////////////////////
f_calculateNewHighLows(shortHighLowPeriod, longHighLowPeriod, considerNewLongTermHighLows)=>
    newHigh = highest(shortHighLowPeriod) == highest(longHighLowPeriod) or not considerNewLongTermHighLows
    newLow = lowest(shortHighLowPeriod) == lowest(longHighLowPeriod) or not considerNewLongTermHighLows
    [newHigh,newLow]

//////////////////////////////////// Calculate Yearly High Low //////////////////////////////////////////////////
f_getYearlyHighLowCondition(considerYearlyHighLow)=>
    yhigh = security(syminfo.tickerid, '12M', high[1]) 
    ylow = security(syminfo.tickerid, '12M', low[1]) 
    yhighlast = yhigh[365]
    ylowlast = ylow[365]
    yhighllast = yhigh[2 * 365]
    ylowllast = ylow[2 * 365]
    
    yearlyTrendUp = na(yhigh)? true : na(yhighlast)? close > yhigh : na(yhighllast)? close > max(yhigh,yhighlast) : close > max(yhigh, min(yhighlast, yhighllast))
    yearlyHighCondition = (  (na(yhigh) or na(yhighlast) ? true : (yhigh > yhighlast) ) and ( na(yhigh) or na(yhighllast) ? true : (yhigh > yhighllast))) or yearlyTrendUp or not considerYearlyHighLow
    yearlyTrendDown = na(ylow)? true : na(ylowlast)? close < ylow : na(ylowllast)? close < min(ylow,ylowlast) : close < min(ylow, max(ylowlast, ylowllast))
    yearlyLowCondition = (  (na(ylow) or na(ylowlast) ? true : (ylow < ylowlast) ) and ( na(ylow) or na(ylowllast) ? true : (ylow < ylowllast))) or yearlyTrendDown or not considerYearlyHighLow
    
    label_x = time+(60*60*24*1000*1)
    [yearlyHighCondition,yearlyLowCondition]

donchian(rangeLength)=>
    upper = highest(rangeLength)
    lower = lowest(rangeLength)
    middle = (upper+lower)/2
    [middle, upper, lower]

inDateRange = true
[eMiddle, eUpper, eLower] = donchian(donchianEntryLength)
[exMiddle, exUpper, exLower] = donchian(donchianExitLength)
maAlignment = f_getMaAlignment(MAType, false)
[yearlyHighCondition, yearlyLowCondition] = f_getYearlyHighLowCondition(considerYearlyHighLow)
[newHigh,newLow] = f_calculateNewHighLows(shortHighLowPeriod, longHighLowPeriod, considerNewLongTermHighLows)

maAlignmentLongCondition = highest(maAlignment, LookbackPeriod) == 1 or not considerMAAlignment 

atr = atr(atrLength)
tsl = f_getTrailingStop(atr, atrMult)

//U = plot(eUpper, title="Up", color=color.green, linewidth=2, style=plot.style_linebr)
//D = plot(exLower, title="Ex Low", color=color.red, linewidth=2, style=plot.style_linebr)
longCondition = crossover(close, eUpper[1]) and yearlyHighCondition and newHigh and maAlignmentLongCondition
exitLongCondition = crossunder(close, exLower[1])

shortCondition = crossunder(close, eLower[1]) and yearlyLowCondition and newLow
exitShortCondition = crossover(close, exUpper[1])
strategy.entry("Buy", strategy.long, when=longCondition and inDateRange, oca_name="oca_buy")
strategy.exit("ExitBuyDC", "Buy", when=exitStrategy=='dc', stop=exLower)
strategy.exit("ExitBuyTSL", "Buy", when=exitStrategy=='tsl', stop=tsl)
plot(strategy.position_size > 0 ? (exitStrategy=='dc'?exLower:tsl) : na, title="Trailing Stop", color=color.red, linewidth=2, style=plot.style_linebr)
//strategy.close("Buy", when=exitLongCondition)

Thêm nữa