Giao dịch theo đà: Chiến lược giao cắt đường trung bình động kép

Tổng quan
Chiến lược này sử dụng đường trung bình di chuyển chỉ số ((EMA) trong 8 chu kỳ và 21 chu kỳ để xác định sự thay đổi trong xu hướng thị trường. Khi EMA chu kỳ ngắn hơn đi qua EMA chu kỳ dài hơn, nó tạo ra tín hiệu mua; ngược lại, khi EMA chu kỳ ngắn hơn đi qua EMA chu kỳ dài hơn, nó tạo ra tín hiệu bán. Chiến lược này cũng kết hợp ba mức thấp liên tiếp cao hơn ((HLL) và ba mức cao liên tiếp thấp hơn ((LLH) làm tín hiệu xác nhận xu hướng đảo ngược hơn nữa.
Nguyên tắc chiến lược
- Tính EMA 8 chu kỳ và 21 chu kỳ để xác định xu hướng chính
- Xác định ba điểm thấp liên tiếp cao hơn ((HLL) và ba điểm cao liên tiếp thấp hơn ((LLH), như một tín hiệu sớm của xu hướng đảo ngược.
- Một tín hiệu mua được tạo ra khi EMA chu kỳ 8 đi qua EMA chu kỳ 21 từ bên dưới và có sự phá vỡ HLL; một tín hiệu bán được tạo ra khi EMA chu kỳ 8 đi qua EMA chu kỳ 21 từ phía trên và có sự phá vỡ LLH.
- Cài đặt mức dừng lỗ là 5% giá nhập cảnh và mức dừng là 16% giá nhập cảnh để kiểm soát rủi ro và khóa lợi nhuận.
- Khi có tín hiệu đảo ngược, hãy đóng và mở lại vị trí.
Lợi thế chiến lược
- Kết hợp EMA và mô hình hành vi giá ((HLL và LLH) để xác nhận xu hướng, tăng độ tin cậy tín hiệu.
- Thiết lập các mức dừng và dừng rõ ràng giúp kiểm soát rủi ro và khóa lợi nhuận.
- Có thể áp dụng cho nhiều khung thời gian và thị trường khác nhau, có tính phổ biến nhất định.
- Logic là rõ ràng, dễ hiểu và dễ thực hiện.
Rủi ro chiến lược
- Trong một thị trường bất ổn, sự giao thoa thường xuyên có thể dẫn đến nhiều tín hiệu sai, dẫn đến tổn thất.
- Mức dừng và dừng cố định có thể không thích ứng với các môi trường thị trường khác nhau, dẫn đến chi phí cơ hội tiềm ẩn hoặc tổn thất lớn hơn.
- Các chiến lược dựa vào dữ liệu lịch sử có thể không thích ứng tốt với các sự kiện đột ngột hoặc thay đổi cơ bản.
Hướng tối ưu hóa chiến lược
- Giới thiệu các cơ chế dừng và dừng thích ứng, chẳng hạn như dựa trên tỷ lệ biến động (ví dụ như ATR) để điều chỉnh mức dừng và dừng để thích ứng tốt hơn với các điều kiện thị trường khác nhau.
- Kết hợp với các chỉ số hoặc yếu tố khác, như khối lượng giao dịch, chỉ số tương đối mạnh (RSI) để lọc thêm tín hiệu và tăng độ tin cậy.
- Tối ưu hóa các tham số (ví dụ như chu kỳ EMA, tỷ lệ dừng lỗ, v.v.) để tìm ra sự kết hợp các tham số hoạt động tốt nhất trên một thị trường hoặc chỉ số cụ thể.
- Xem xét việc đưa ra các biện pháp quản lý rủi ro, chẳng hạn như kích thước vị trí, để kiểm soát lỗ hổng rủi ro của giao dịch đơn.
Tóm tắt
Chiến lược này sử dụng sự giao thoa của EMA 8 chu kỳ và 21 chu kỳ, kết hợp với mô hình giá HLL và LLH để xác định xu hướng đảo ngược và tạo ra tín hiệu giao dịch. Quy tắc dừng lỗ rõ ràng giúp kiểm soát rủi ro và khóa lợi nhuận. Tuy nhiên, chiến lược này có thể tạo ra tín hiệu sai trong thị trường bất ổn và mức dừng lỗ cố định có thể không thích nghi với môi trường thị trường khác nhau.
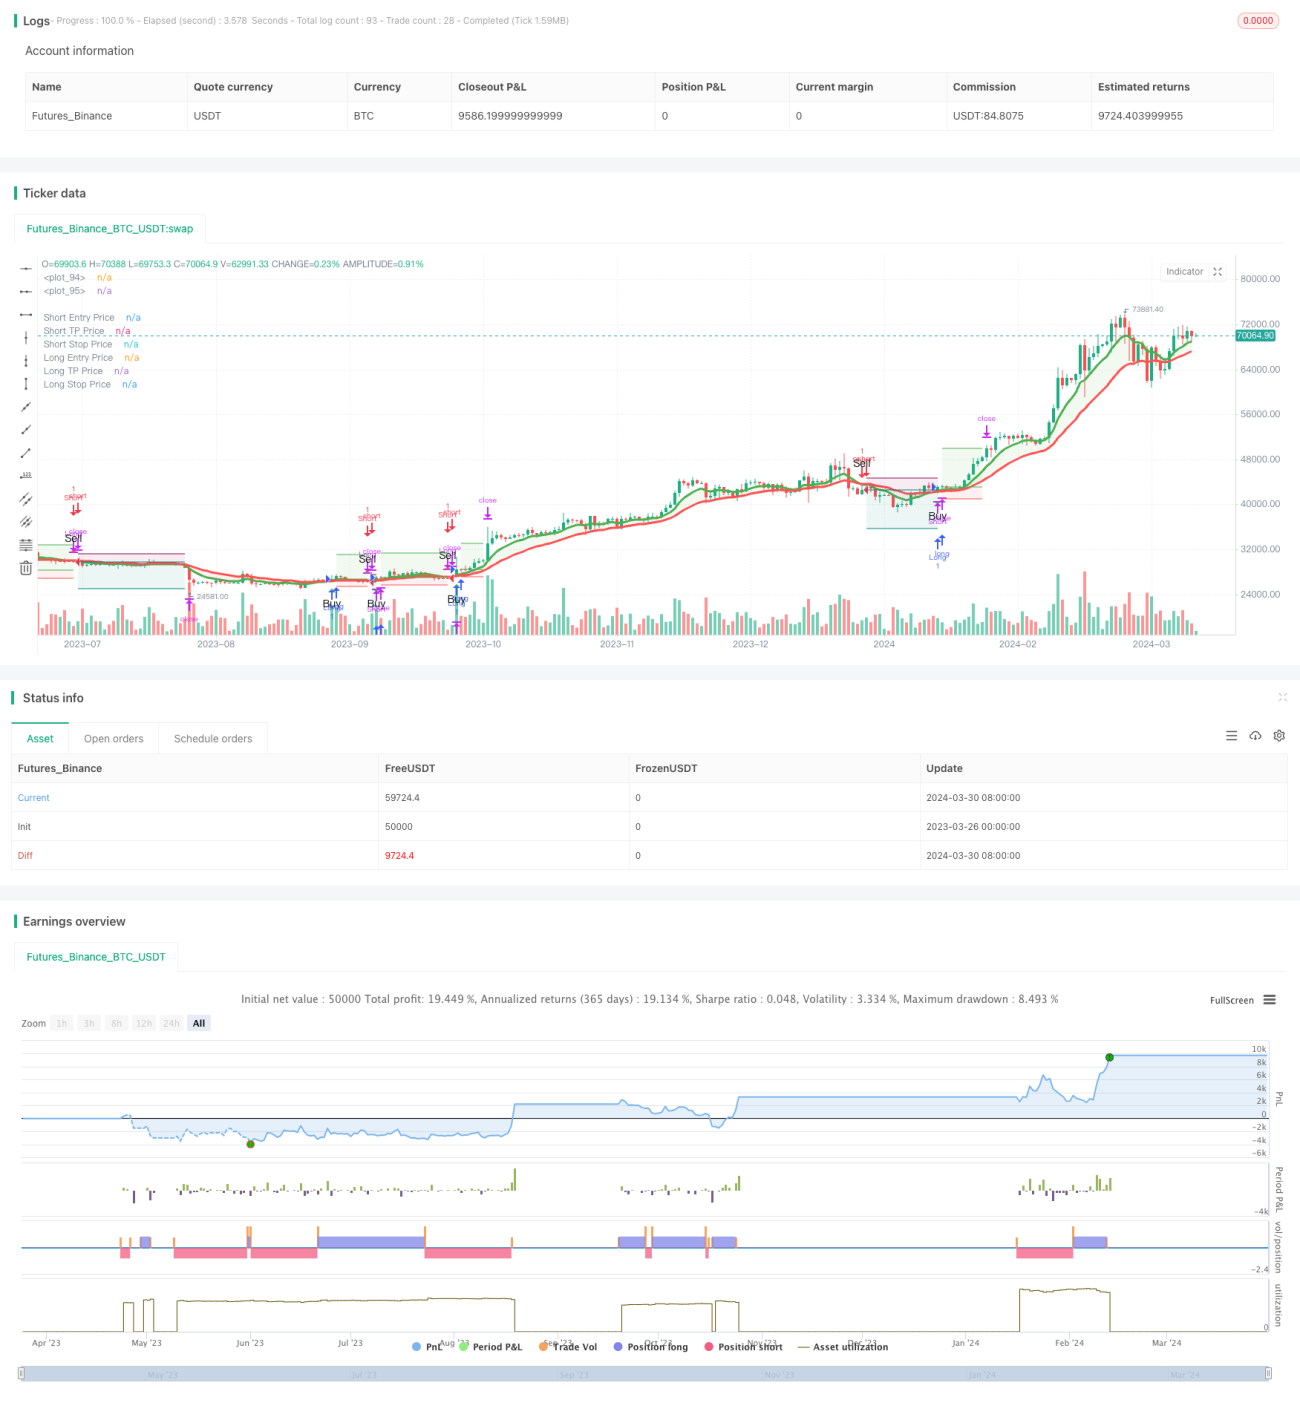
/*backtest
start: 2023-03-26 00:00:00
end: 2024-03-31 00:00:00
period: 1d
basePeriod: 1h
exchanges: [{"eid":"Futures_Binance","currency":"BTC_USDT"}]
*/

//@version=5
strategy('Trend Following 8&21EMA with strategy tester [ukiuro7]', overlay=true, process_orders_on_close=true, calc_on_every_tick=true, initial_capital = 10000)

//INPUTS- 1