P-Signal Multi Timeframe Trading Strategy

Overview
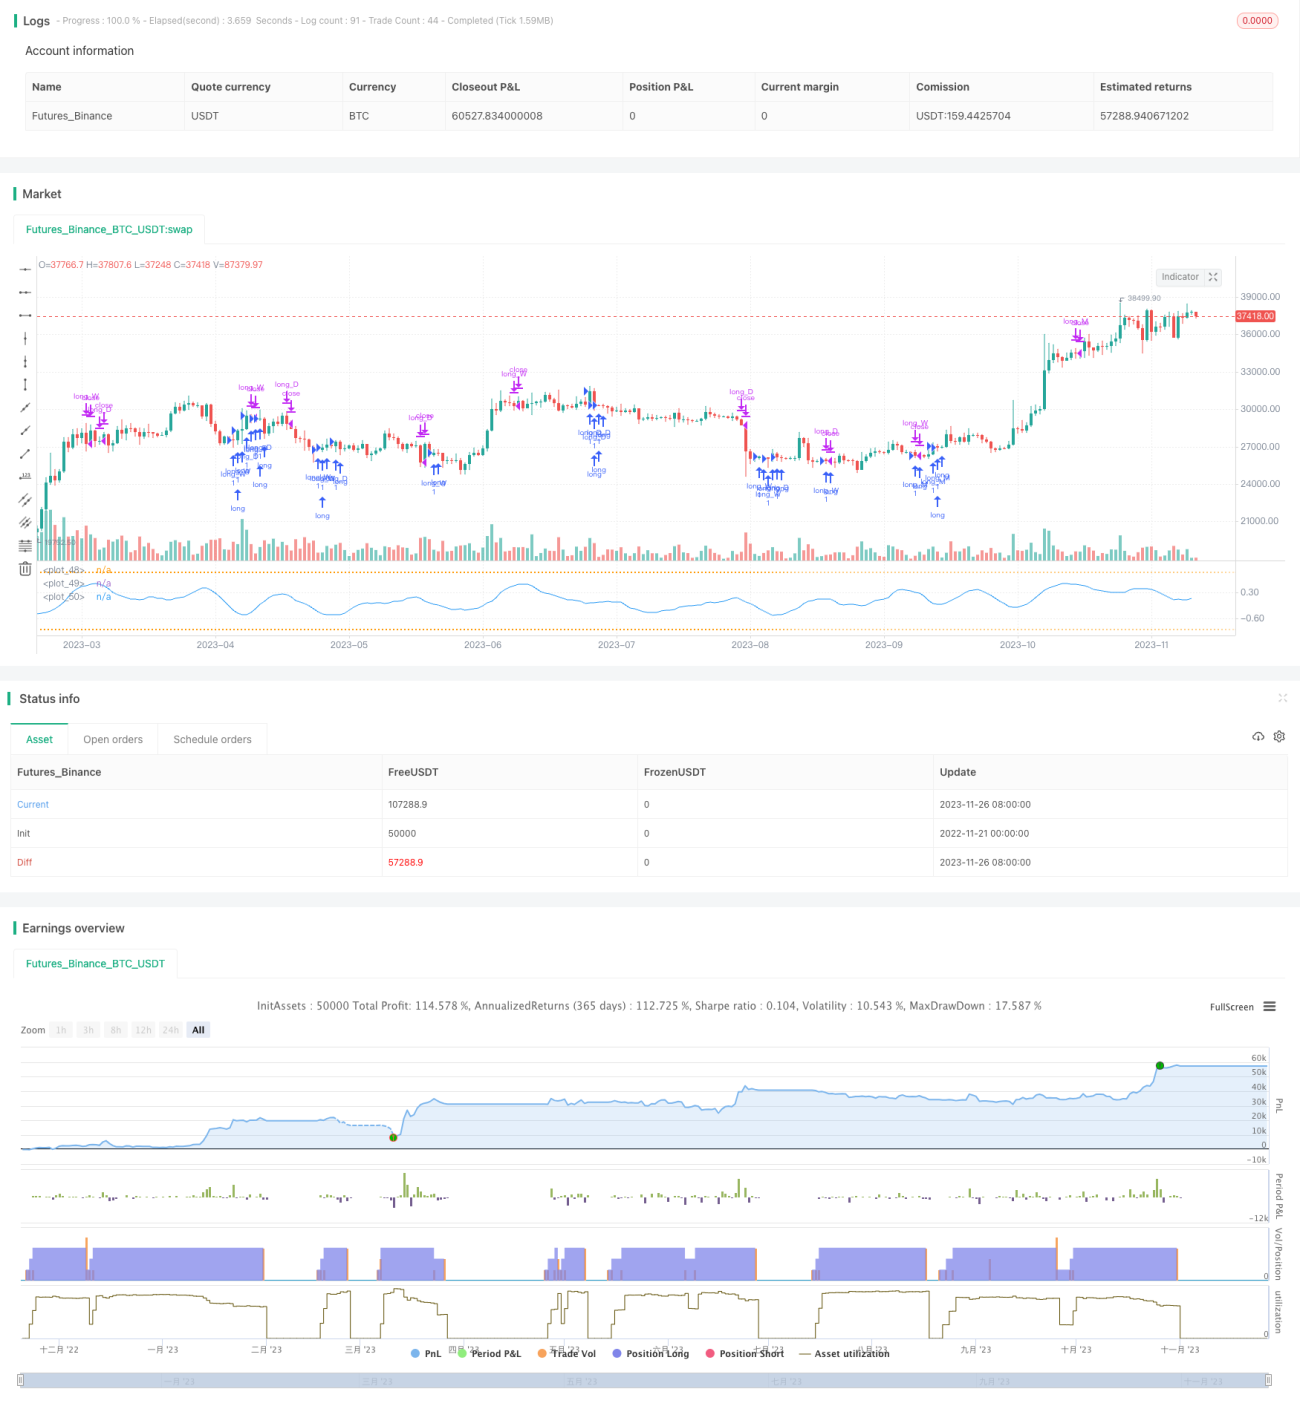
The P-Signal multi timeframe trading strategy is a cryptocurrency algorithmic trading strategy based on statistical principles and multi timeframe analysis. The strategy uses the Gaussian error function and P-Signal indicator to model fit Bitcoin's daily, weekly and monthly charts, and goes long on indicator crosses above 0 and exits on crosses below 0, in order to trade volatility.
Strategy Logic
The core indicator of the P-Signal strategy is the P-Signal itself, which combines statistical standard deviation and simple moving average, and maps it to the -1 to 1 range using the Gaussian error function, to detect whether the market conforms to the normal distribution. The specific calculation formula is as follows:
cpp
fErf(x) = 1.0 - 1.0/(1.0 + 0.5*abs(x)) * exp(-x*x - 1.26551223 + ...) # Gaussian error function
fPSignal(ser, n) = fErf((stdev(ser, n) > 0 ? sma(ser, n)/stdev(ser, n)/sqrt(2) : 1)) # P-Signal indicator
The strategy calculates the P-Signal indicator on the daily, weekly and monthly timeframes for Bitcoin, goes long when the indicator crosses above 0, and exits when it crosses back below 0. Indicator value valves are also set to control repeated entries.
Advantage Analysis
The biggest advantage of the P-Signal strategy is the use of multiple timeframes to improve strategy stability. The daily chart captures short-term market fluctuations, while the weekly and monthly charts filter false breakouts. At the same time, the P-Signal indicator itself also has some predictive capability to amplify the fluctuations of trending moves.
Compared to a single timeframe, multiple timeframes allow the use of daily stops to control drawdown during volatile times, while reducing transaction frequency using the higher timeframes during ranging markets. Overall, this combination allows maximizing profits while minimizing both absolute and relative drawdowns.
Risk Analysis
The biggest risk of the P-Signal strategy is that the indicator itself is a black box to quant traders. We have no way of determining the adaptability of this indicator to specific markets, nor can we determine the optimal range of its parameters. This may lead to poor performance of the strategy in live trading.
In addition, the strategy itself has some limitations. For example, inability to handle violent moves, lagging signal from indicator crossover etc. All these can become hidden troubles during live trading.
To solve these issues, we can adjust indicator parameters, optimize stop loss, introduce more auxiliary indicators etc. But the premise is to test stability across large enough backtesting periods.
Optimization Directions
There are several directions to optimize the P-Signal strategy:
-
Change P-Signal indicator parameters: nIntr_D, nIntr_W and nIntr_M, find optimal parameter combinations
-
Add stop loss methods: trailing stop loss, time stop loss, ATR stop loss etc, find optimal stop loss
-
Introduce auxiliary indicators: improve judgment of specific market conditions, e.g. use MACD to determine trends
-
Optimize position sizing: set dynamic position sizing based on account usage efficiency
-
Machine learning optimization: use neural networks, genetic algorithms to find globally optimal parameters
Conclusion
The P-Signal multi timeframe trading strategy is overall a very promising strategy idea. It combines statistical principles and technical indicators, and uses multi timeframe analysis to improve stability. If we can solve some limitations through extensive backtesting and optimization, it is entirely possible to transform it into a real, usable cryptocurrency algorithmic trading strategy.
/*backtest
start: 2022-11-21 00:00:00
end: 2023-11-27 00:00:00
period: 1d
basePeriod: 1h
exchanges: [{"eid":"Futures_Binance","currency":"BTC_USDT"}]
*/

// **********************************************************************************************************
// This source code is subject to the terms of the Mozilla Public License 2.0 at https://mozilla.org/MPL/2.0/
// P-Signal Strategy © Kharevsky
// A good strategy should be able to handle backtesting.- 1